The same plot in 14 other libraries — JavaScript: Chart.js, Apache ECharts, Highcharts, MUI X Charts; Python: Altair, Bokeh, lets-plot, Matplotlib, Plotly, plotnine, Pygal, Seaborn; R: ggplot2; Julia: Makie.jl. Compare all 15 side by side: Multi-Series Radar Chart in Python, R, Julia and JavaScript.
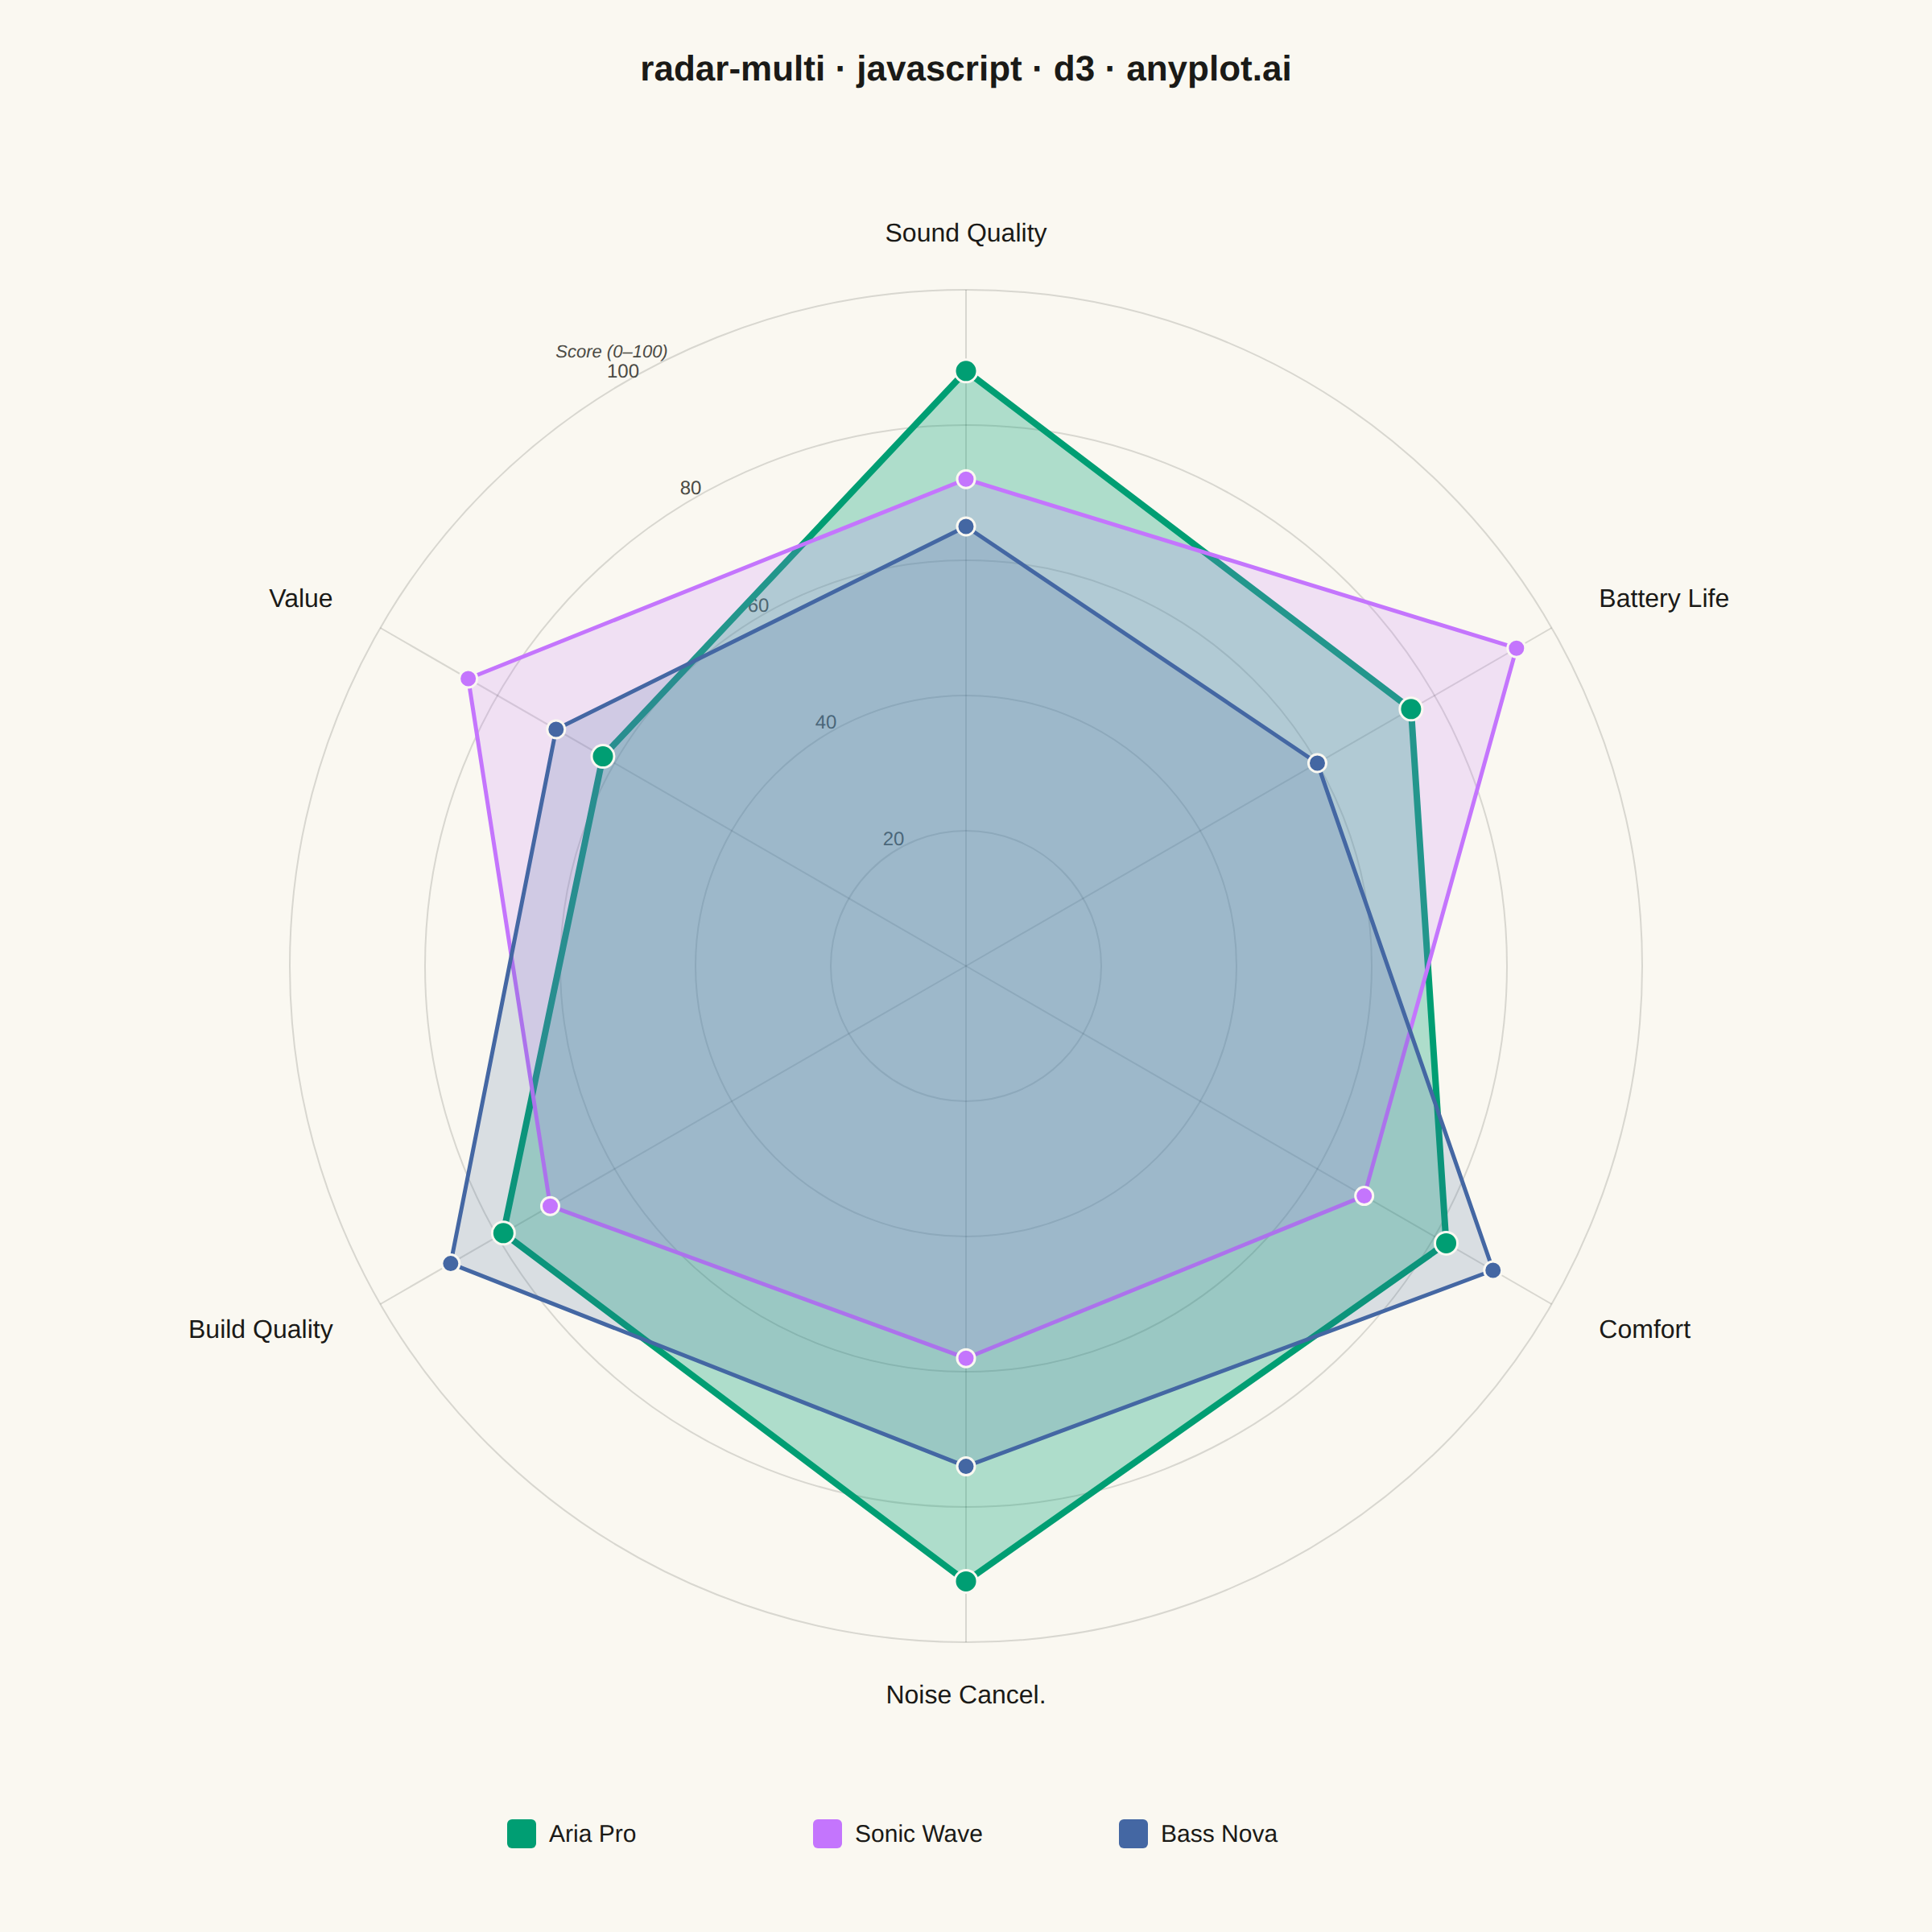
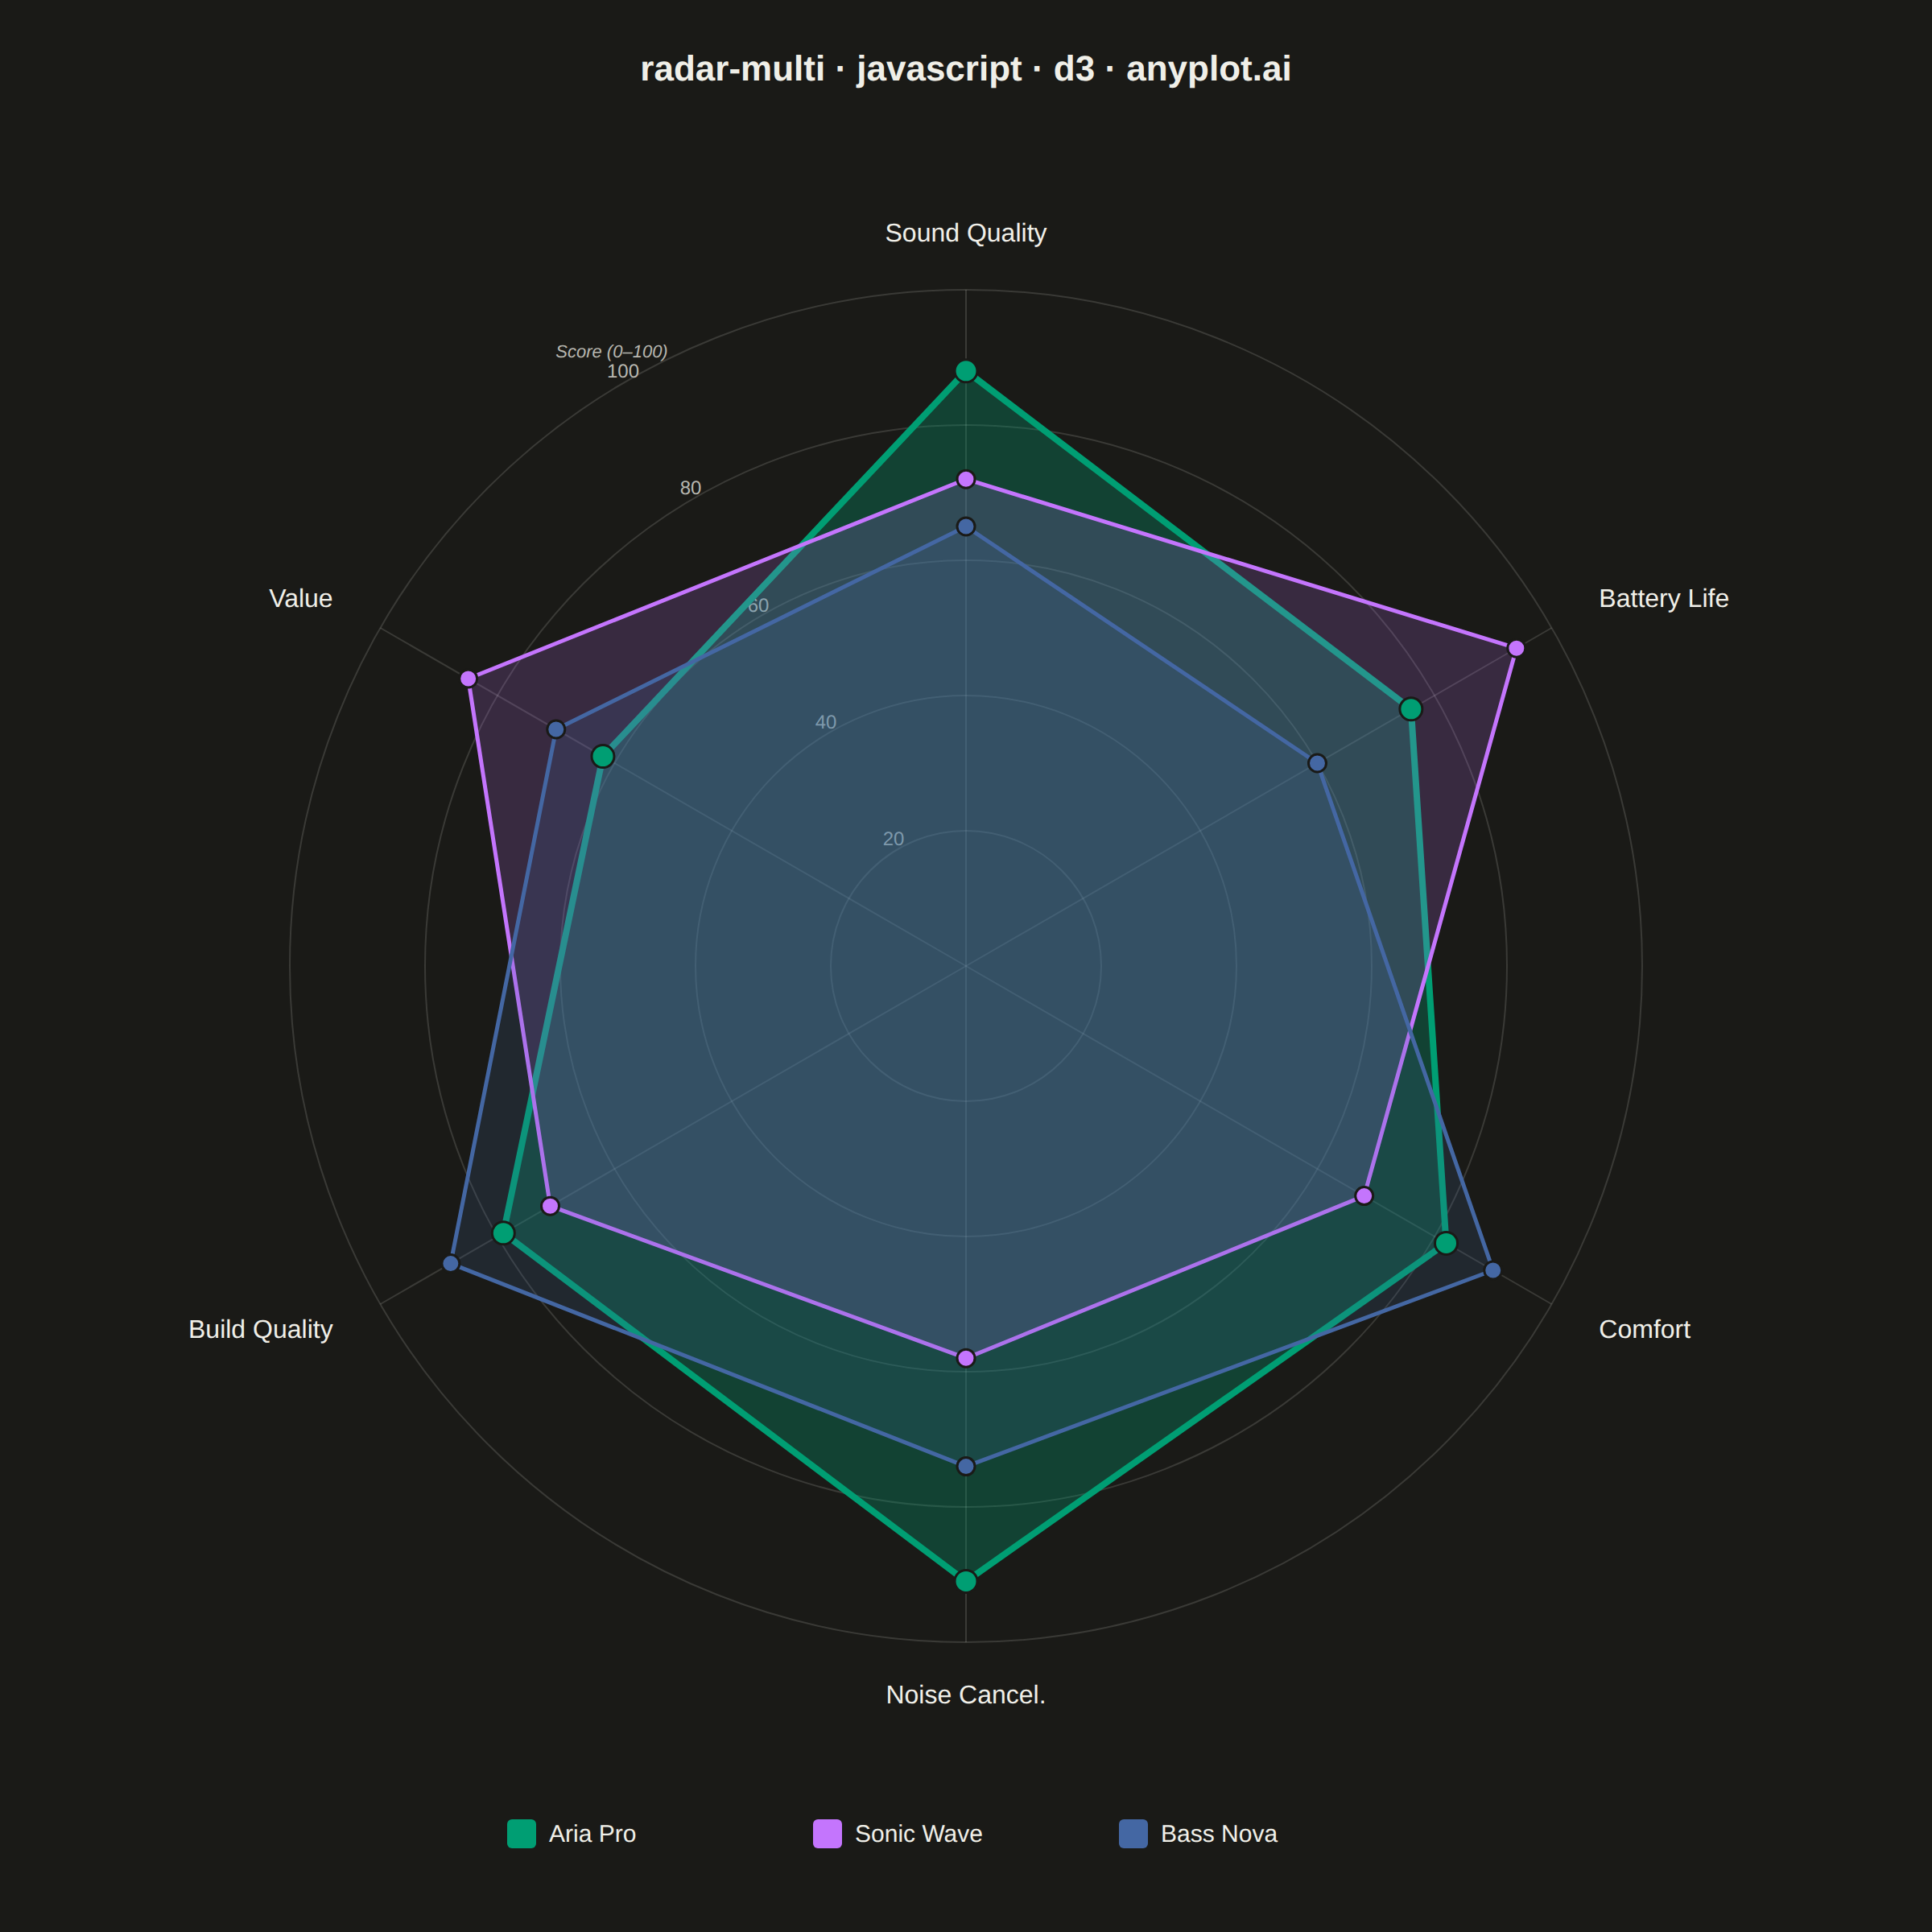
A multi-series radar chart overlays multiple data polygons on shared axes radiating from a center point, enabling direct comparison across several entities or categories. Each series is rendered as a distinct colored polygon, making it easy to identify relative strengths and weaknesses at a glance. This visualization excels at comparative analysis where multiple subjects are evaluated across the same set of metrics.
// anyplot.ai
// radar-multi: Multi-Series Radar Chart
// Library: d3 7.9.0 | JavaScript 22.23.2
// Quality: 93/100 | Created: 2026-08-20

//# anyplot-orientation: square
const t = window.ANYPLOT_TOKENS;
const { width, height } = window.ANYPLOT_SIZE;

// --- Data (in-memory, deterministic) ----------------------------------------
// Wireless headphone models scored 0-100 across shared review criteria.
const axes = [
  "Sound Quality",
  "Battery Life",
  "Comfort",
  "Noise Cancel.",
  "Build Quality",
  "Value",
];

const series = [
  { name: "Aria Pro", values: [88, 76, 82, 91, 79, 62] },
  { name: "Sonic Wave", values: [72, 94, 68, 58, 71, 85] },
  { name: "Bass Nova", values: [65, 60, 90, 74, 88, 70] },
];

const n = axes.length;
const angleSlice = (2 * Math.PI) / n;
const maxValue = 100;
const levels = [20, 40, 60, 80, 100];

// --- Layout -------------------------------------------------------------
const cx = width / 2;
const cy = height / 2;
const radius = Math.min(width, height) / 2 - 180;

const radiusScale = d3.scaleLinear().domain([0, maxValue]).range([0, radius]);
const color = d3.scaleOrdinal().domain(series.map((s) => s.name)).range(t.palette);

// Emphasize the highest-scoring series as a visual focal point among the
// overlapping polygons, computed from the data rather than hardcoded.
const topSeriesName = series.reduce((top, s) =>
  d3.mean(s.values) > d3.mean(top.values) ? s : top
).name;

// --- SVG mount ------------------------------------------------------------
const svg = d3.select("#container").append("svg").attr("width", width).attr("height", height);
const g = svg.append("g").attr("transform", `translate(${cx},${cy})`);

// --- Grid: concentric level circles + radial spokes ------------------------
const gridGroup = g.append("g");
gridGroup
  .selectAll("circle")
  .data(levels)
  .join("circle")
  .attr("r", (d) => radiusScale(d))
  .attr("fill", "none")
  .attr("stroke", t.grid)
  .attr("stroke-width", 1);

const axisAngle = (i) => i * angleSlice - Math.PI / 2;

// Place gridline value labels in the gap between the last and first axis
// spokes, well clear of any axis's data markers regardless of data values.
const levelLabelAngle = axisAngle(0) - angleSlice / 2;
const levelLabelCos = Math.cos(levelLabelAngle);
const levelLabelSin = Math.sin(levelLabelAngle);

gridGroup
  .selectAll(".level-label")
  .data(levels)
  .join("text")
  .attr("class", "level-label")
  .attr("x", (d) => (radiusScale(d) + 6) * levelLabelCos)
  .attr("y", (d) => (radiusScale(d) + 6) * levelLabelSin)
  .attr("text-anchor", "middle")
  .attr("dominant-baseline", "middle")
  .attr("fill", t.inkSoft)
  .style("font-size", "12px")
  .text((d) => d);

g.append("text")
  .attr("class", "level-caption")
  .attr("x", (radius + 20) * levelLabelCos)
  .attr("y", (radius + 20) * levelLabelSin)
  .attr("text-anchor", "middle")
  .attr("dominant-baseline", "middle")
  .attr("fill", t.inkSoft)
  .style("font-size", "11px")
  .style("font-style", "italic")
  .text("Score (0–100)");

g.append("g")
  .selectAll("line")
  .data(axes)
  .join("line")
  .attr("x1", 0)
  .attr("y1", 0)
  .attr("x2", (d, i) => radiusScale(maxValue) * Math.cos(axisAngle(i)))
  .attr("y2", (d, i) => radiusScale(maxValue) * Math.sin(axisAngle(i)))
  .attr("stroke", t.grid)
  .attr("stroke-width", 1);

// --- Axis labels --------------------------------------------------------
const labelRadius = radius + 34;
g.append("g")
  .selectAll("text")
  .data(axes)
  .join("text")
  .attr("x", (d, i) => labelRadius * Math.cos(axisAngle(i)))
  .attr("y", (d, i) => labelRadius * Math.sin(axisAngle(i)))
  .attr("text-anchor", (d, i) => {
    const c = Math.cos(axisAngle(i));
    if (c > 0.15) return "start";
    if (c < -0.15) return "end";
    return "middle";
  })
  .attr("dominant-baseline", "middle")
  .attr("fill", t.ink)
  .style("font-size", "16px")
  .style("font-weight", "500")
  .text((d) => d);

// --- Data polygons --------------------------------------------------------
const radarLine = d3
  .lineRadial()
  .angle((d, i) => i * angleSlice)
  .radius((d) => radiusScale(d))
  .curve(d3.curveLinearClosed);

const seriesGroup = g.append("g");

seriesGroup
  .selectAll(".radar-area")
  .data(series)
  .join("path")
  .attr("class", "radar-area")
  .attr("d", (d) => radarLine(d.values))
  .attr("fill", (d) => color(d.name))
  .attr("fill-opacity", (d) => (d.name === topSeriesName ? 0.3 : 0.18))
  .attr("stroke", (d) => color(d.name))
  .attr("stroke-width", (d) => (d.name === topSeriesName ? 4 : 2.5))
  .attr("stroke-linejoin", "round");

seriesGroup
  .selectAll(".radar-dots")
  .data(series)
  .join("g")
  .attr("class", "radar-dots")
  .attr("fill", (d) => color(d.name))
  .each(function (d) {
    d3.select(this)
      .selectAll("circle")
      .data(d.values)
      .join("circle")
      .attr("cx", (v, i) => radiusScale(v) * Math.cos(axisAngle(i)))
      .attr("cy", (v, i) => radiusScale(v) * Math.sin(axisAngle(i)))
      .attr("r", d.name === topSeriesName ? 7 : 5.5)
      .attr("stroke", t.pageBg)
      .attr("stroke-width", 1.5);
  });

// --- Legend -----------------------------------------------------------------
const legendItemWidth = 190;
const legendWidth = series.length * legendItemWidth;
const legend = svg
  .append("g")
  .attr("transform", `translate(${cx - legendWidth / 2},${height - 56})`);

const legendItems = legend
  .selectAll(".legend-item")
  .data(series)
  .join("g")
  .attr("class", "legend-item")
  .attr("transform", (d, i) => `translate(${i * legendItemWidth},0)`);

legendItems
  .append("rect")
  .attr("width", 18)
  .attr("height", 18)
  .attr("y", -14)
  .attr("rx", 3)
  .attr("fill", (d) => color(d.name));

legendItems
  .append("text")
  .attr("x", 26)
  .attr("y", 0)
  .attr("fill", t.ink)
  .style("font-size", "15px")
  .text((d) => d.name);

// --- Title ------------------------------------------------------------------
svg
  .append("text")
  .attr("x", width / 2)
  .attr("y", 50)
  .attr("text-anchor", "middle")
  .attr("fill", t.ink)
  .style("font-size", "22px")
  .style("font-weight", "600")
  .text("radar-multi · javascript · d3 · anyplot.ai");
Runnable source as JSON, for any HTTP client: https://api.anyplot.ai/specs/radar-multi/d3/code. Any spec id and library id listed in llms-full.txt fit the same URL shape; every URL below is complete and callable.
{
  "spec_id": "radar-multi",
  "language": "javascript",
  "library": "d3",
  "page": "https://anyplot.ai/radar-multi/javascript/d3",
  "hub": "https://anyplot.ai/radar-multi",
  "code_json": "https://api.anyplot.ai/specs/radar-multi/d3/code",
  "spec_json": "https://api.anyplot.ai/specs/radar-multi",
  "render_light_png": "https://storage.googleapis.com/anyplot-images/plots/radar-multi/javascript/d3/plot-light.png",
  "render_dark_png": "https://storage.googleapis.com/anyplot-images/plots/radar-multi/javascript/d3/plot-dark.png",
  "interactive_light_html": "https://storage.googleapis.com/anyplot-images/plots/radar-multi/javascript/d3/plot-light.html",
  "interactive_dark_html": "https://storage.googleapis.com/anyplot-images/plots/radar-multi/javascript/d3/plot-dark.html",
  "quality_score": 93.0,
  "license": "MIT",
  "guide": "https://anyplot.ai/llms.txt"
}
Part of Multi-Series Radar Chart on anyplot.ai.