The same plot in 14 other libraries — JavaScript: Chart.js, D3.js, Apache ECharts, Highcharts; Python: Altair, Bokeh, lets-plot, Matplotlib, Plotly, plotnine, Pygal, Seaborn; R: ggplot2; Julia: Makie.jl. Compare all 15 side by side: Multi-Series Radar Chart in Python, R, Julia and JavaScript.
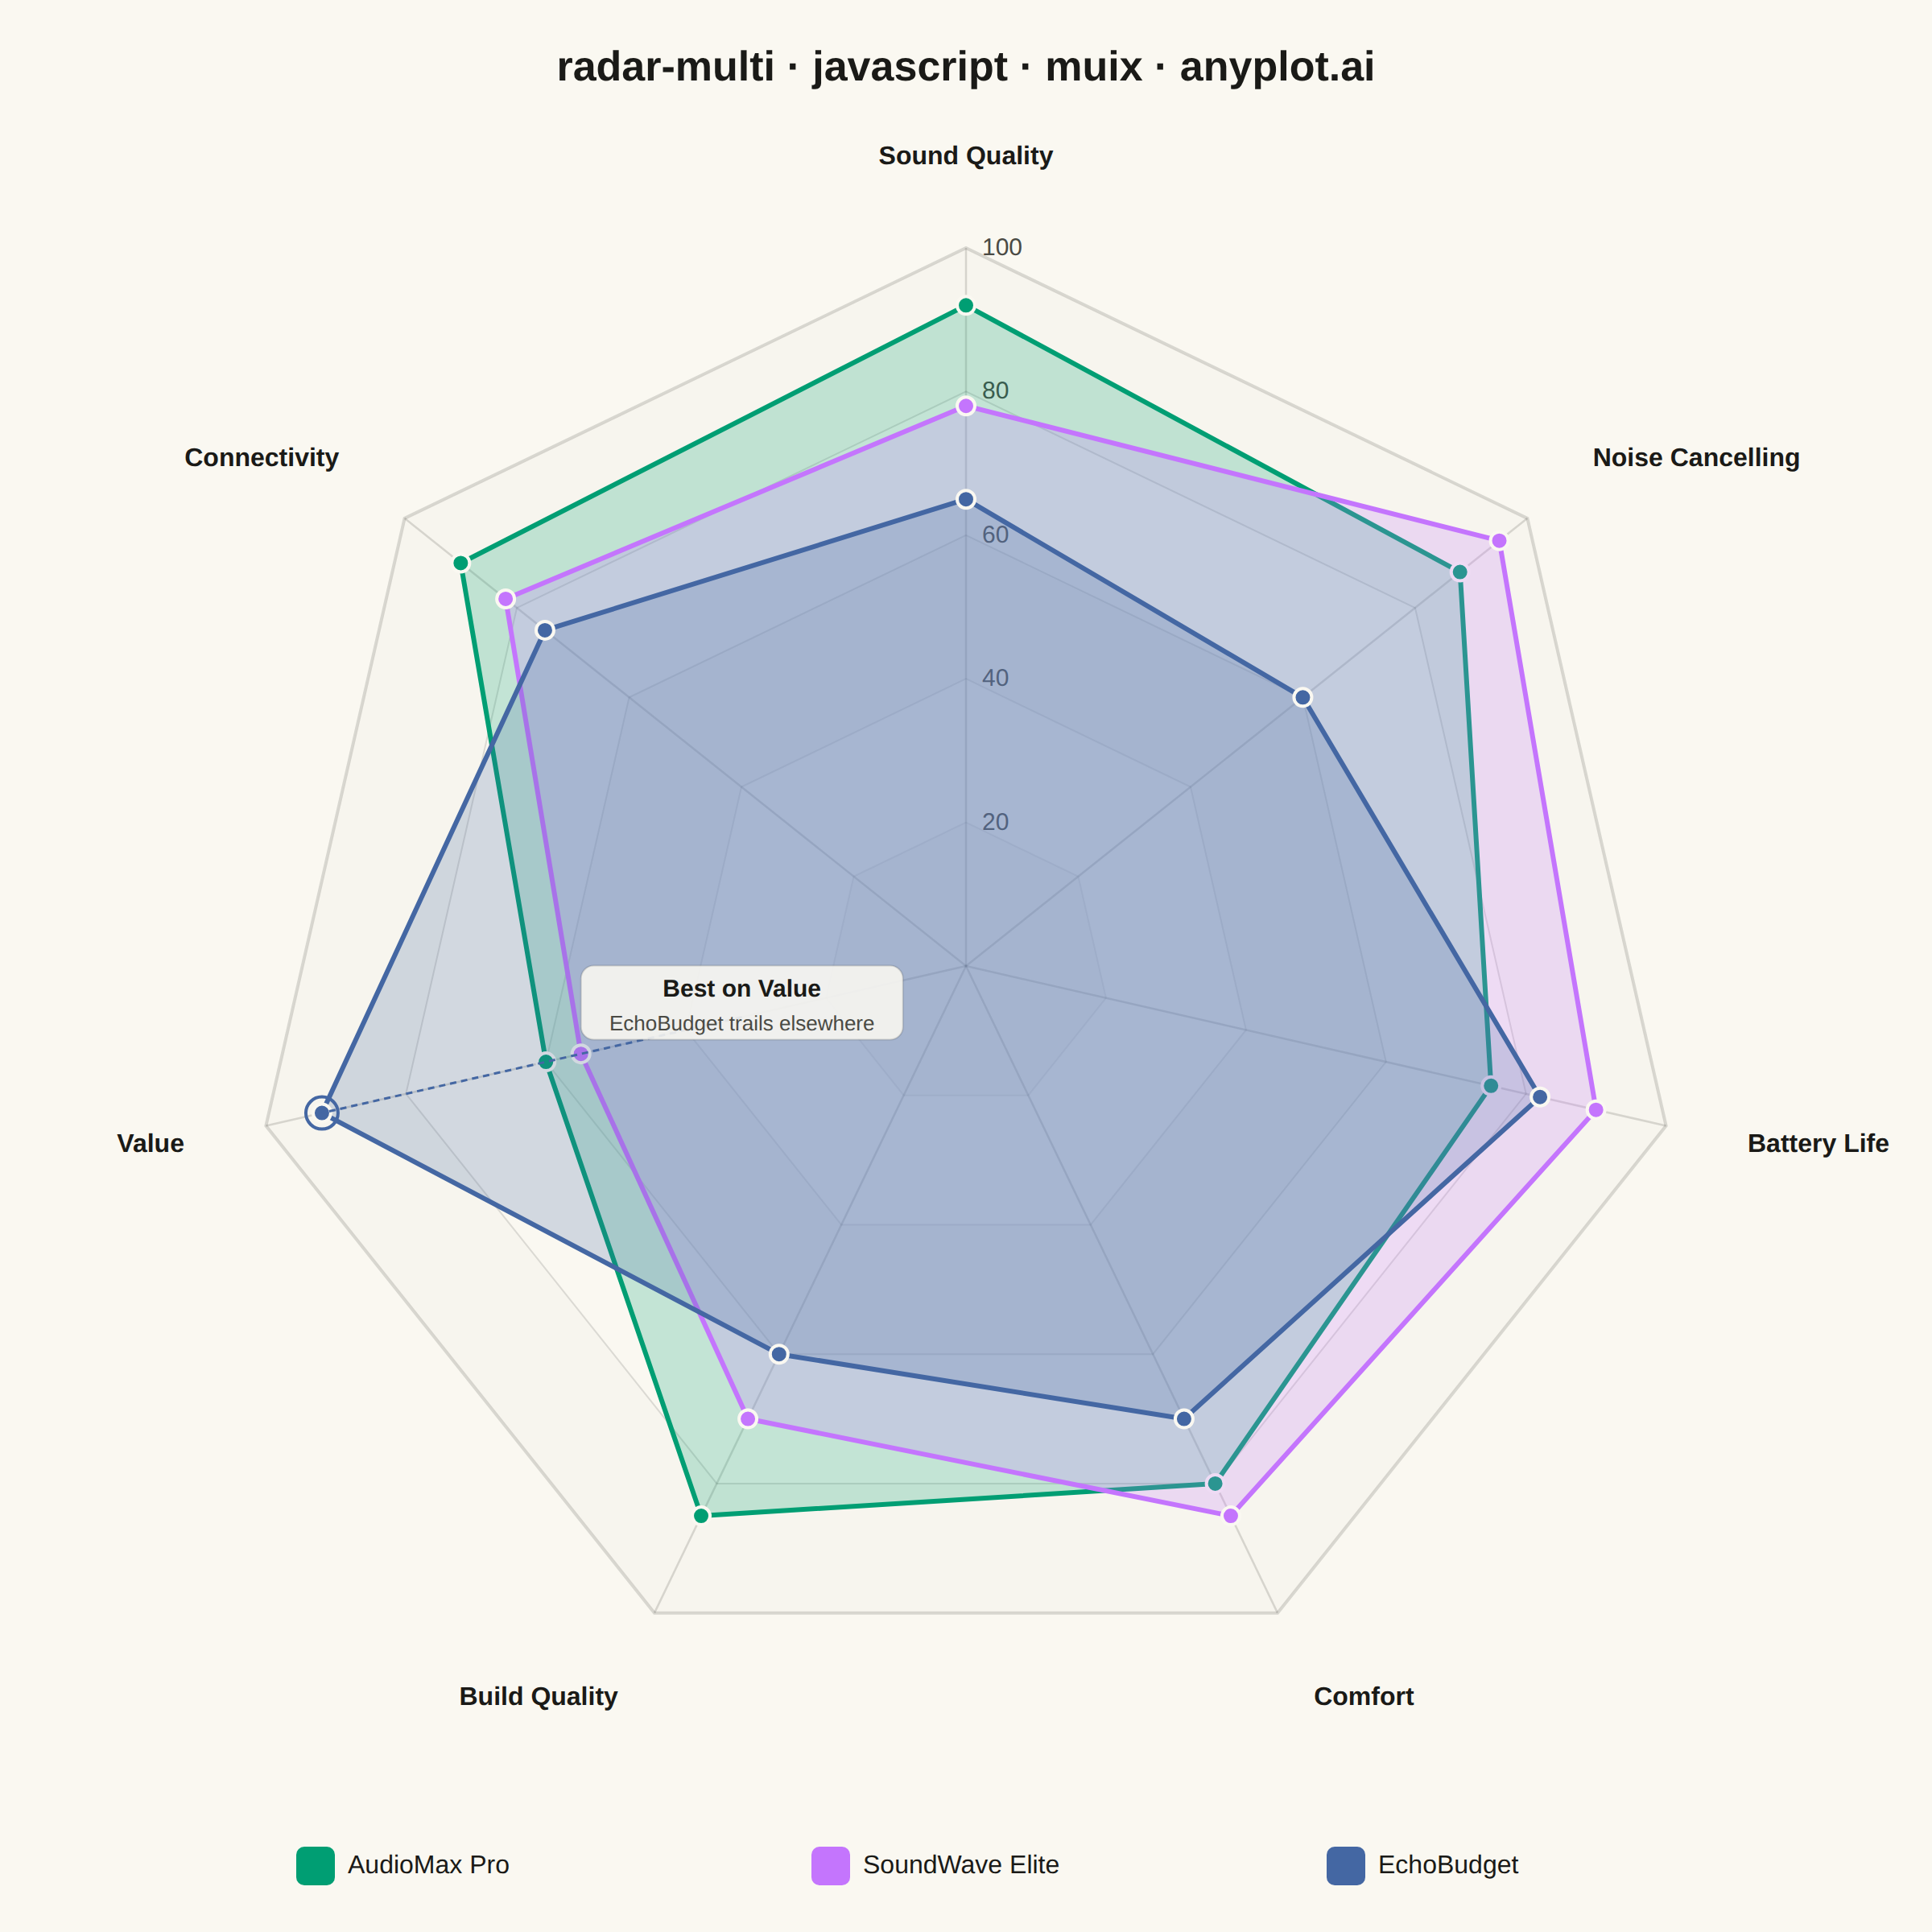
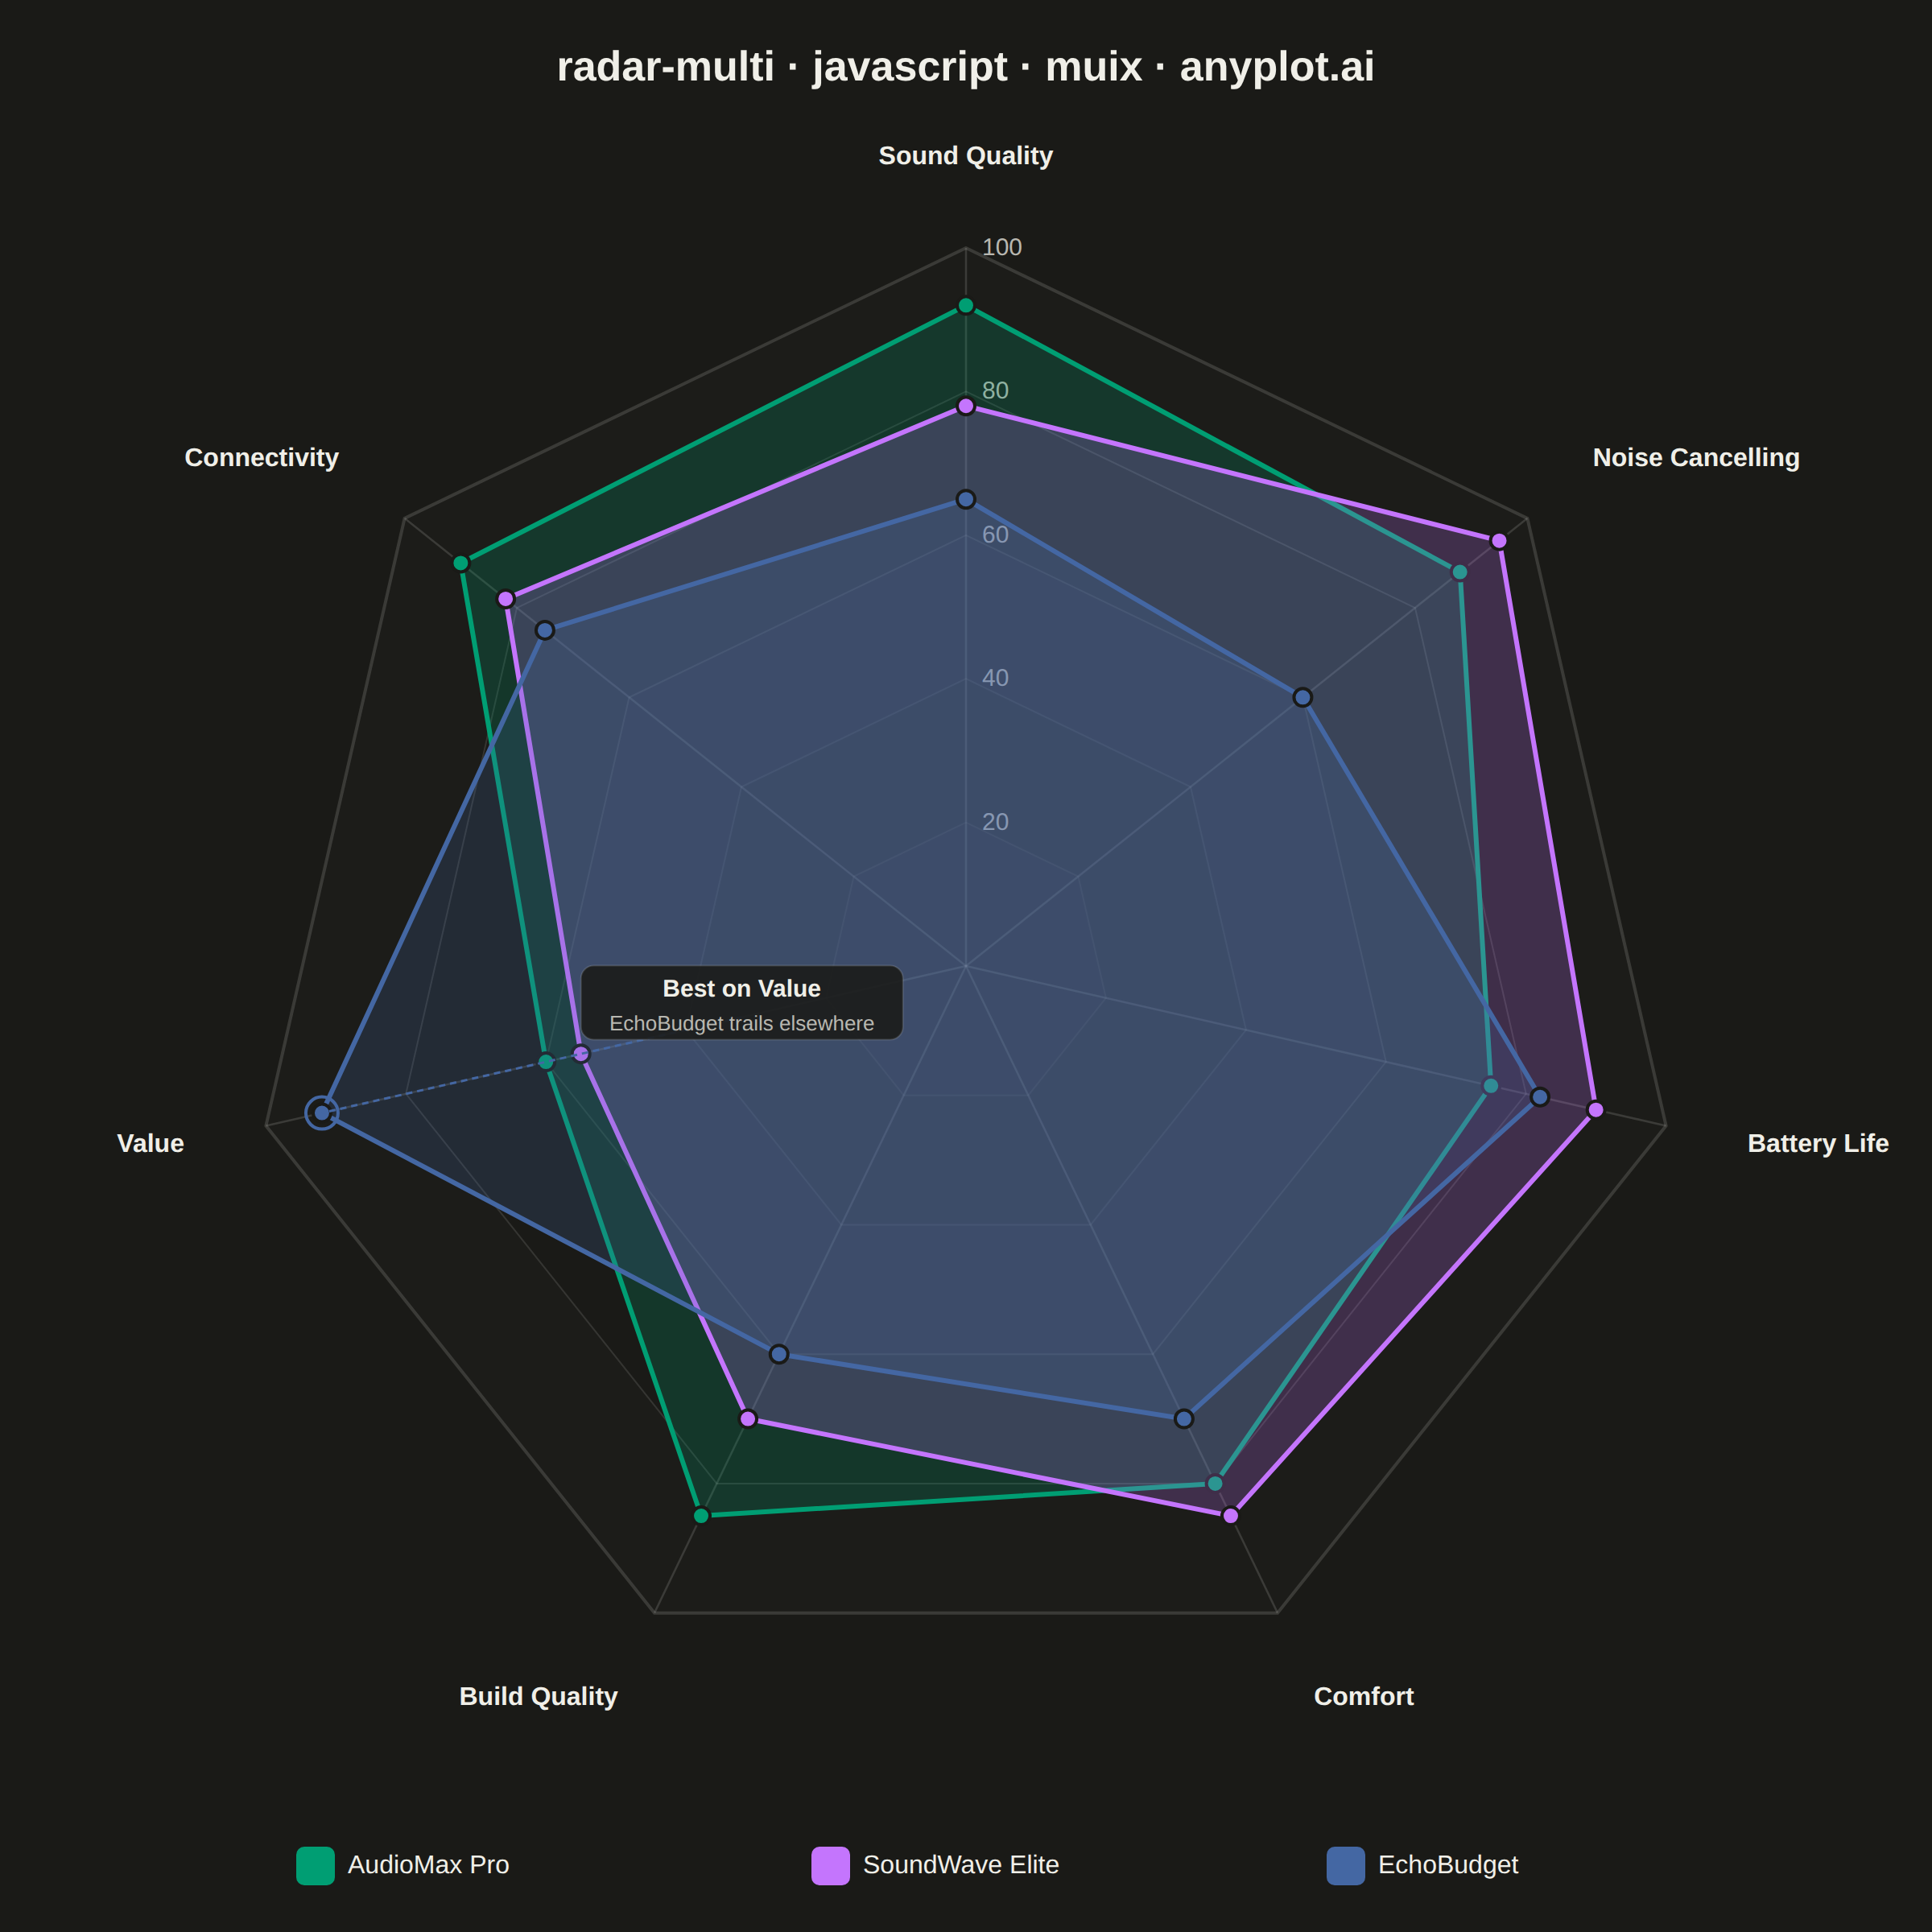
A multi-series radar chart overlays multiple data polygons on shared axes radiating from a center point, enabling direct comparison across several entities or categories. Each series is rendered as a distinct colored polygon, making it easy to identify relative strengths and weaknesses at a glance. This visualization excels at comparative analysis where multiple subjects are evaluated across the same set of metrics.
// anyplot.ai
// radar-multi: Multi-Series Radar Chart
// Library: muix 7.29.1 | JavaScript 22.23.2
// Quality: 90/100 | Created: 2026-08-20
//# anyplot-orientation: square
// anyplot.ai
// radar-multi: Multi-Series Radar Chart
// Library: MUI X Charts | React | Node 22
// License: @mui/x-charts — MIT (community). Pro/Premium are out of scope.
// Quality: pending | Created: 2026-08-20
import { ChartContainer } from "@mui/x-charts/ChartContainer";
import { useDrawingArea } from "@mui/x-charts/hooks";

// @mui/x-charts 7.x community has no RadarChart component (added in v8), so the
// radar is composed on MUI X's own charting surface: ChartContainer provides the
// sized <svg> + drawing area, and useDrawingArea() gives the plot rect we map the
// polar geometry onto. Everything is real data drawn to scale — no faked chrome.

const t = window.ANYPLOT_TOKENS;
const size = window.ANYPLOT_SIZE;

// Theme-adaptive chrome (ThemeProvider handles MUI text; these are for our SVG).
const INK = t.ink;
const INK_SOFT = t.inkSoft;
const GRID = t.grid;
const PAGE_BG = t.pageBg;

// --- Data (in-memory, deterministic) — noise-cancelling headphone comparison --
const axes = [
  "Sound Quality",
  "Noise Cancelling",
  "Battery Life",
  "Comfort",
  "Build Quality",
  "Value",
  "Connectivity",
];
const series = [
  { label: "AudioMax Pro", color: t.palette[0], values: [92, 88, 75, 80, 85, 60, 90] },
  { label: "SoundWave Elite", color: t.palette[1], values: [78, 95, 90, 85, 70, 55, 82] },
  { label: "EchoBudget", color: t.palette[2], values: [65, 60, 82, 70, 60, 92, 75] },
];
const MAX = 100;
const RINGS = [20, 40, 60, 80, 100];
const N = axes.length;

// Axis i points from the top (-90°) going clockwise; SVG y grows downward.
const angleOf = (i) => (-90 + (i * 360) / N) * (Math.PI / 180);

// --- Radar layer: rendered as children inside MUI X's ChartsSurface -----------
function RadarLayer() {
  const area = useDrawingArea();
  const cx = area.left + area.width / 2;
  const cy = area.top + area.height / 2;
  const half = Math.min(area.width, area.height) / 2;
  const R = half - 58; // data radius; the margin between R and half holds labels
  const labelR = half - 6;

  const point = (frac, i) => {
    const a = angleOf(i);
    return [cx + frac * R * Math.cos(a), cy + frac * R * Math.sin(a)];
  };
  const polygon = (frac) => axes.map((_, i) => point(frac, i).join(",")).join(" ");

  // Data-storytelling focal point: EchoBudget is the standout trade-off in this
  // dataset — it trails on every axis except Value, where it clearly leads
  // (92 vs. 60/55), the classic "budget pick wins on the one thing that
  // matters most to price-sensitive buyers" story.
  const echo = series.find((s) => s.label === "EchoBudget");
  const valueIdx = axes.indexOf("Value");
  const [calloutX, calloutY] = point(echo.values[valueIdx] / MAX, valueIdx);
  const calloutAngle = angleOf(valueIdx);
  const anchorR = R * 0.32;
  const anchorX = cx + anchorR * Math.cos(calloutAngle);
  const anchorY = cy + anchorR * Math.sin(calloutAngle);

  return (
    <g>
      {/* Alternating background bands for depth — page-bg polygons "erase" every
          other ring so the grid reads as banded rings rather than a flat wash */}
      {[...RINGS].reverse().map((level, idx) => (
        <polygon
          key={`band-${level}`}
          points={polygon(level / MAX)}
          fill={idx % 2 === 0 ? GRID : PAGE_BG}
          fillOpacity={idx % 2 === 0 ? 0.07 : 1}
        />
      ))}

      {/* Concentric grid rings at each value level — opacity eases in toward the
          outer ring so the nested grid stays light near the center */}
      {RINGS.map((level) => (
        <polygon
          key={`ring-${level}`}
          points={polygon(level / MAX)}
          fill="none"
          stroke={GRID}
          strokeWidth={level === MAX ? 2 : 1}
          strokeOpacity={0.35 + 0.65 * (level / MAX)}
        />
      ))}

      {/* Radial spokes + outer axis labels */}
      {axes.map((label, i) => {
        const [ox, oy] = point(1, i);
        const a = angleOf(i);
        const lx = cx + labelR * Math.cos(a);
        const ly = cy + labelR * Math.sin(a);
        const cos = Math.cos(a);
        const anchor = cos > 0.15 ? "start" : cos < -0.15 ? "end" : "middle";
        const sin = Math.sin(a);
        const baseline = sin > 0.5 ? "hanging" : sin < -0.5 ? "auto" : "central";
        return (
          <g key={`axis-${label}`}>
            <line x1={cx} y1={cy} x2={ox} y2={oy} stroke={GRID} strokeWidth={1.25} />
            <text
              x={lx}
              y={ly}
              fill={INK}
              fontSize={16}
              fontWeight={600}
              textAnchor={anchor}
              dominantBaseline={baseline}
            >
              {label}
            </text>
          </g>
        );
      })}

      {/* Value tick labels, offset off the top spoke so they read on their own */}
      {RINGS.map((level) => (
        <text
          key={`tick-${level}`}
          x={cx + 10}
          y={cy - (level / MAX) * R}
          fill={INK_SOFT}
          fontSize={15}
          textAnchor="start"
          dominantBaseline="central"
        >
          {level}
        </text>
      ))}

      {/* Series polygons: translucent fill + solid outline + vertex markers */}
      {series.map((s) => (
        <g key={`series-${s.label}`}>
          <polygon
            points={axes.map((_, i) => point(s.values[i] / MAX, i).join(",")).join(" ")}
            fill={s.color}
            fillOpacity={0.22}
            stroke={s.color}
            strokeWidth={3}
            strokeLinejoin="round"
          />
          {axes.map((_, i) => {
            const [px, py] = point(s.values[i] / MAX, i);
            return (
              <circle
                key={`pt-${s.label}-${i}`}
                cx={px}
                cy={py}
                r={5.5}
                fill={s.color}
                stroke={PAGE_BG}
                strokeWidth={2}
              />
            );
          })}
        </g>
      ))}

      {/* Focal-point callout: highlights EchoBudget's Value lead */}
      <g>
        <line
          x1={anchorX}
          y1={anchorY}
          x2={calloutX}
          y2={calloutY}
          stroke={echo.color}
          strokeWidth={1.5}
          strokeDasharray="4 3"
        />
        <circle cx={calloutX} cy={calloutY} r={10} fill="none" stroke={echo.color} strokeWidth={2} />
        <rect
          x={anchorX - 100}
          y={anchorY - 32}
          width={200}
          height={46}
          rx={8}
          fill={PAGE_BG}
          fillOpacity={0.88}
          stroke={GRID}
          strokeWidth={1}
        />
        <text x={anchorX} y={anchorY - 13} fill={INK} fontSize={15} fontWeight={700} textAnchor="middle">
          Best on Value
        </text>
        <text x={anchorX} y={anchorY + 8} fill={INK_SOFT} fontSize={13} textAnchor="middle">
          EchoBudget trails elsewhere
        </text>
      </g>
    </g>
  );
}

// --- Title + legend drawn on the surface, then the radar layer ----------------
function Chrome() {
  const legendGap = 320;
  const legendStart = size.width / 2 - ((series.length - 1) * legendGap) / 2;
  const legendY = size.height - 40;
  return (
    <g>
      <text x={size.width / 2} y={50} fill={INK} fontSize={26} fontWeight={700} textAnchor="middle">
        radar-multi · javascript · muix · anyplot.ai
      </text>
      {series.map((s, i) => {
        const x = legendStart + i * legendGap;
        return (
          <g key={`legend-${s.label}`}>
            <rect x={x - 96} y={legendY - 13} width={24} height={24} rx={5} fill={s.color} />
            <text x={x - 64} y={legendY - 1} fill={INK} fontSize={16} textAnchor="start" dominantBaseline="central">
              {s.label}
            </text>
          </g>
        );
      })}
    </g>
  );
}

// --- Chart (default-exported component — the harness mounts it) ----------------
export default function Chart() {
  return (
    <ChartContainer
      width={size.width}
      height={size.height}
      series={[]}
      margin={{ top: 88, bottom: 88, left: 96, right: 96 }}
      skipAnimation
    >
      <Chrome />
      <RadarLayer />
    </ChartContainer>
  );
}
Runnable source as JSON, for any HTTP client: https://api.anyplot.ai/specs/radar-multi/muix/code. Any spec id and library id listed in llms-full.txt fit the same URL shape; every URL below is complete and callable.
{
  "spec_id": "radar-multi",
  "language": "javascript",
  "library": "muix",
  "page": "https://anyplot.ai/radar-multi/javascript/muix",
  "hub": "https://anyplot.ai/radar-multi",
  "code_json": "https://api.anyplot.ai/specs/radar-multi/muix/code",
  "spec_json": "https://api.anyplot.ai/specs/radar-multi",
  "render_light_png": "https://storage.googleapis.com/anyplot-images/plots/radar-multi/javascript/muix/plot-light.png",
  "render_dark_png": "https://storage.googleapis.com/anyplot-images/plots/radar-multi/javascript/muix/plot-dark.png",
  "interactive_light_html": "https://storage.googleapis.com/anyplot-images/plots/radar-multi/javascript/muix/plot-light.html",
  "interactive_dark_html": "https://storage.googleapis.com/anyplot-images/plots/radar-multi/javascript/muix/plot-dark.html",
  "quality_score": 90.0,
  "license": "MIT",
  "guide": "https://anyplot.ai/llms.txt"
}
Part of Multi-Series Radar Chart on anyplot.ai.