Source code in 15 libraries — Python: Altair, Bokeh, lets-plot, Matplotlib, Plotly, plotnine, Pygal, Seaborn; R: ggplot2; Julia: Makie.jl; JavaScript: Chart.js, D3.js, Apache ECharts, Highcharts, MUI X Charts.
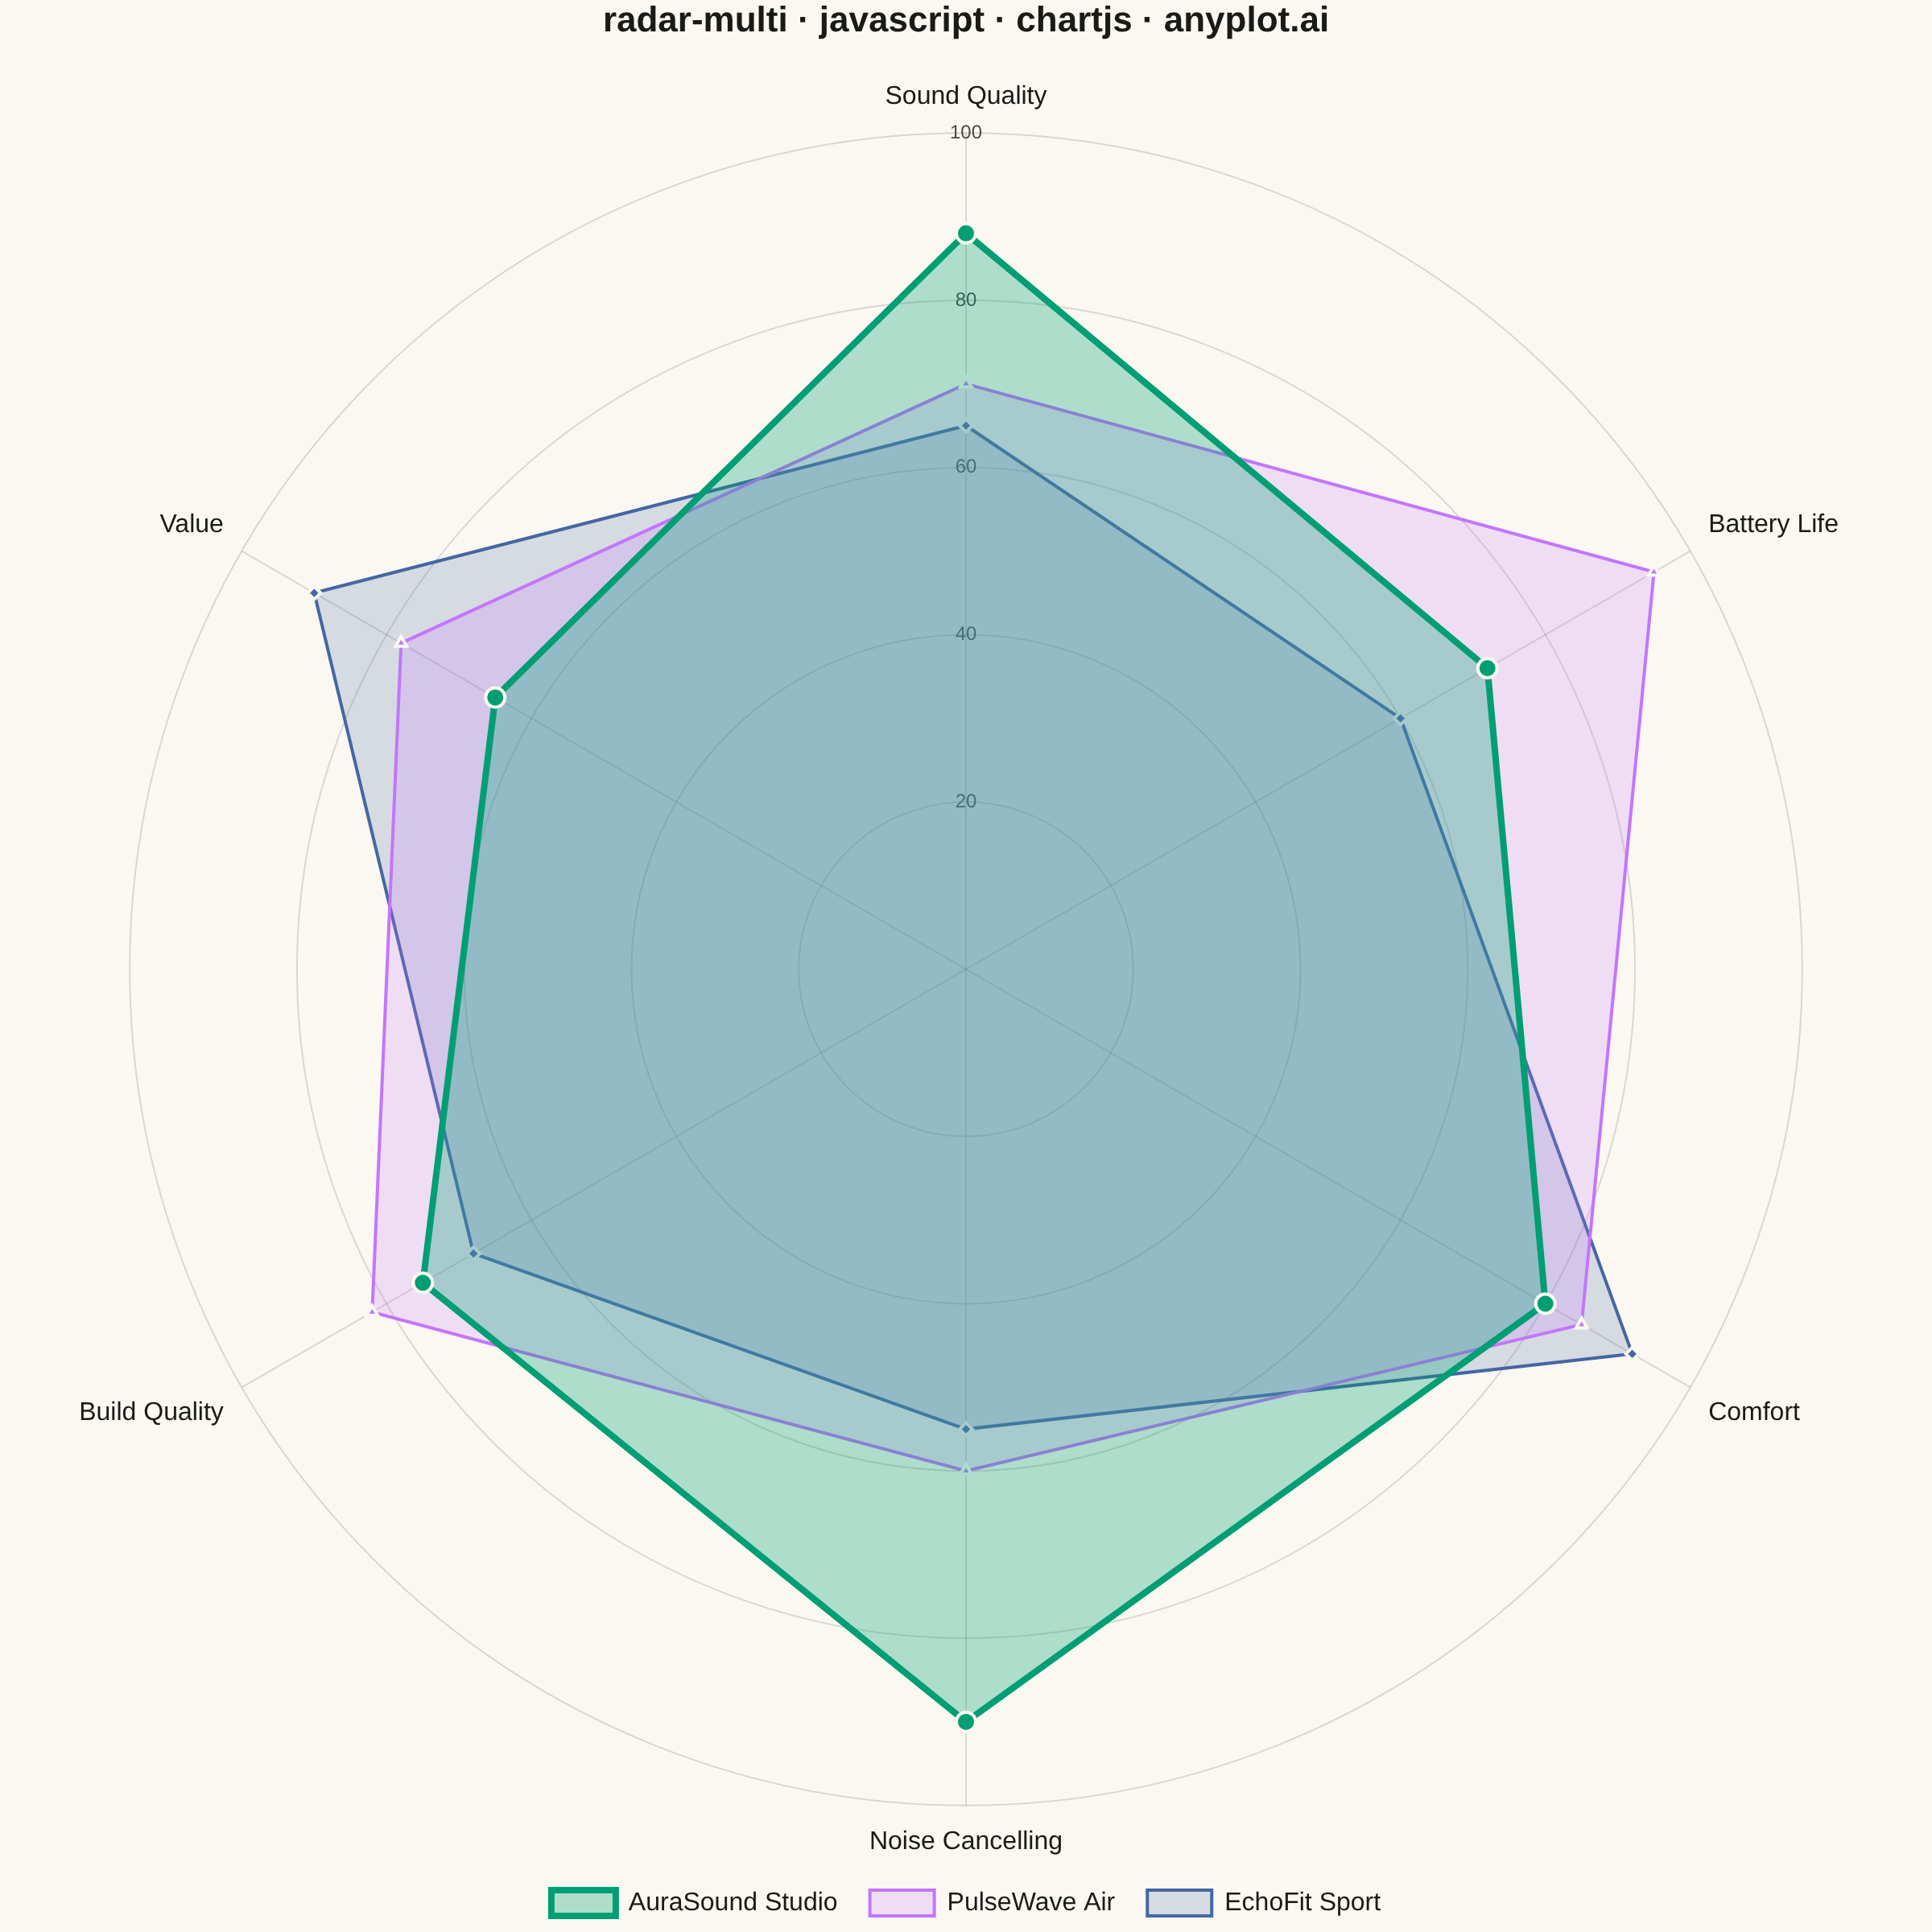
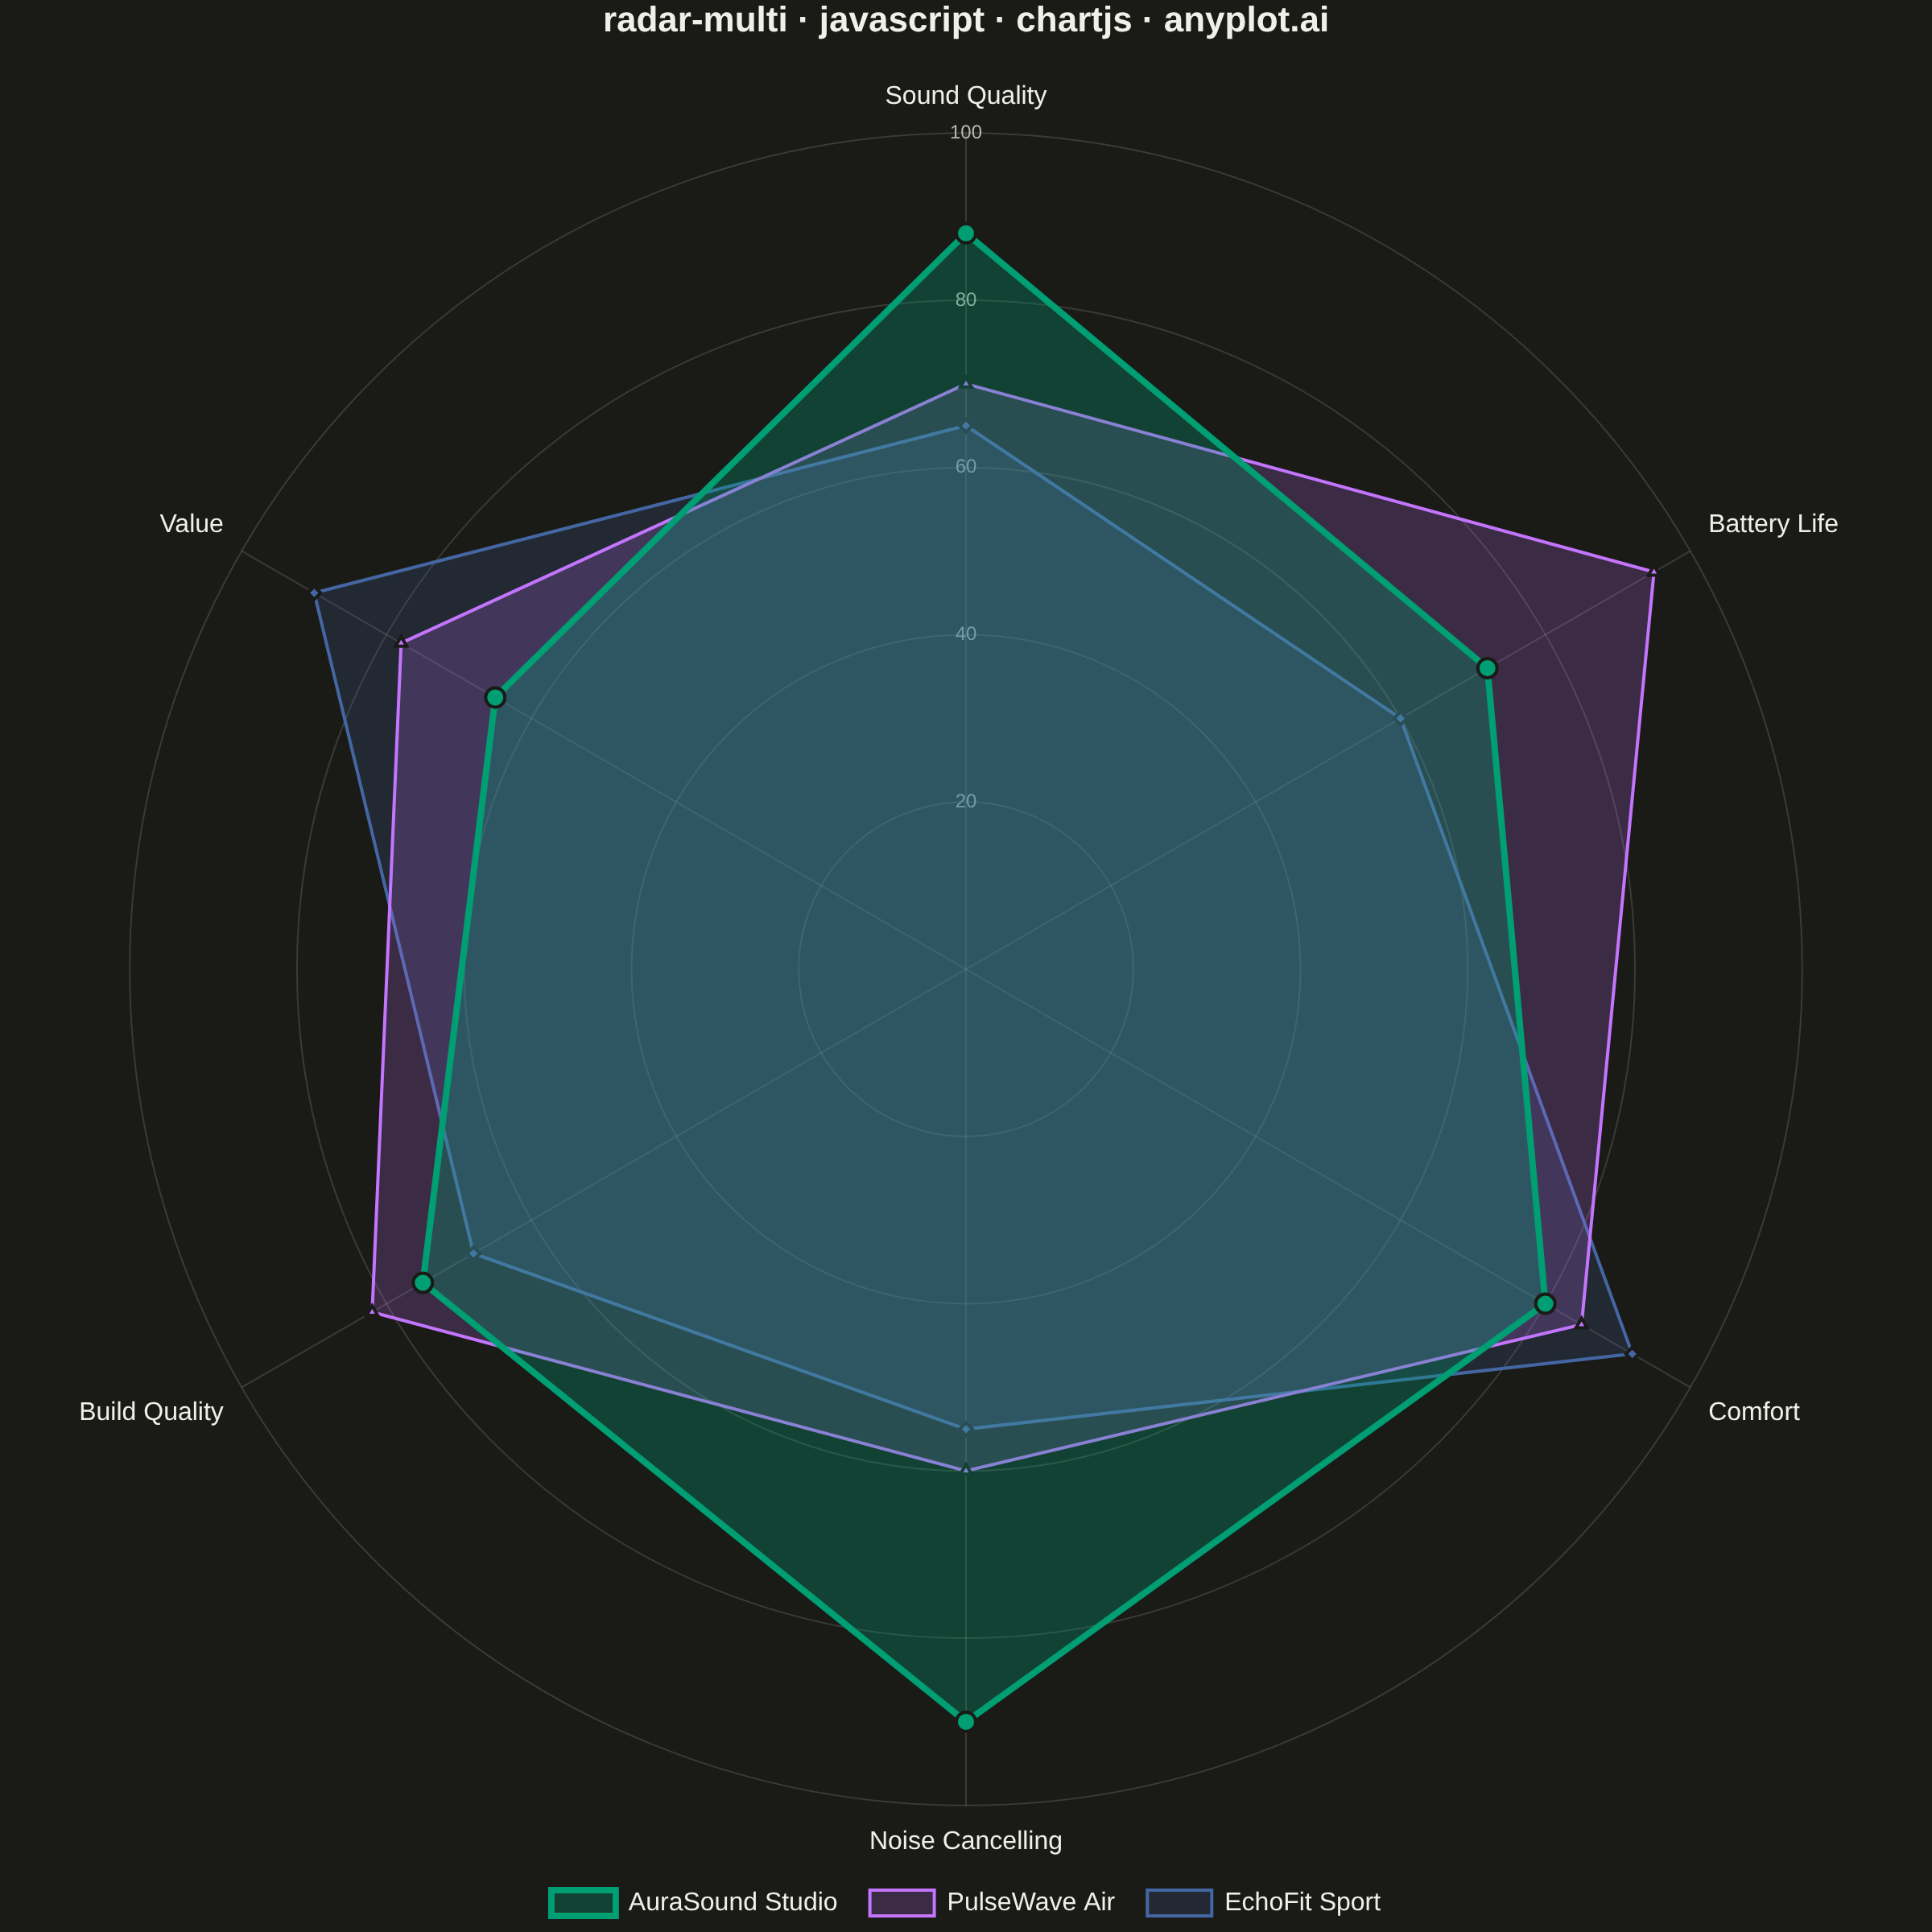
A multi-series radar chart overlays multiple data polygons on shared axes radiating from a center point, enabling direct comparison across several entities or categories. Each series is rendered as a distinct colored polygon, making it easy to identify relative strengths and weaknesses at a glance. This visualization excels at comparative analysis where multiple subjects are evaluated across the same set of metrics.
Preview render from the Chart.js implementation.