The same plot in 14 other libraries — JavaScript: Chart.js, Apache ECharts, Highcharts, MUI X Charts; Python: Altair, Bokeh, lets-plot, Matplotlib, Plotly, plotnine, Pygal, Seaborn; R: ggplot2; Julia: Makie.jl. Compare all 15 side by side: Scatter Plot with LOWESS Regression in Python, R, Julia and JavaScript.
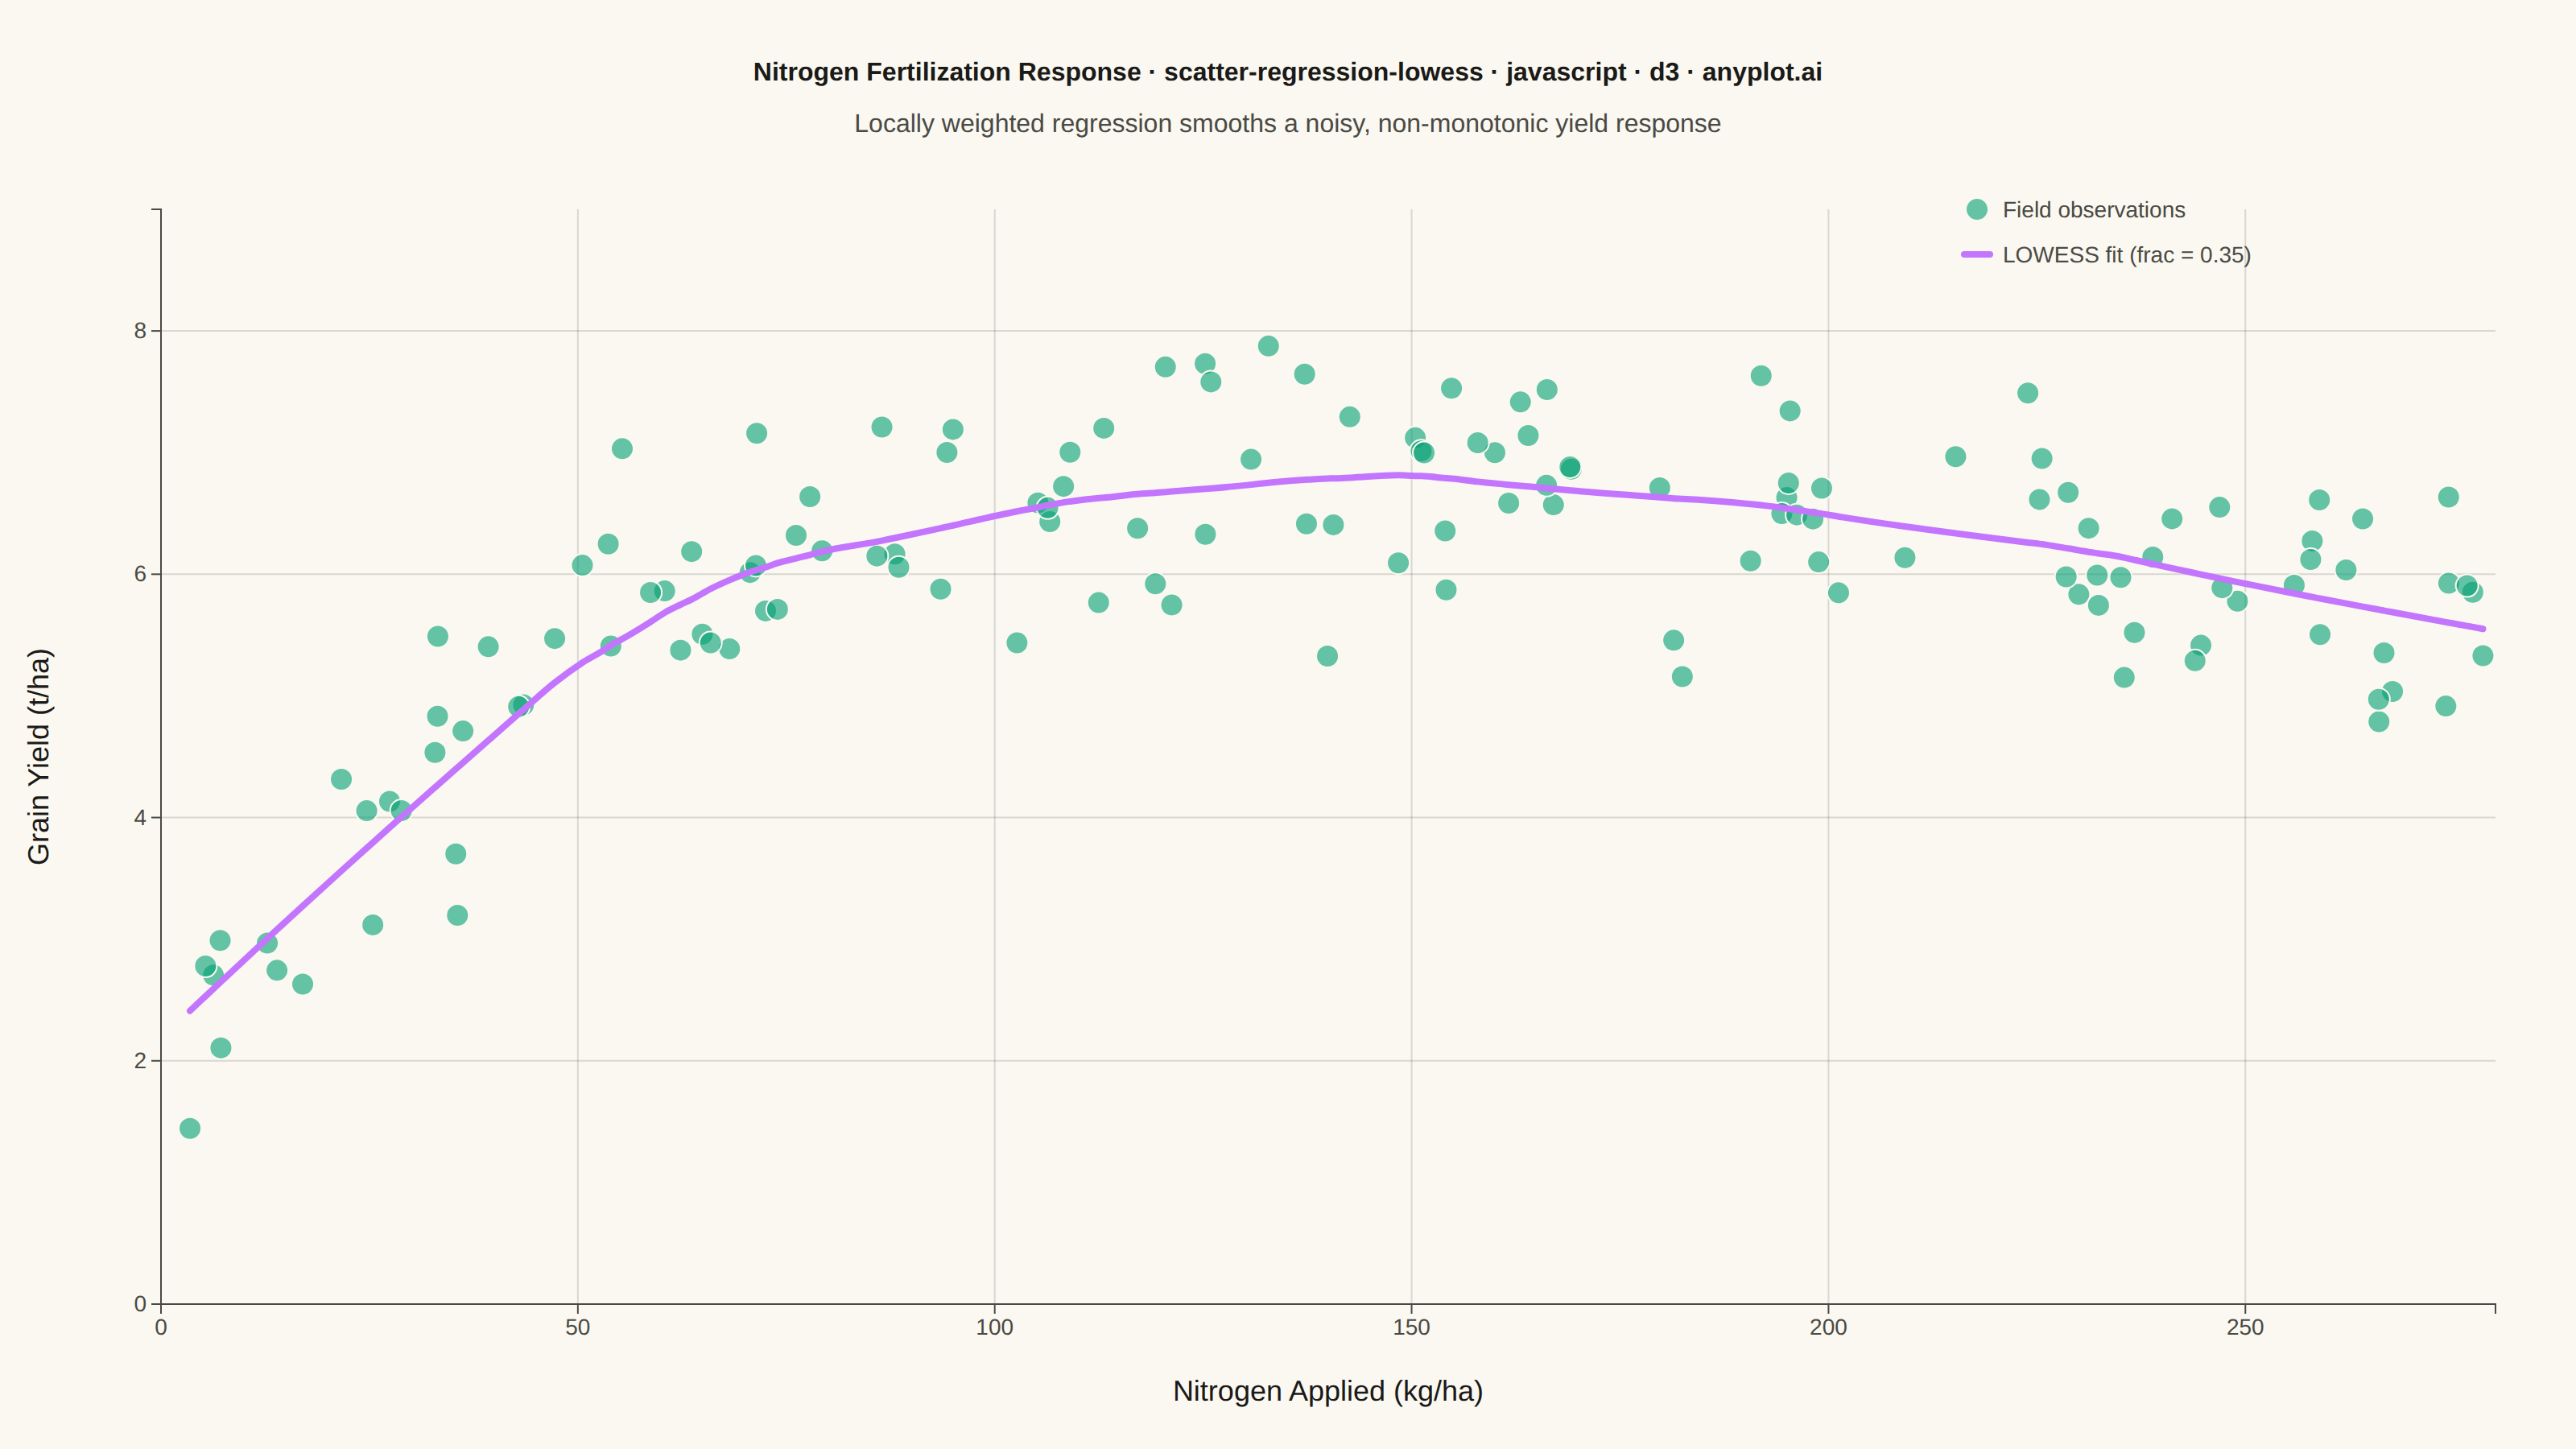
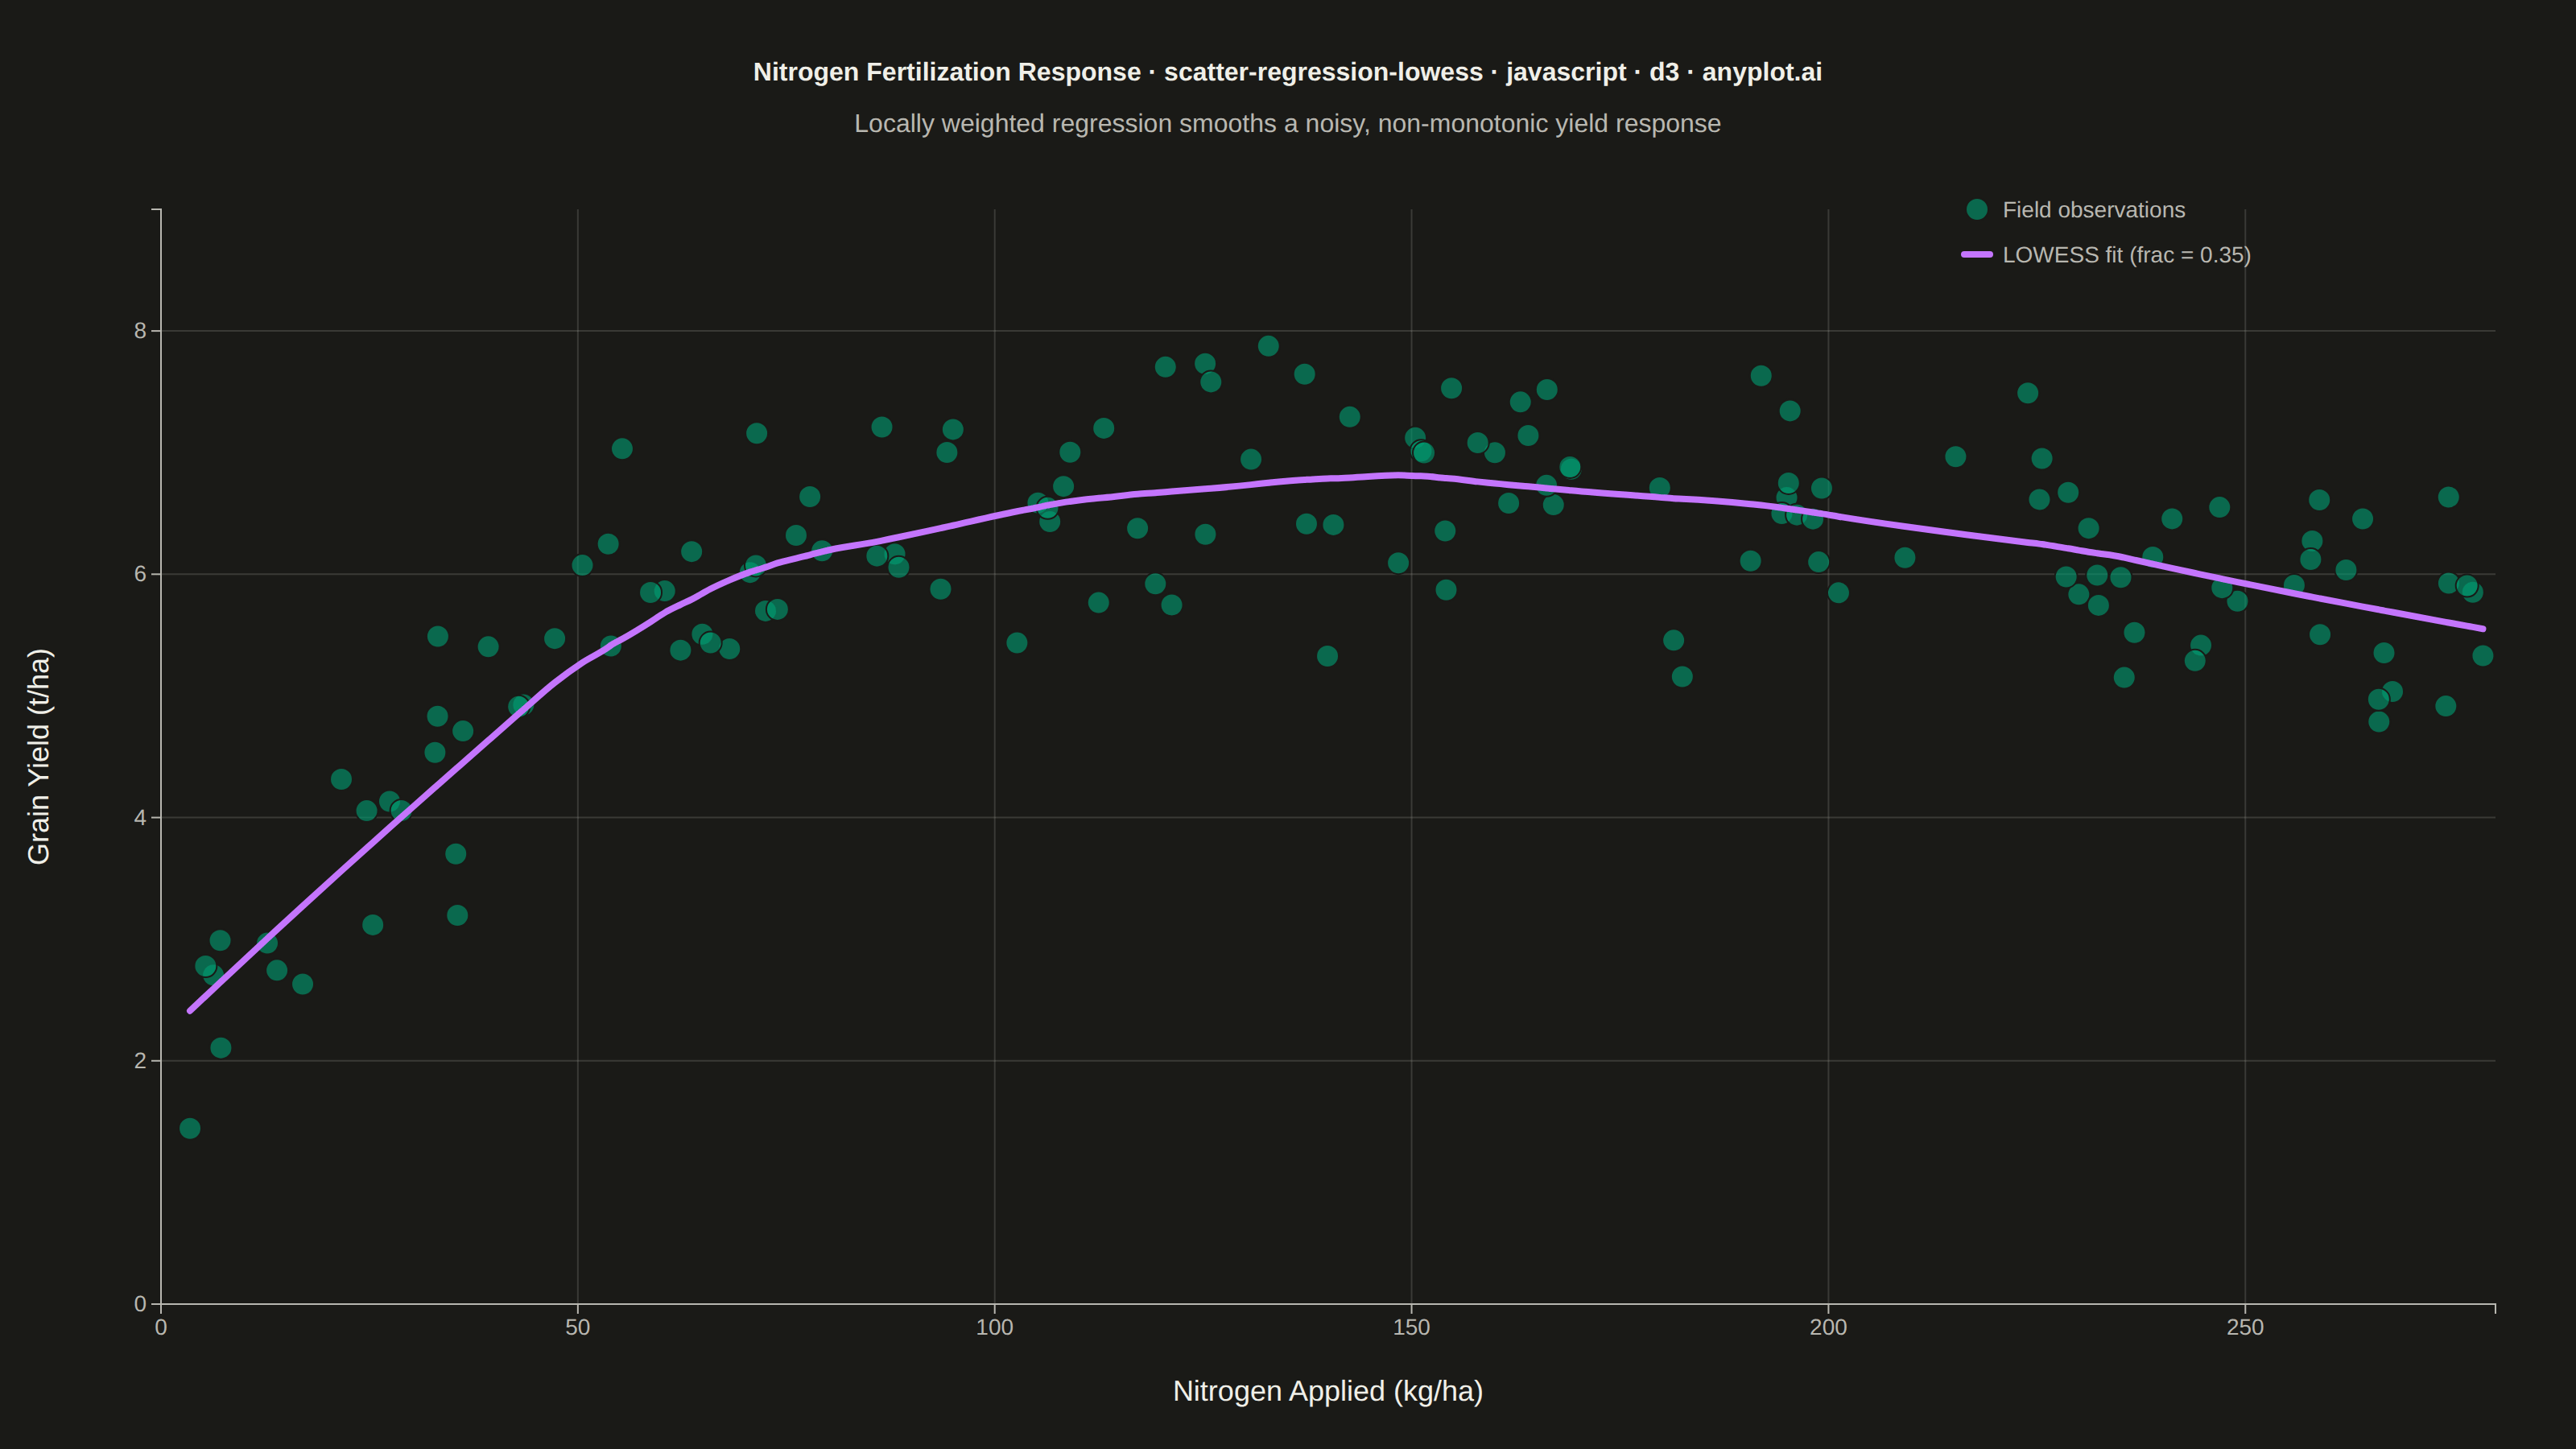
A scatter plot with a LOWESS (Locally Weighted Scatterplot Smoothing) regression curve overlaid. LOWESS is a non-parametric method that fits smooth curves by performing local weighted regressions at each point, adapting to local data patterns without assuming a specific functional form. This makes it ideal for exploring complex relationships where the underlying pattern is unknown or varies across the data range.
// anyplot.ai
// scatter-regression-lowess: Scatter Plot with LOWESS Regression
// Library: d3 7.9.0 | JavaScript 22.23.2
// Quality: 85/100 | Created: 2026-09-09

const t = window.ANYPLOT_TOKENS;
const { width, height } = window.ANYPLOT_SIZE;
const margin = { top: 130, right: 50, bottom: 90, left: 100 };
const iw = width - margin.left - margin.right;
const ih = height - margin.top - margin.bottom;

// --- Data: nitrogen fertilization rate vs. grain yield ----------------------
// Deterministic LCG so the "random" noise is reproducible across runs.
function makeRng(seed) {
  let state = seed >>> 0;
  return () => {
    state = (Math.imul(1664525, state) + 1013904223) >>> 0;
    return state / 4294967296;
  };
}
const rng = makeRng(42);
function randNormal() {
  const u1 = Math.max(rng(), 1e-9);
  const u2 = rng();
  return Math.sqrt(-2 * Math.log(u1)) * Math.cos(2 * Math.PI * u2);
}

// True agronomic response: yield rises with applied nitrogen, then plateaus
// and slightly declines past the optimal rate (over-fertilization penalty).
function trueYield(nitrogenRate) {
  return (
    2.0 +
    6.5 * (1 - Math.exp(-nitrogenRate / 70)) -
    0.00004 * nitrogenRate * nitrogenRate
  );
}

const pointCount = 140;
const nitrogenRate = Array.from({ length: pointCount }, () => rng() * 280);
const grainYield = nitrogenRate.map(
  (rate) => Math.max(0.2, trueYield(rate) + randNormal() * 0.65),
);

// --- LOWESS: tricube-weighted local linear regression ------------------------
function lowess(xs, ys, frac) {
  const n = xs.length;
  const k = Math.max(2, Math.round(frac * n));
  return xs.map((xi) => {
    const dists = xs.map((x) => Math.abs(x - xi));
    const bandwidth = [...dists].sort((a, b) => a - b)[k - 1] || 1e-9;
    const weights = dists.map((d) => {
      const u = Math.min(d / bandwidth, 1);
      return Math.pow(1 - Math.pow(u, 3), 3);
    });

    let sw = 0, swx = 0, swy = 0, swxy = 0, swxx = 0;
    for (let j = 0; j < n; j++) {
      const w = weights[j];
      sw += w;
      swx += w * xs[j];
      swy += w * ys[j];
      swxy += w * xs[j] * ys[j];
      swxx += w * xs[j] * xs[j];
    }
    const denom = sw * swxx - swx * swx;
    const slope = Math.abs(denom) < 1e-9 ? 0 : (sw * swxy - swx * swy) / denom;
    const intercept = (swy - slope * swx) / sw;
    return intercept + slope * xi;
  });
}

const smoothingFraction = 0.35;
const lowessFit = lowess(nitrogenRate, grainYield, smoothingFraction);
const fitOrder = d3.range(pointCount).sort((a, b) => nitrogenRate[a] - nitrogenRate[b]);
const fitCurve = fitOrder.map((i) => ({ x: nitrogenRate[i], y: lowessFit[i] }));

// --- SVG mount ----------------------------------------------------------------
const svg = d3.select("#container").append("svg").attr("width", width).attr("height", height);
const g = svg.append("g").attr("transform", `translate(${margin.left},${margin.top})`);

// --- Scales ---------------------------------------------------------------
const x = d3.scaleLinear().domain([0, 280]).nice().range([0, iw]);
const y = d3.scaleLinear().domain([0, d3.max(grainYield) * 1.08]).nice().range([ih, 0]);

// --- Gridlines (y-axis only, for a subtler chrome) ---------------------------
g.append("g")
  .call(d3.axisLeft(y).ticks(6).tickSize(-iw).tickFormat(""))
  .selectAll("line")
  .attr("stroke", t.grid);
g.selectAll(".domain").remove();

// --- Axes -------------------------------------------------------------------
const xAxis = g.append("g").attr("transform", `translate(0,${ih})`).call(d3.axisBottom(x).ticks(7));
const yAxis = g.append("g").call(d3.axisLeft(y).ticks(6));
for (const axis of [xAxis, yAxis]) {
  axis.selectAll("text").attr("fill", t.inkSoft).style("font-size", "14px");
  axis.selectAll("line").attr("stroke", t.inkSoft);
  axis.select(".domain").attr("stroke", t.inkSoft);
}

// --- Axis labels --------------------------------------------------------------
g.append("text")
  .attr("x", iw / 2).attr("y", ih + 60)
  .attr("text-anchor", "middle")
  .attr("fill", t.ink).style("font-size", "18px")
  .text("Nitrogen Applied (kg/ha)");
g.append("text")
  .attr("transform", "rotate(-90)")
  .attr("x", -ih / 2).attr("y", -70)
  .attr("text-anchor", "middle")
  .attr("fill", t.ink).style("font-size", "18px")
  .text("Grain Yield (t/ha)");

// --- Scatter points -----------------------------------------------------------
g.selectAll("circle")
  .data(d3.range(pointCount))
  .join("circle")
  .attr("cx", (i) => x(nitrogenRate[i]))
  .attr("cy", (i) => y(grainYield[i]))
  .attr("r", 6)
  .attr("fill", t.palette[0])
  .attr("fill-opacity", 0.55)
  .attr("stroke", t.pageBg)
  .attr("stroke-width", 1);

// --- LOWESS curve ---------------------------------------------------------
const line = d3.line().x((d) => x(d.x)).y((d) => y(d.y)).curve(d3.curveMonotoneX);
g.append("path")
  .datum(fitCurve)
  .attr("fill", "none")
  .attr("stroke", t.palette[1])
  .attr("stroke-width", 4)
  .attr("stroke-linecap", "round")
  .attr("d", line);

// --- Optimal-rate annotation (data storytelling focal point) ----------------
const peak = fitCurve.reduce((best, d) => (d.y > best.y ? d : best), fitCurve[0]);
g.append("line")
  .attr("x1", x(peak.x)).attr("x2", x(peak.x))
  .attr("y1", y(peak.y)).attr("y2", ih)
  .attr("stroke", t.inkSoft)
  .attr("stroke-width", 1.5)
  .attr("stroke-dasharray", "4,4");
g.append("circle")
  .attr("cx", x(peak.x)).attr("cy", y(peak.y))
  .attr("r", 7)
  .attr("fill", t.pageBg)
  .attr("stroke", t.palette[1])
  .attr("stroke-width", 2.5);
g.append("text")
  .attr("x", x(peak.x)).attr("y", y(peak.y) - 18)
  .attr("text-anchor", "middle")
  .attr("fill", t.ink).style("font-size", "14px").style("font-weight", "600")
  .text(`Optimal ≈ ${Math.round(peak.x)} kg/ha`);

// --- Legend -----------------------------------------------------------------
const legend = g.append("g").attr("transform", `translate(${iw - 330},0)`);
legend.append("circle").attr("cx", 8).attr("cy", 0).attr("r", 6)
  .attr("fill", t.palette[0]).attr("fill-opacity", 0.55).attr("stroke", t.pageBg);
legend.append("text").attr("x", 24).attr("y", 5)
  .attr("fill", t.inkSoft).style("font-size", "14px")
  .text("Field observations");
legend.append("line").attr("x1", 0).attr("x2", 16).attr("y1", 28).attr("y2", 28)
  .attr("stroke", t.palette[1]).attr("stroke-width", 4).attr("stroke-linecap", "round");
legend.append("text").attr("x", 24).attr("y", 33)
  .attr("fill", t.inkSoft).style("font-size", "14px")
  .text(`LOWESS fit (frac = ${smoothingFraction})`);

// --- Title --------------------------------------------------------------------
const titleText = "Nitrogen Fertilization Response · scatter-regression-lowess · javascript · d3 · anyplot.ai";
const titleRatio = titleText.length > 67 ? 67 / titleText.length : 1;
const titleFontSize = Math.max(14, Math.round(22 * titleRatio));
svg.append("text")
  .attr("x", width / 2).attr("y", 50)
  .attr("text-anchor", "middle")
  .attr("fill", t.ink).style("font-size", `${titleFontSize}px`).style("font-weight", "600")
  .text(titleText);
svg.append("text")
  .attr("x", width / 2).attr("y", 82)
  .attr("text-anchor", "middle")
  .attr("fill", t.inkSoft).style("font-size", "16px")
  .text("Locally weighted regression smooths a noisy, non-monotonic yield response");
Runnable source as JSON, for any HTTP client: https://api.anyplot.ai/specs/scatter-regression-lowess/d3/code. Any spec id and library id listed in llms-full.txt fit the same URL shape; every URL below is complete and callable.
{
  "spec_id": "scatter-regression-lowess",
  "language": "javascript",
  "library": "d3",
  "page": "https://anyplot.ai/scatter-regression-lowess/javascript/d3",
  "hub": "https://anyplot.ai/scatter-regression-lowess",
  "code_json": "https://api.anyplot.ai/specs/scatter-regression-lowess/d3/code",
  "spec_json": "https://api.anyplot.ai/specs/scatter-regression-lowess",
  "render_light_png": "https://storage.googleapis.com/anyplot-images/plots/scatter-regression-lowess/javascript/d3/plot-light.png",
  "render_dark_png": "https://storage.googleapis.com/anyplot-images/plots/scatter-regression-lowess/javascript/d3/plot-dark.png",
  "interactive_light_html": "https://storage.googleapis.com/anyplot-images/plots/scatter-regression-lowess/javascript/d3/plot-light.html",
  "interactive_dark_html": "https://storage.googleapis.com/anyplot-images/plots/scatter-regression-lowess/javascript/d3/plot-dark.html",
  "quality_score": 85.0,
  "license": "MIT",
  "guide": "https://anyplot.ai/llms.txt"
}
Part of Scatter Plot with LOWESS Regression on anyplot.ai.