The same plot in 14 other libraries — JavaScript: Chart.js, D3.js, Apache ECharts, Highcharts; Python: Altair, Bokeh, lets-plot, Matplotlib, Plotly, plotnine, Pygal, Seaborn; R: ggplot2; Julia: Makie.jl. Compare all 15 side by side: Scatter Plot with LOWESS Regression in Python, R, Julia and JavaScript.
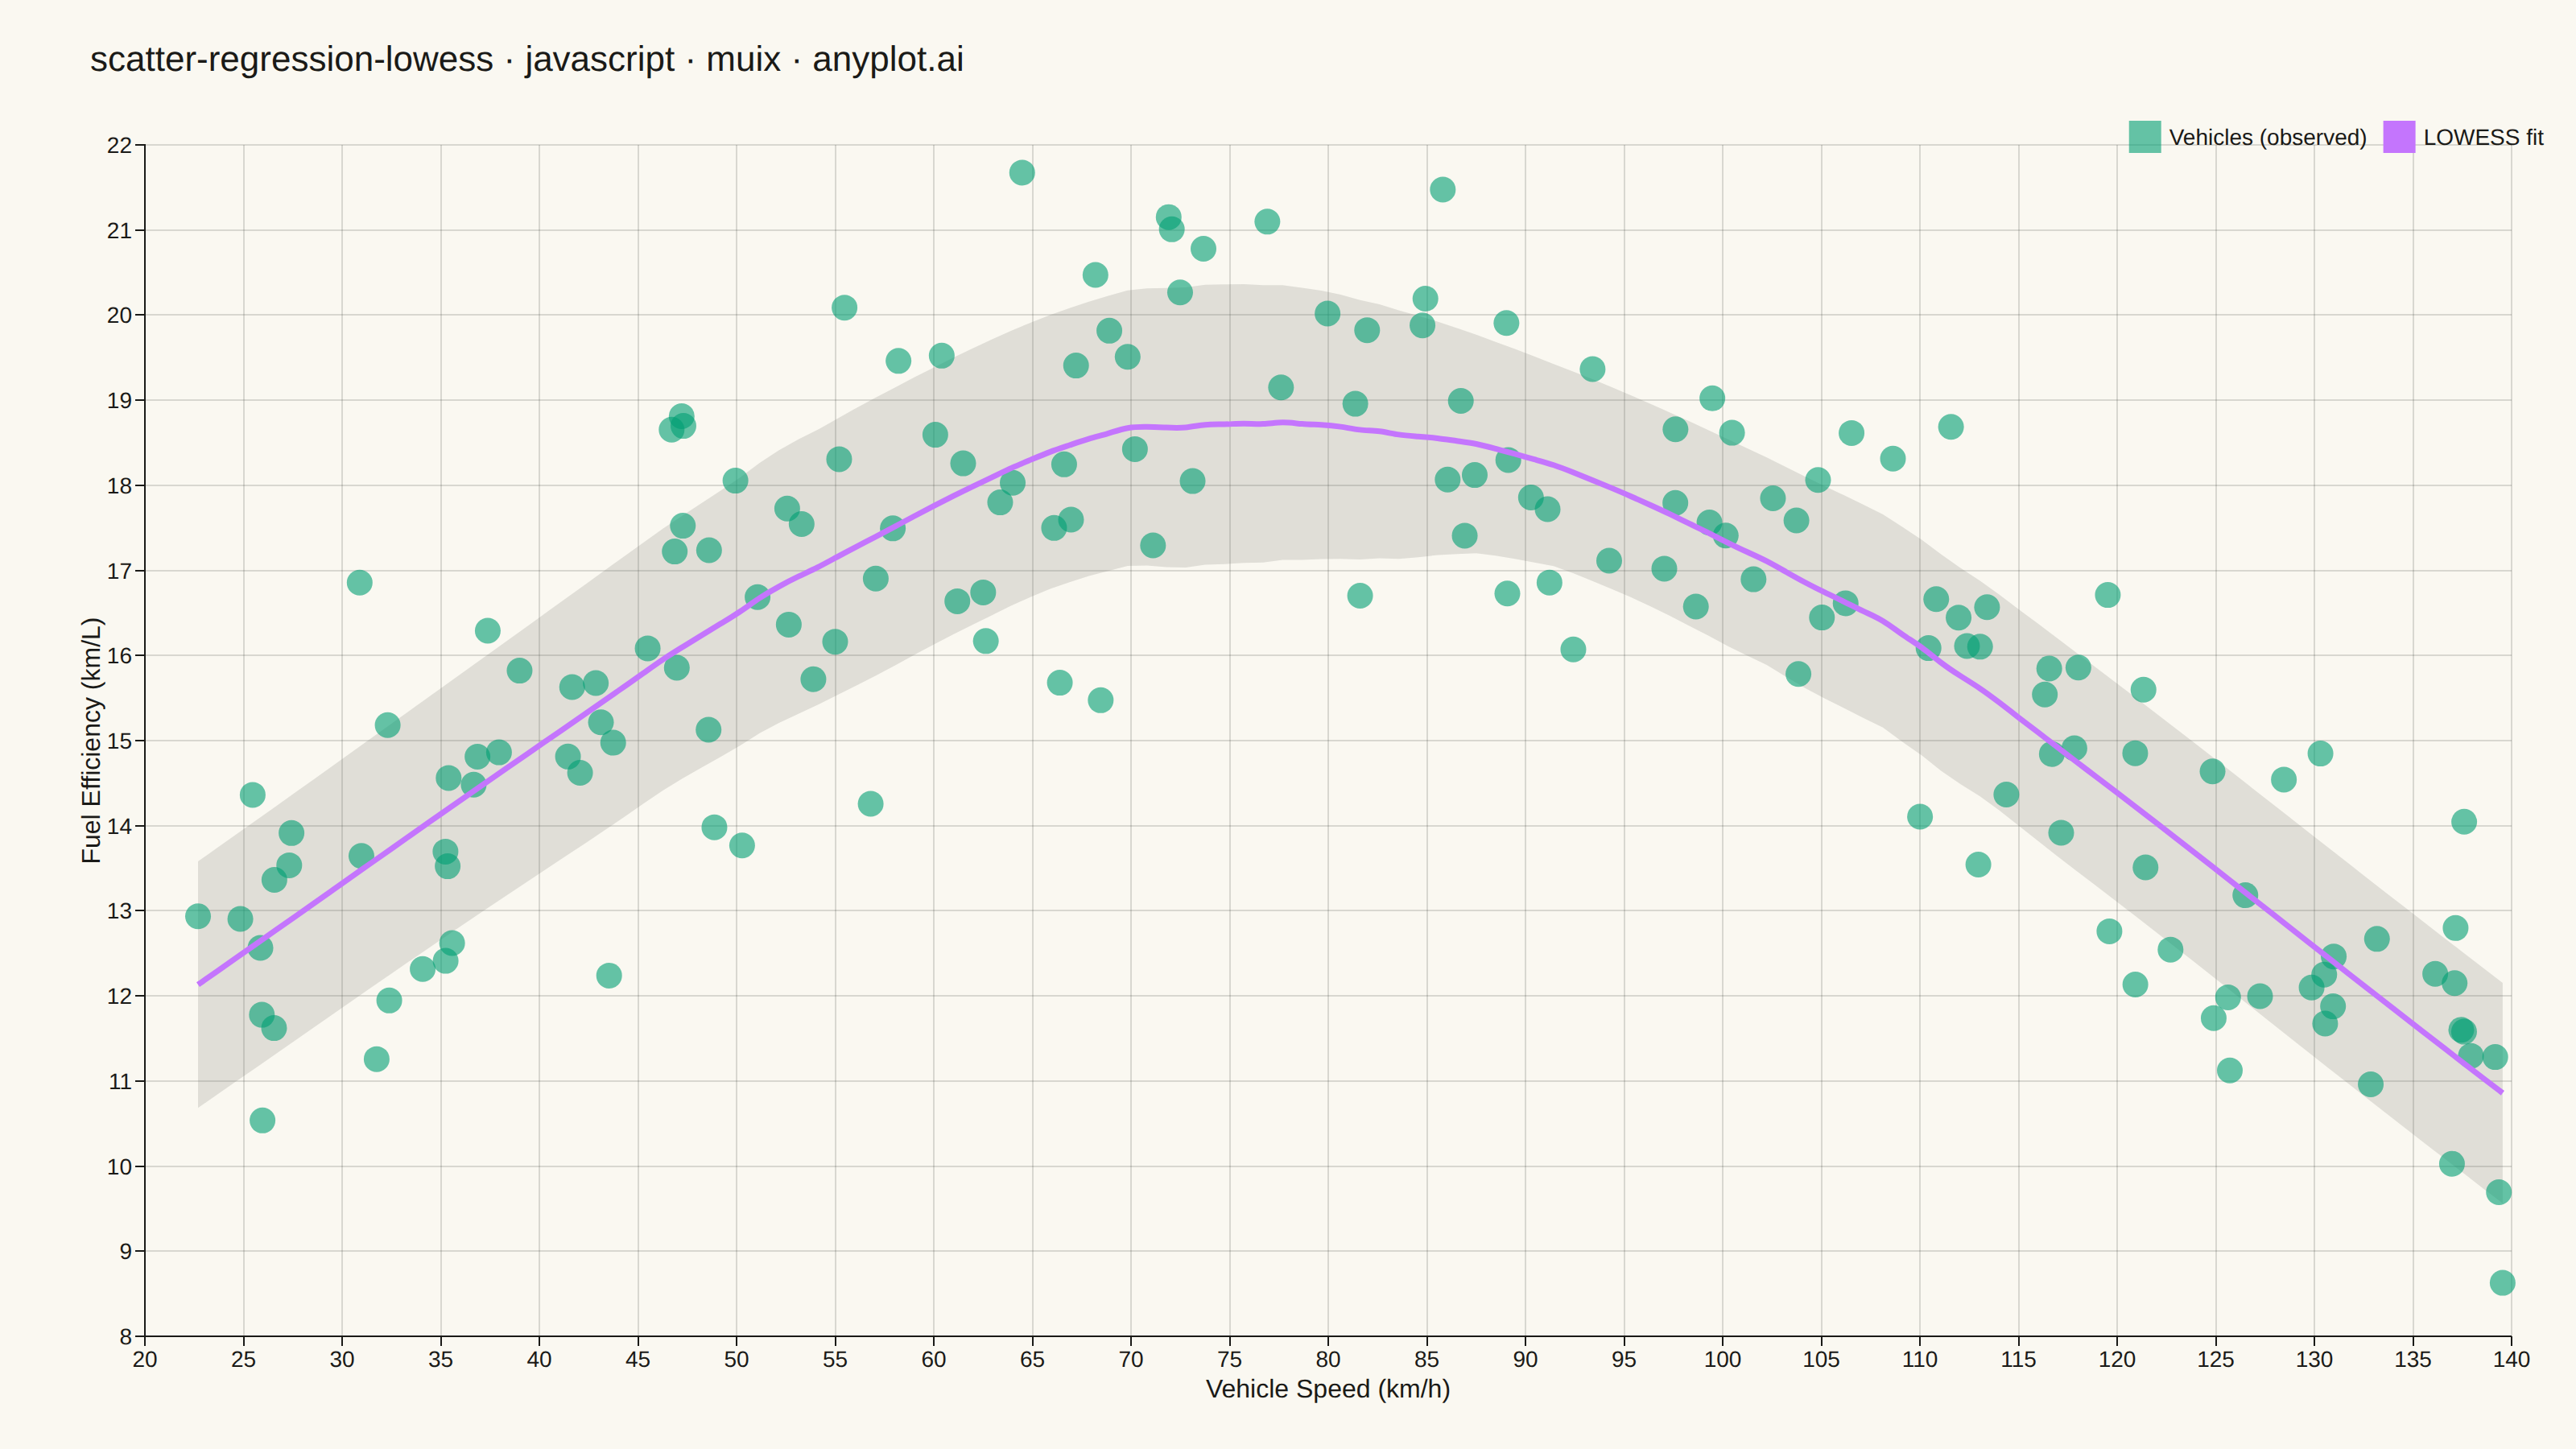
A scatter plot with a LOWESS (Locally Weighted Scatterplot Smoothing) regression curve overlaid. LOWESS is a non-parametric method that fits smooth curves by performing local weighted regressions at each point, adapting to local data patterns without assuming a specific functional form. This makes it ideal for exploring complex relationships where the underlying pattern is unknown or varies across the data range.
// anyplot.ai
// scatter-regression-lowess: Scatter Plot with LOWESS Regression
// Library: muix 7.29.1 | JavaScript 22.23.2
// Quality: 88/100 | Created: 2026-09-09
import { ChartContainer } from "@mui/x-charts/ChartContainer";
import { ScatterPlot } from "@mui/x-charts/ScatterChart";
import { LinePlot } from "@mui/x-charts/LineChart";
import { ChartsXAxis } from "@mui/x-charts/ChartsXAxis";
import { ChartsYAxis } from "@mui/x-charts/ChartsYAxis";
import { ChartsGrid } from "@mui/x-charts/ChartsGrid";
import { ChartsLegend } from "@mui/x-charts/ChartsLegend";
import { ChartsTooltip } from "@mui/x-charts/ChartsTooltip";
import { useXScale, useYScale } from "@mui/x-charts/hooks";
import Box from "@mui/material/Box";
import Typography from "@mui/material/Typography";

const t = window.ANYPLOT_TOKENS;

// --- Data (in-memory, deterministic) ---------------------------------------
// Tiny fixed-seed LCG — the browser has no seeded RNG.
function makeLcg(seed: number) {
  let state = seed >>> 0;
  return function next() {
    state = (Math.imul(state, 1664525) + 1013904223) >>> 0;
    return state / 4294967296;
  };
}

function randNormal(rng: () => number) {
  const u1 = Math.max(rng(), 1e-9);
  const u2 = rng();
  return Math.sqrt(-2 * Math.log(u1)) * Math.cos(2 * Math.PI * u2);
}

function hexToRgba(hex: string, alpha: number) {
  const value = parseInt(hex.slice(1), 16);
  const r = (value >> 16) & 255;
  const g = (value >> 8) & 255;
  const b = value & 255;
  return `rgba(${r}, ${g}, ${b}, ${alpha})`;
}

const rng = makeLcg(42);
const SAMPLE_SIZE = 170;

// Fuel efficiency peaks at a moderate cruising speed and drops off at both
// low speed (frequent idling/acceleration) and high speed (aerodynamic drag)
// — a non-monotonic pattern LOWESS traces without assuming a parametric form.
const vehicleSpeed: number[] = [];
const fuelEfficiency: number[] = [];
for (let i = 0; i < SAMPLE_SIZE; i += 1) {
  const speed = 20 + rng() * 120;
  const trend = 18.5 - 0.0021 * (speed - 78) ** 2;
  const value = Math.max(3, trend + randNormal(rng) * 1.6);
  vehicleSpeed.push(speed);
  fuelEfficiency.push(value);
}

// --- LOWESS (locally weighted scatterplot smoothing) ------------------------
function tricube(distance: number, bandwidth: number) {
  if (bandwidth <= 0) return distance === 0 ? 1 : 0;
  const u = Math.min(Math.abs(distance) / bandwidth, 1);
  return (1 - u ** 3) ** 3;
}

function lowess(xs: number[], ys: number[], frac: number, gridSize: number) {
  const n = xs.length;
  const windowSize = Math.max(2, Math.round(frac * n));
  const xMin = Math.min(...xs);
  const xMax = Math.max(...xs);
  const grid = Array.from({ length: gridSize }, (_, i) => xMin + ((xMax - xMin) * i) / (gridSize - 1));

  return grid.map((x0) => {
    const distances = xs.map((xi) => Math.abs(xi - x0));
    const bandwidth = [...distances].sort((a, b) => a - b)[windowSize - 1];
    const weights = distances.map((d) => tricube(d, bandwidth));

    // Locally weighted linear regression via weighted normal equations.
    let sw = 0;
    let swx = 0;
    let swy = 0;
    let swxx = 0;
    let swxy = 0;
    for (let i = 0; i < n; i += 1) {
      const w = weights[i];
      sw += w;
      swx += w * xs[i];
      swy += w * ys[i];
      swxx += w * xs[i] * xs[i];
      swxy += w * xs[i] * ys[i];
    }
    const denom = sw * swxx - swx * swx;
    const slope = denom !== 0 ? (sw * swxy - swx * swy) / denom : 0;
    const intercept = sw !== 0 ? (swy - slope * swx) / sw : 0;

    // Local residual spread — the weighted RMS deviation of the raw points
    // from this window's line, reused as a ±1 SD confidence band around the fit.
    let swResidSq = 0;
    for (let i = 0; i < n; i += 1) {
      const resid = ys[i] - (intercept + slope * xs[i]);
      swResidSq += weights[i] * resid * resid;
    }
    const band = sw !== 0 ? Math.sqrt(swResidSq / sw) : 0;

    return { x: x0, y: intercept + slope * x0, band };
  });
}

const smoothed = lowess(vehicleSpeed, fuelEfficiency, 0.4, 120);
const smoothedX = smoothed.map((point) => point.x);
const smoothedY = smoothed.map((point) => point.y);
const smoothedUpper = smoothed.map((point) => point.y + point.band);
const smoothedLower = smoothed.map((point) => point.y - point.band);

const scatterData = vehicleSpeed.map((speed, i) => ({
  x: speed,
  y: fuelEfficiency[i],
  id: i,
}));

// A shaded ±1 SD band behind the fit line, drawn from the chart's own scales
// (community `useXScale`/`useYScale` hooks) rather than as a legend series —
// it should read as context for the fit, not compete with it for attention.
function ConfidenceBand({ x, upper, lower, fill }: { x: number[]; upper: number[]; lower: number[]; fill: string }) {
  const xScale = useXScale("speed");
  const yScale = useYScale();
  const topEdge = x.map((xi, i) => `${i === 0 ? "M" : "L"}${xScale(xi)},${yScale(upper[i])}`);
  const bottomEdge = [...x]
    .map((xi, i) => ({ xi, y: lower[i] }))
    .reverse()
    .map((point) => `L${xScale(point.xi)},${yScale(point.y)}`);
  return <path d={`${topEdge.join(" ")} ${bottomEdge.join(" ")} Z`} fill={fill} stroke="none" />;
}

// --- Chart (default-exported component — the harness mounts it) -------------
export default function Chart() {
  const W = window.ANYPLOT_SIZE.width;
  const H = window.ANYPLOT_SIZE.height;
  const CHART_TOP = 60;

  const title = "scatter-regression-lowess · javascript · muix · anyplot.ai";
  const titleSize = title.length > 67 ? Math.round((22 * 67) / title.length) : 22;

  // "muted" semantic anchor (adaptive, outside the categorical pool) — used at
  // low alpha for the confidence-band fill so it sits behind the data.
  const mutedHex = t.theme === "dark" ? "#A8A79F" : "#6B6A63";
  const bandFill = hexToRgba(mutedHex, 0.18);

  return (
    <Box sx={{ position: "relative", width: W, height: H, bgcolor: t.pageBg }}>
      <Box sx={{ position: "absolute", top: 20, left: 56, right: 56 }}>
        <Typography sx={{ color: t.ink, fontSize: titleSize, fontWeight: 500 }}>{title}</Typography>
      </Box>
      <Box sx={{ position: "absolute", top: CHART_TOP, left: 0, right: 0, bottom: 0 }}>
        <ChartContainer
          width={W}
          height={H - CHART_TOP}
          skipAnimation
          margin={{ top: 30, right: 40, bottom: 70, left: 90 }}
          series={[
            {
              type: "scatter",
              data: scatterData,
              color: hexToRgba(t.palette[0], 0.6),
              markerSize: 8,
              label: "Vehicles (observed)",
            },
            {
              type: "line",
              data: smoothedY,
              xAxisId: "speed",
              color: t.palette[1],
              curve: "natural",
              showMark: false,
              label: "LOWESS fit",
            },
          ]}
          xAxis={[
            {
              id: "speed",
              data: smoothedX,
              scaleType: "linear",
              label: "Vehicle Speed (km/h)",
              labelStyle: { fontSize: 16 },
              tickLabelStyle: { fontSize: 14 },
              valueFormatter: (value: number) => value.toFixed(0),
            },
          ]}
          yAxis={[
            {
              label: "Fuel Efficiency (km/L)",
              labelStyle: { fontSize: 16 },
              tickLabelStyle: { fontSize: 14 },
            },
          ]}
          sx={{
            "& .MuiLineElement-root": { strokeWidth: 3.5 },
          }}
        >
          <ChartsGrid horizontal vertical />
          <ConfidenceBand x={smoothedX} upper={smoothedUpper} lower={smoothedLower} fill={bandFill} />
          <ScatterPlot />
          <LinePlot />
          <ChartsXAxis />
          <ChartsYAxis />
          <ChartsLegend direction="row" position={{ horizontal: "right", vertical: "top" }} slotProps={{ legend: { labelStyle: { fontSize: 14 } } }} />
          <ChartsTooltip trigger="item" />
        </ChartContainer>
      </Box>
    </Box>
  );
}
Runnable source as JSON, for any HTTP client: https://api.anyplot.ai/specs/scatter-regression-lowess/muix/code. Any spec id and library id listed in llms-full.txt fit the same URL shape; every URL below is complete and callable.
{
  "spec_id": "scatter-regression-lowess",
  "language": "javascript",
  "library": "muix",
  "page": "https://anyplot.ai/scatter-regression-lowess/javascript/muix",
  "hub": "https://anyplot.ai/scatter-regression-lowess",
  "code_json": "https://api.anyplot.ai/specs/scatter-regression-lowess/muix/code",
  "spec_json": "https://api.anyplot.ai/specs/scatter-regression-lowess",
  "render_light_png": "https://storage.googleapis.com/anyplot-images/plots/scatter-regression-lowess/javascript/muix/plot-light.png",
  "render_dark_png": "https://storage.googleapis.com/anyplot-images/plots/scatter-regression-lowess/javascript/muix/plot-dark.png",
  "interactive_light_html": "https://storage.googleapis.com/anyplot-images/plots/scatter-regression-lowess/javascript/muix/plot-light.html",
  "interactive_dark_html": "https://storage.googleapis.com/anyplot-images/plots/scatter-regression-lowess/javascript/muix/plot-dark.html",
  "quality_score": 88.0,
  "license": "MIT",
  "guide": "https://anyplot.ai/llms.txt"
}
Part of Scatter Plot with LOWESS Regression on anyplot.ai.