The same plot in 14 other libraries — JavaScript: Chart.js, D3.js, Highcharts, MUI X Charts; Python: Altair, Bokeh, lets-plot, Matplotlib, Plotly, plotnine, Pygal, Seaborn; R: ggplot2; Julia: Makie.jl. Compare all 15 side by side: Scatter Plot with LOWESS Regression in Python, R, Julia and JavaScript.
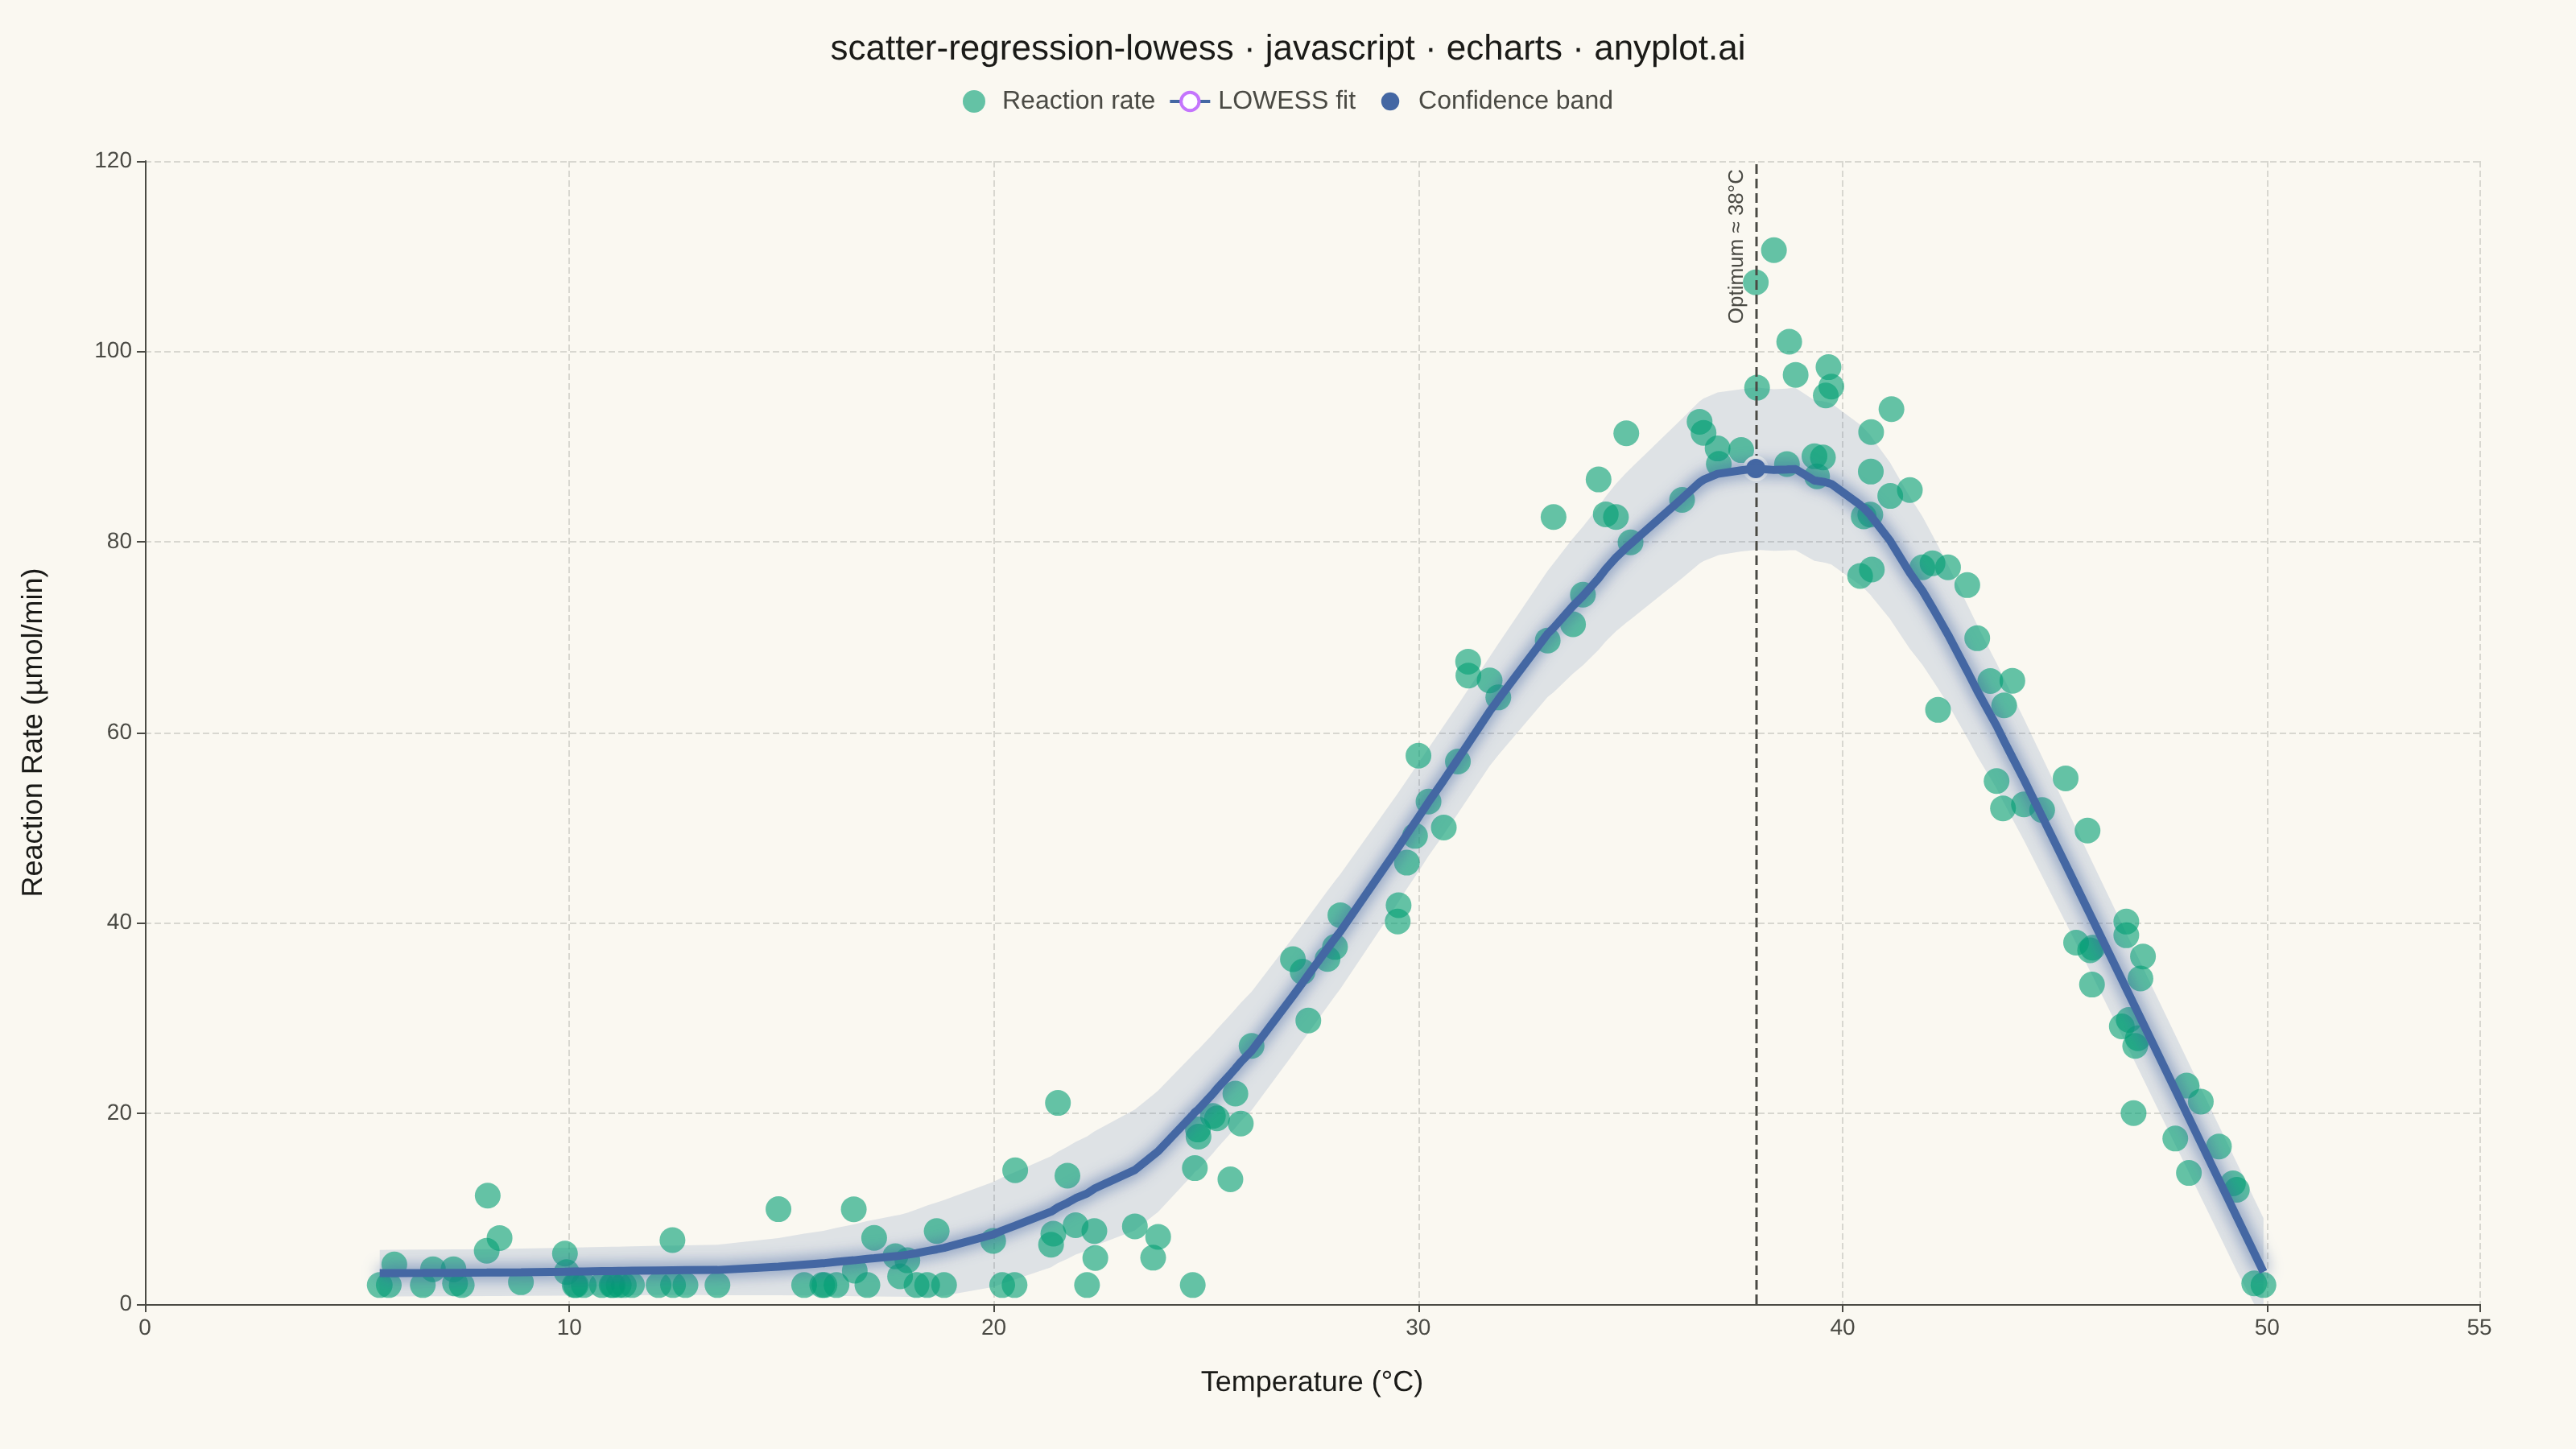
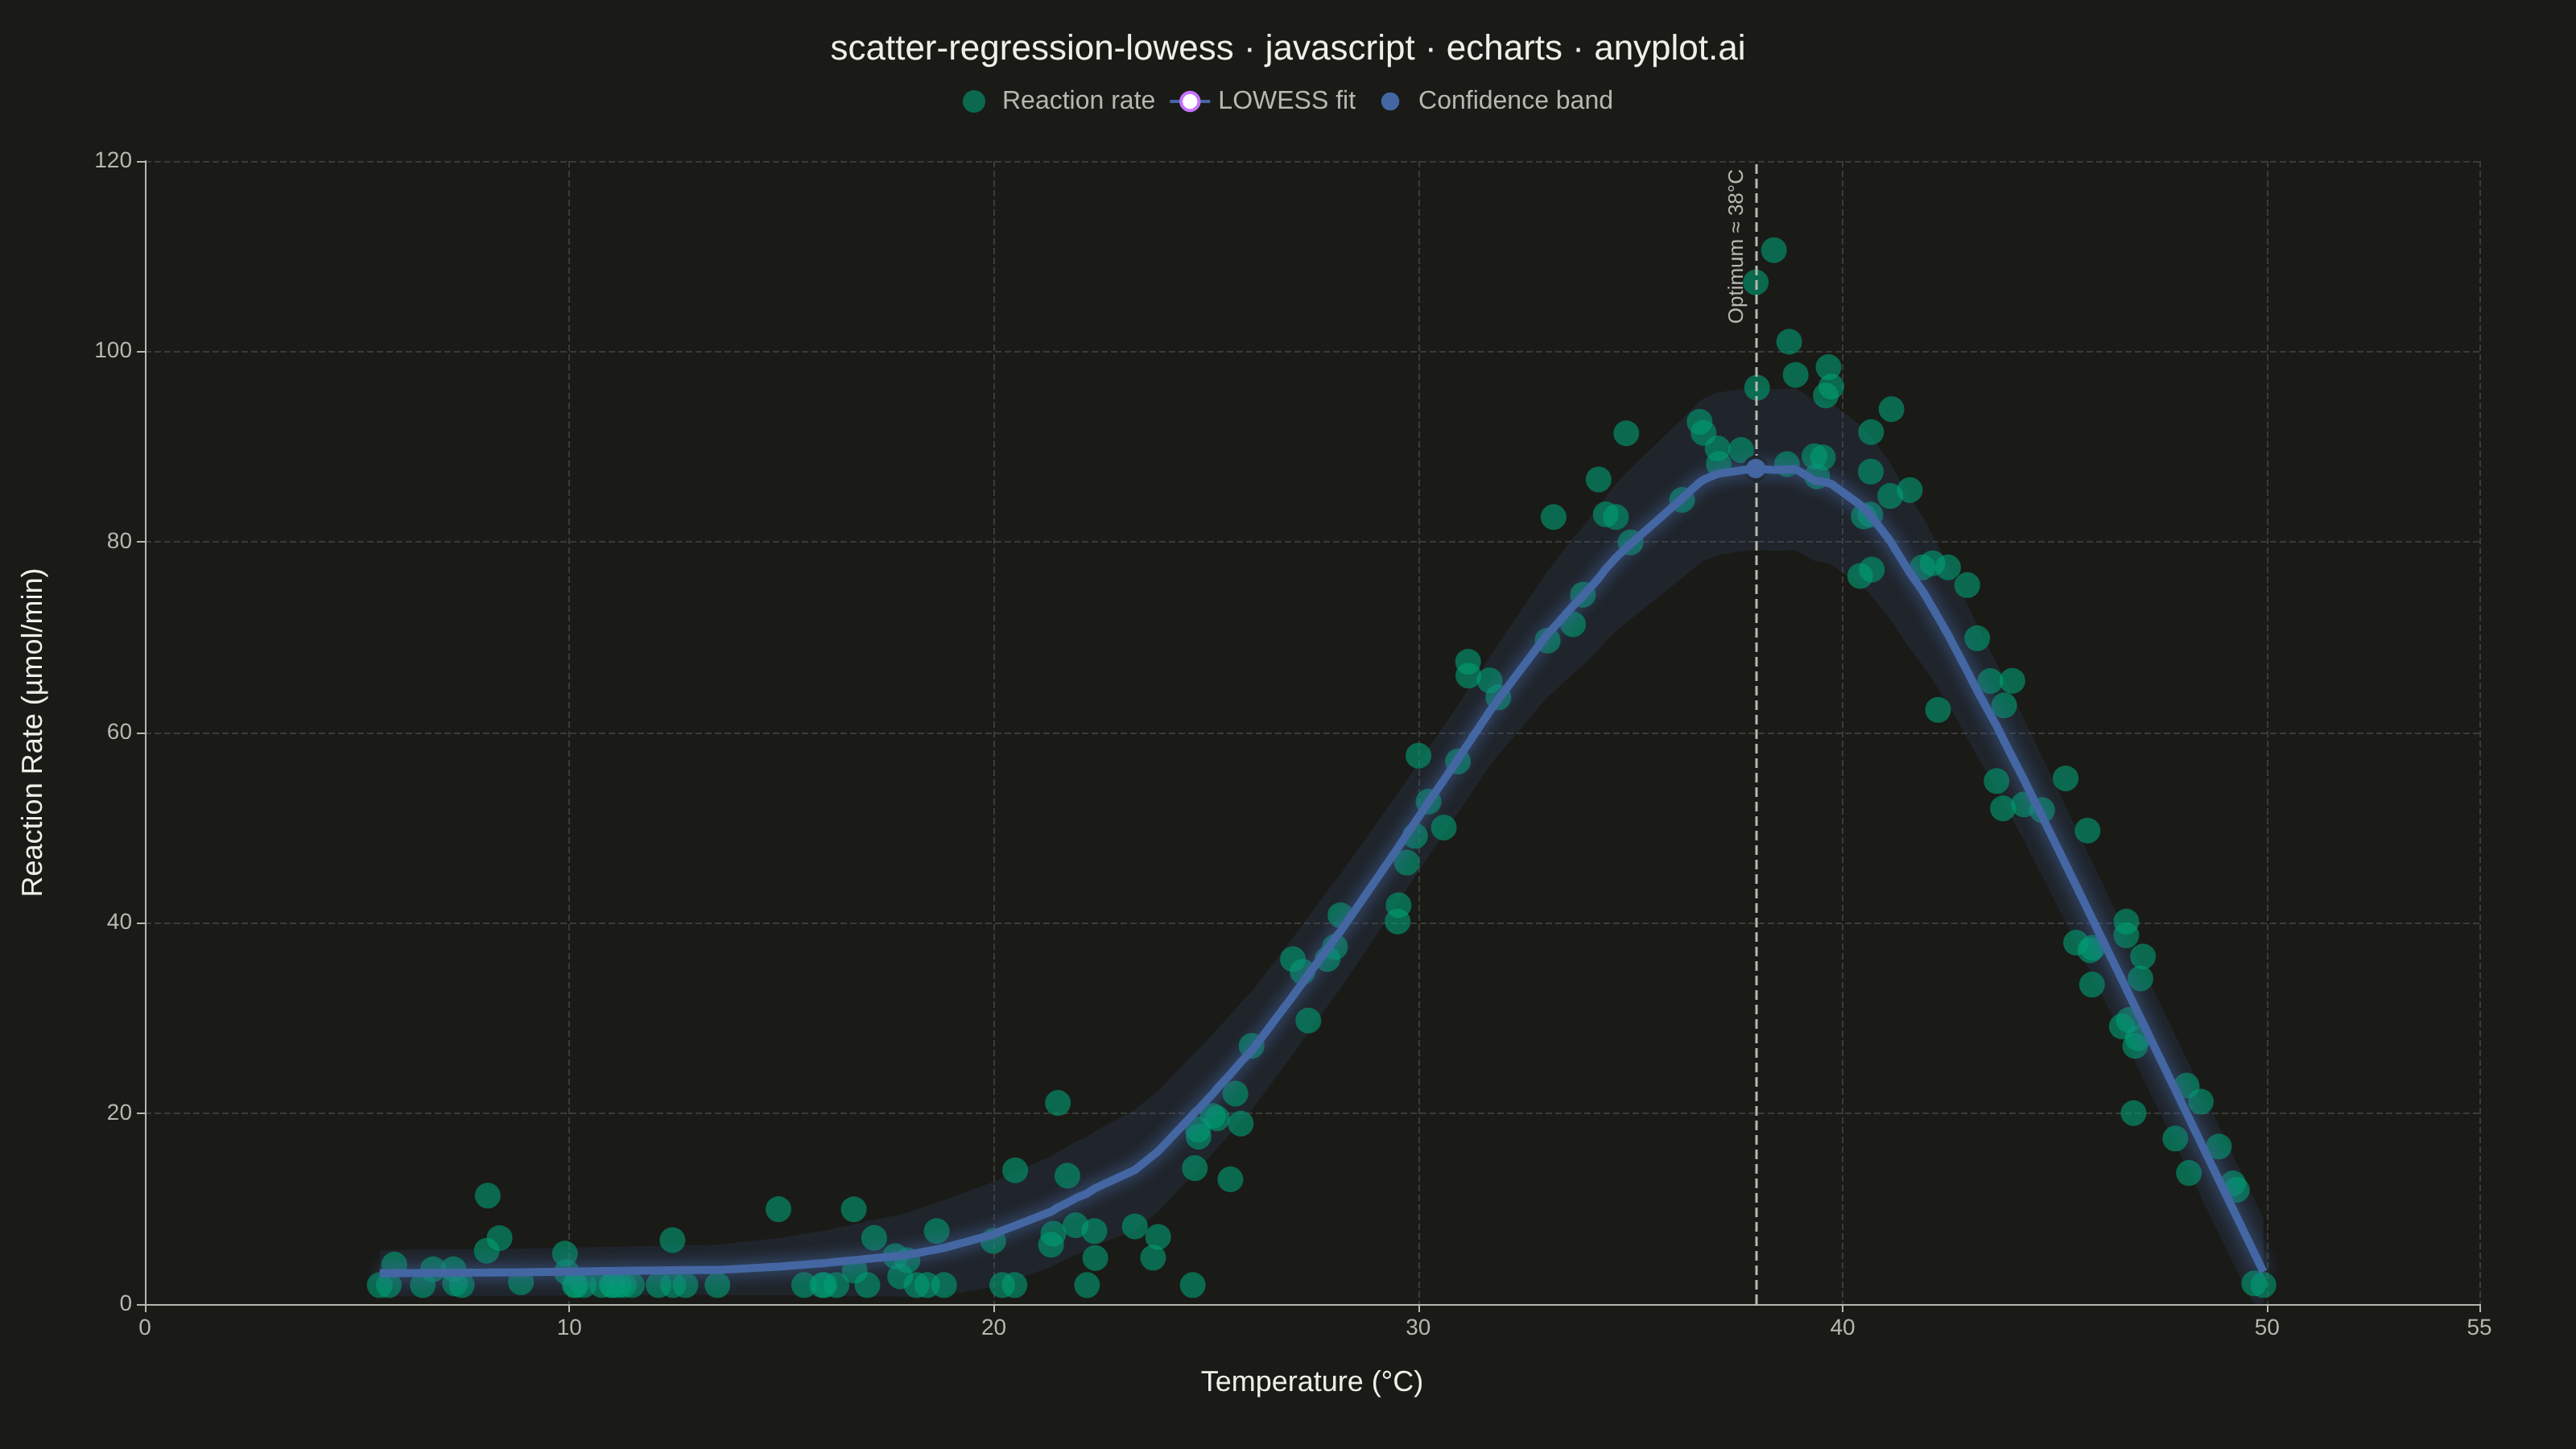
A scatter plot with a LOWESS (Locally Weighted Scatterplot Smoothing) regression curve overlaid. LOWESS is a non-parametric method that fits smooth curves by performing local weighted regressions at each point, adapting to local data patterns without assuming a specific functional form. This makes it ideal for exploring complex relationships where the underlying pattern is unknown or varies across the data range.
// anyplot.ai
// scatter-regression-lowess: Scatter Plot with LOWESS Regression
// Library: echarts 6.1.0 | JavaScript 22.23.2
// Quality: 89/100 | Created: 2026-09-09

const t = window.ANYPLOT_TOKENS;

// --- Data (in-memory, deterministic) ----------------------------------------
// Enzyme reaction rate vs. temperature: rate climbs as the enzyme warms toward
// its optimum, then collapses past ~38 C as the protein denatures — a
// non-monotonic curve no single polynomial captures cleanly, which is exactly
// what LOWESS is good at tracing.
let seed = 20260909;
function rand() {
  // Small fixed-seed LCG — Math.random() is not reproducible across runs.
  seed = (seed * 1103515245 + 12345) & 0x7fffffff;
  return seed / 0x7fffffff;
}
function randNormal() {
  const u1 = Math.max(rand(), 1e-9);
  const u2 = rand();
  return Math.sqrt(-2 * Math.log(u1)) * Math.cos(2 * Math.PI * u2);
}

const n = 160;
const optimum = 38;
const width = 7;
const peak = 95;
const temperatures = [];
const reactionRates = [];
for (let i = 0; i < n; i++) {
  const temp = 5 + rand() * 45;
  const gaussian = peak * Math.exp(-((temp - optimum) ** 2) / (2 * width * width));
  const denatureDrop = temp > optimum ? (temp - optimum) * 1.4 : 0;
  const rate = Math.max(2, gaussian - denatureDrop + randNormal() * 6);
  temperatures.push(temp);
  reactionRates.push(rate);
}

// --- LOWESS (locally weighted linear regression, single pass) --------------
const order = temperatures
  .map((temp, i) => i)
  .sort((a, b) => temperatures[a] - temperatures[b]);
const xSorted = order.map((i) => temperatures[i]);
const ySorted = order.map((i) => reactionRates[i]);

const frac = 0.35;
const windowSize = Math.max(4, Math.round(frac * n));

function tricube(u) {
  return u < 1 ? (1 - u ** 3) ** 3 : 0;
}

// Tricube weights for the local window around xSorted[i], reused for both the
// regression fit and the local-variance confidence band below.
function weightsAt(i) {
  const x0 = xSorted[i];
  const distances = xSorted.map((xj) => Math.abs(xj - x0));
  const bandwidth = [...distances].sort((a, b) => a - b)[windowSize - 1] || 1e-6;
  return distances.map((d) => tricube(d / bandwidth));
}

const lowessCurve = xSorted.map((x0, i) => {
  const w = weightsAt(i);
  let s0 = 0, s1 = 0, s2 = 0, sy = 0, sxy = 0;
  for (let j = 0; j < n; j++) {
    if (w[j] <= 0) continue;
    const xj = xSorted[j], yj = ySorted[j];
    s0 += w[j];
    s1 += w[j] * xj;
    s2 += w[j] * xj * xj;
    sy += w[j] * yj;
    sxy += w[j] * xj * yj;
  }
  const denom = s0 * s2 - s1 * s1;
  const slope = denom !== 0 ? (s0 * sxy - s1 * sy) / denom : 0;
  const intercept = (sy - slope * s1) / s0;
  return [x0, intercept + slope * x0];
});

// Local confidence band: weighted RMS of the fit residuals within the same
// window used for the regression, clamped at 0 (reaction rate can't go negative).
const residuals = ySorted.map((y, i) => y - lowessCurve[i][1]);
const localStd = xSorted.map((_, i) => {
  const w = weightsAt(i);
  let sw = 0, swr2 = 0;
  for (let j = 0; j < n; j++) {
    if (w[j] <= 0) continue;
    sw += w[j];
    swr2 += w[j] * residuals[j] * residuals[j];
  }
  return Math.sqrt(swr2 / sw);
});
const bandLower = lowessCurve.map((p, i) => Math.max(0, p[1] - localStd[i]));
const bandUpper = lowessCurve.map((p, i) => p[1] + localStd[i]);

let peakIdx = 0;
for (let i = 1; i < lowessCurve.length; i++) {
  if (lowessCurve[i][1] > lowessCurve[peakIdx][1]) peakIdx = i;
}
const peakTemp = lowessCurve[peakIdx][0];
const peakRate = lowessCurve[peakIdx][1];

// --- Init ---------------------------------------------------------------
const chart = echarts.init(document.getElementById("container"));

// --- Option ---------------------------------------------------------------
const title = "scatter-regression-lowess · javascript · echarts · anyplot.ai";
const titleFontSize = title.length > 67 ? Math.max(16, Math.round(22 * (67 / title.length))) : 22;

chart.setOption({
  animation: false,
  color: t.palette,
  backgroundColor: "transparent",
  title: {
    text: title,
    left: "center",
    textStyle: { color: t.ink, fontSize: titleFontSize, fontWeight: 500 },
  },
  grid: { left: 90, right: 60, top: 100, bottom: 90 },
  legend: {
    data: ["Reaction rate", "LOWESS fit", "Confidence band"],
    top: 50,
    textStyle: { color: t.inkSoft, fontSize: 16 },
  },
  tooltip: {
    trigger: "item",
    backgroundColor: t.elevatedBg,
    borderColor: t.grid,
    textStyle: { color: t.ink },
    formatter: (params) => {
      if (params.seriesName === "Reaction rate" || params.seriesName === "LOWESS fit") {
        const label = params.seriesName === "LOWESS fit" ? "LOWESS fit<br/>" : "";
        return `${label}Temp: ${params.value[0].toFixed(1)}°C<br/>Rate: ${params.value[1].toFixed(1)} µmol/min`;
      }
      return "";
    },
  },
  xAxis: {
    type: "value",
    name: "Temperature (°C)",
    nameLocation: "middle",
    nameGap: 40,
    nameTextStyle: { color: t.ink, fontSize: 18 },
    min: 0,
    max: 55,
    axisLabel: { color: t.inkSoft, fontSize: 14 },
    axisLine: { lineStyle: { color: t.inkSoft } },
    axisTick: { lineStyle: { color: t.inkSoft } },
    splitLine: { lineStyle: { color: t.grid, type: "dashed" } },
  },
  yAxis: {
    type: "value",
    name: "Reaction Rate (µmol/min)",
    nameLocation: "middle",
    nameGap: 60,
    nameTextStyle: { color: t.ink, fontSize: 18 },
    axisLabel: { color: t.inkSoft, fontSize: 14 },
    axisLine: { lineStyle: { color: t.inkSoft } },
    axisTick: { lineStyle: { color: t.inkSoft } },
    splitLine: { lineStyle: { color: t.grid, type: "dashed" } },
  },
  series: [
    {
      // Invisible stacking base for the confidence band below; kept out of
      // the legend and out of interaction.
      type: "line",
      data: xSorted.map((x, i) => [x, bandLower[i]]),
      stack: "confidence",
      symbol: "none",
      lineStyle: { opacity: 0 },
      areaStyle: { opacity: 0 },
      silent: true,
      tooltip: { show: false },
      z: 1,
    },
    {
      name: "Confidence band",
      type: "line",
      data: xSorted.map((x, i) => [x, bandUpper[i] - bandLower[i]]),
      stack: "confidence",
      symbol: "none",
      lineStyle: { opacity: 0 },
      areaStyle: { color: t.palette[2], opacity: 0.15 },
      itemStyle: { color: t.palette[2] },
      silent: true,
      tooltip: { show: false },
      z: 1,
    },
    {
      name: "Reaction rate",
      type: "scatter",
      data: temperatures.map((temp, i) => [temp, reactionRates[i]]),
      symbolSize: 16,
      itemStyle: { color: t.palette[0], opacity: 0.6 },
      z: 2,
    },
    {
      name: "LOWESS fit",
      type: "line",
      data: lowessCurve,
      showSymbol: false,
      smooth: false,
      lineStyle: {
        color: t.palette[2],
        width: 5,
        shadowColor: t.palette[2],
        shadowBlur: 10,
      },
      z: 10,
      markLine: {
        silent: true,
        symbol: "none",
        lineStyle: { color: t.inkSoft, type: "dashed", width: 1.5 },
        label: {
          color: t.inkSoft,
          fontSize: 13,
          formatter: () => `Optimum ≈ ${peakTemp.toFixed(0)}°C`,
          position: "insideEndTop",
        },
        data: [{ xAxis: peakTemp }],
      },
      markPoint: {
        symbol: "circle",
        symbolSize: 14,
        itemStyle: { color: t.palette[2], borderColor: t.pageBg, borderWidth: 2 },
        label: { show: false },
        data: [{ coord: [peakTemp, peakRate] }],
      },
    },
  ],
});
Runnable source as JSON, for any HTTP client: https://api.anyplot.ai/specs/scatter-regression-lowess/echarts/code. Any spec id and library id listed in llms-full.txt fit the same URL shape; every URL below is complete and callable.
{
  "spec_id": "scatter-regression-lowess",
  "language": "javascript",
  "library": "echarts",
  "page": "https://anyplot.ai/scatter-regression-lowess/javascript/echarts",
  "hub": "https://anyplot.ai/scatter-regression-lowess",
  "code_json": "https://api.anyplot.ai/specs/scatter-regression-lowess/echarts/code",
  "spec_json": "https://api.anyplot.ai/specs/scatter-regression-lowess",
  "render_light_png": "https://storage.googleapis.com/anyplot-images/plots/scatter-regression-lowess/javascript/echarts/plot-light.png",
  "render_dark_png": "https://storage.googleapis.com/anyplot-images/plots/scatter-regression-lowess/javascript/echarts/plot-dark.png",
  "interactive_light_html": "https://storage.googleapis.com/anyplot-images/plots/scatter-regression-lowess/javascript/echarts/plot-light.html",
  "interactive_dark_html": "https://storage.googleapis.com/anyplot-images/plots/scatter-regression-lowess/javascript/echarts/plot-dark.html",
  "quality_score": 89.0,
  "license": "MIT",
  "guide": "https://anyplot.ai/llms.txt"
}
Part of Scatter Plot with LOWESS Regression on anyplot.ai.