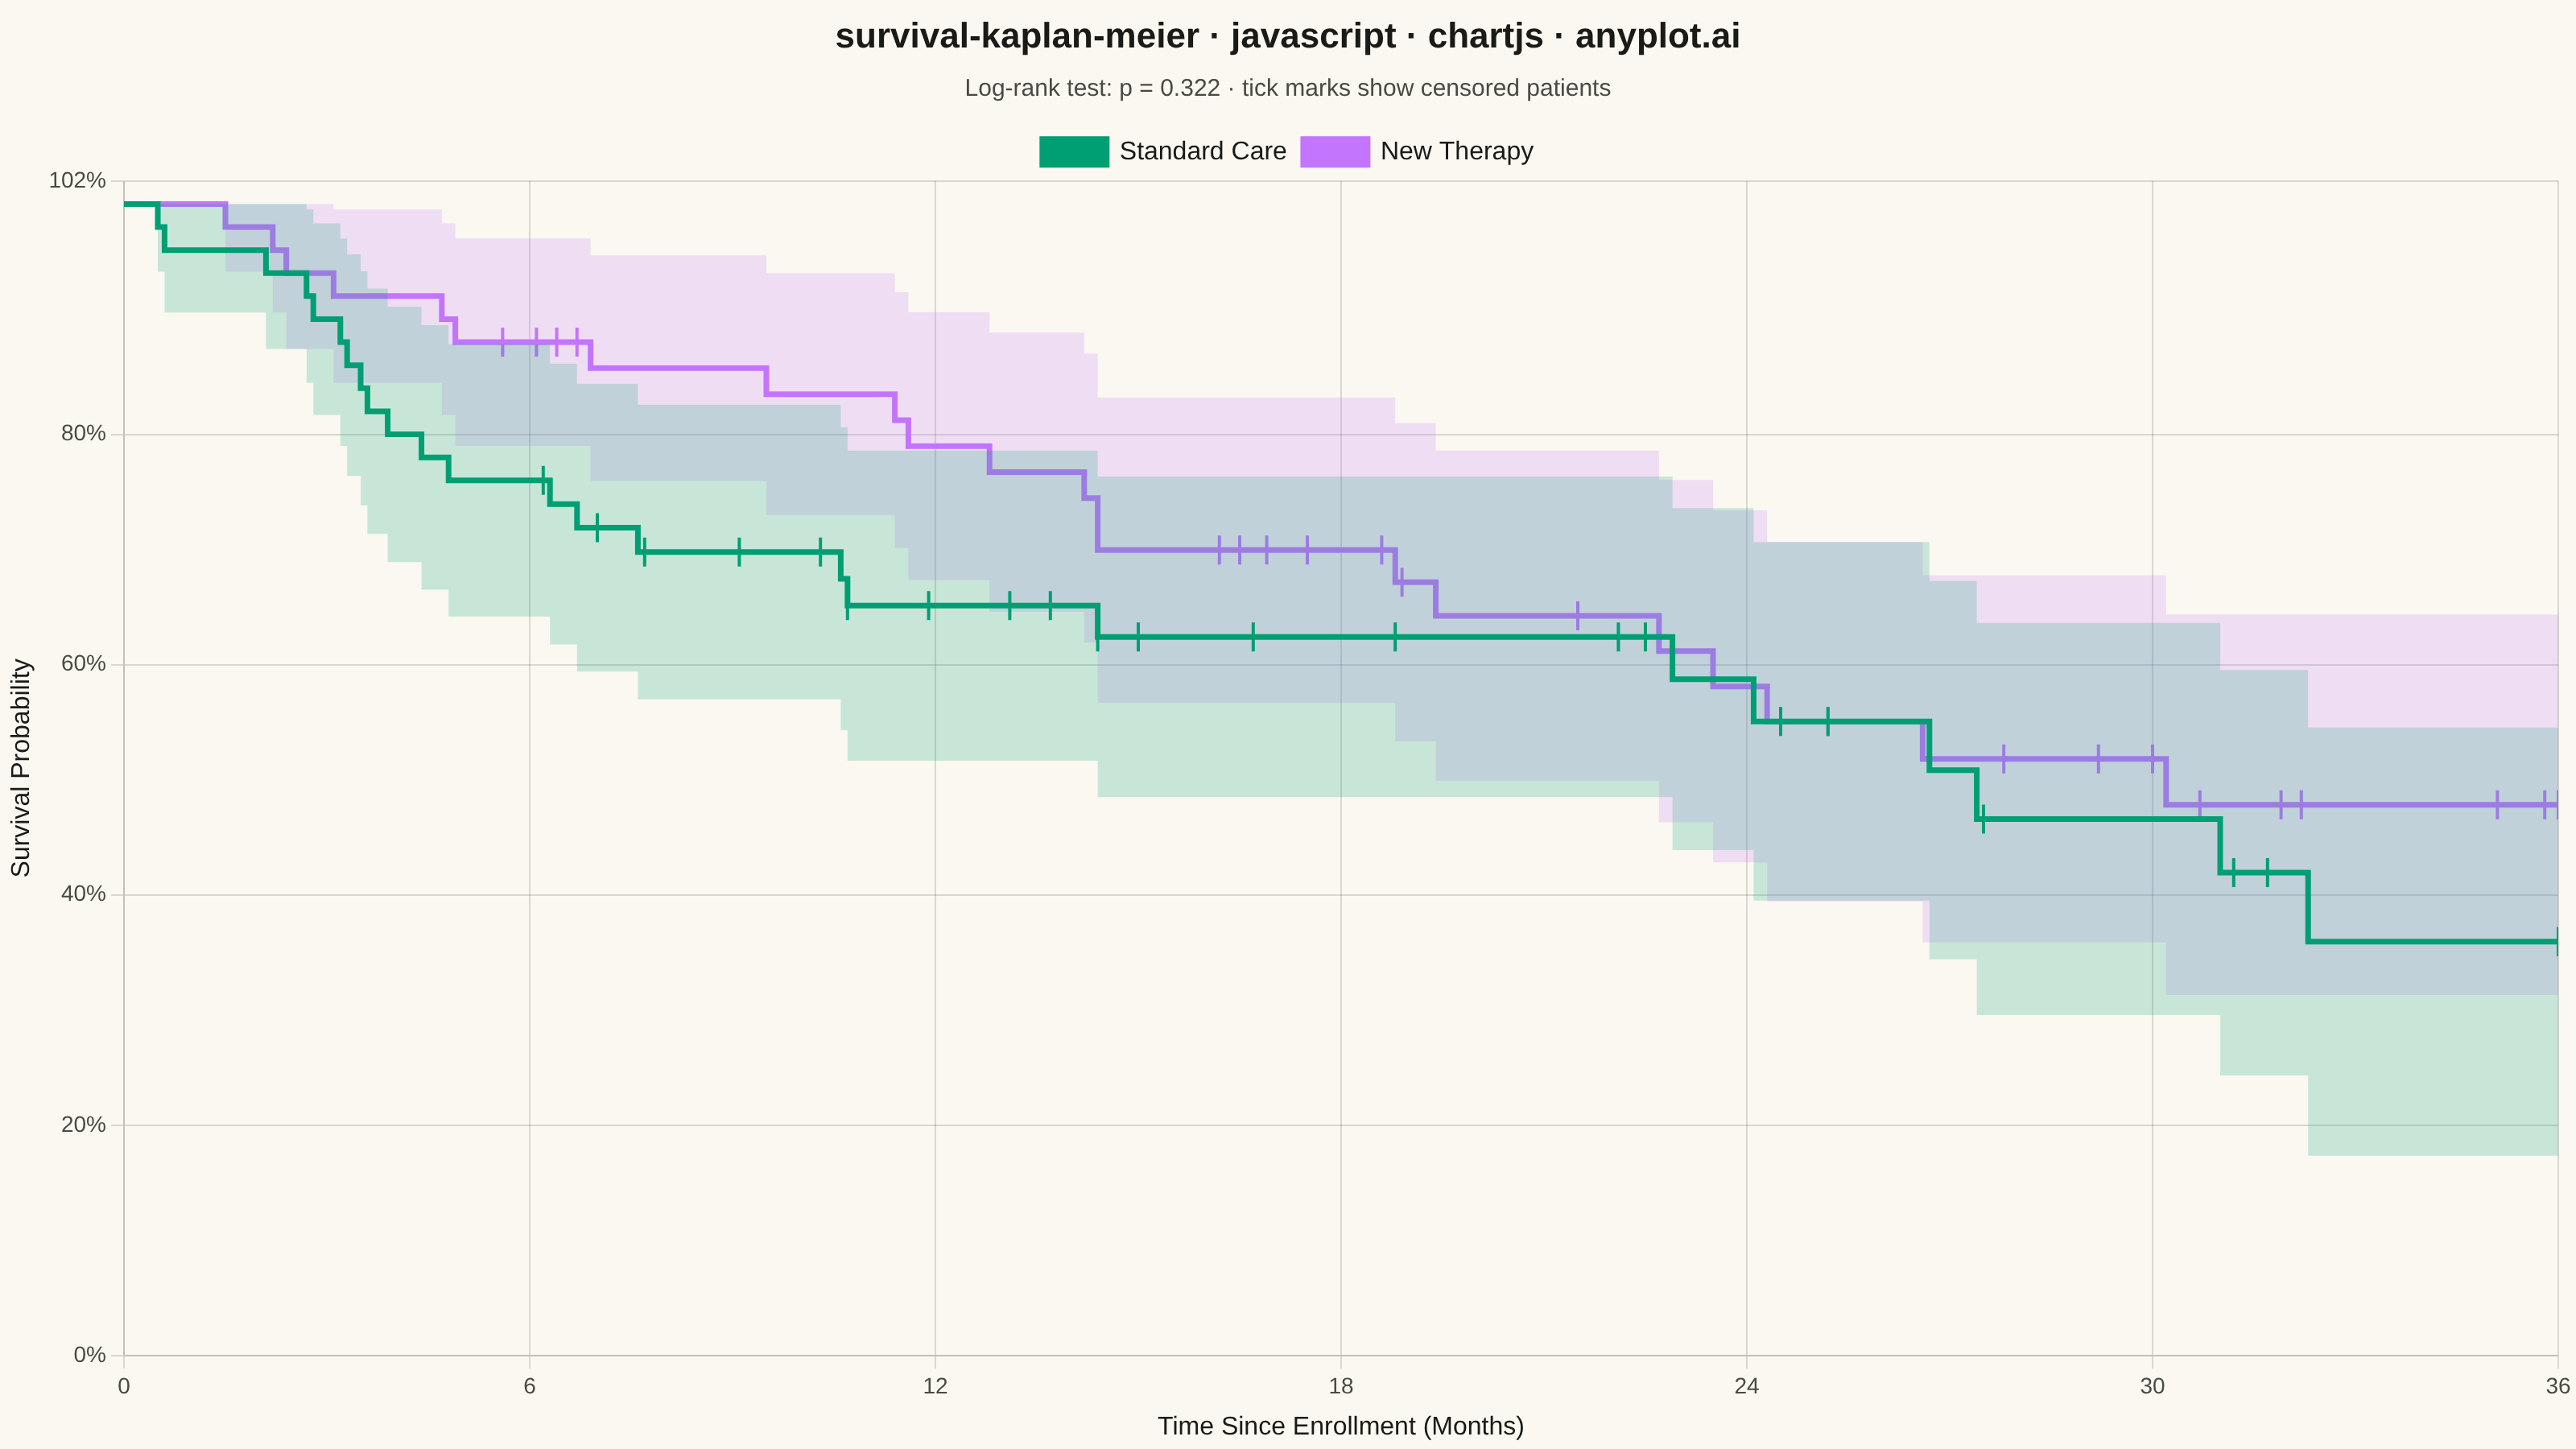
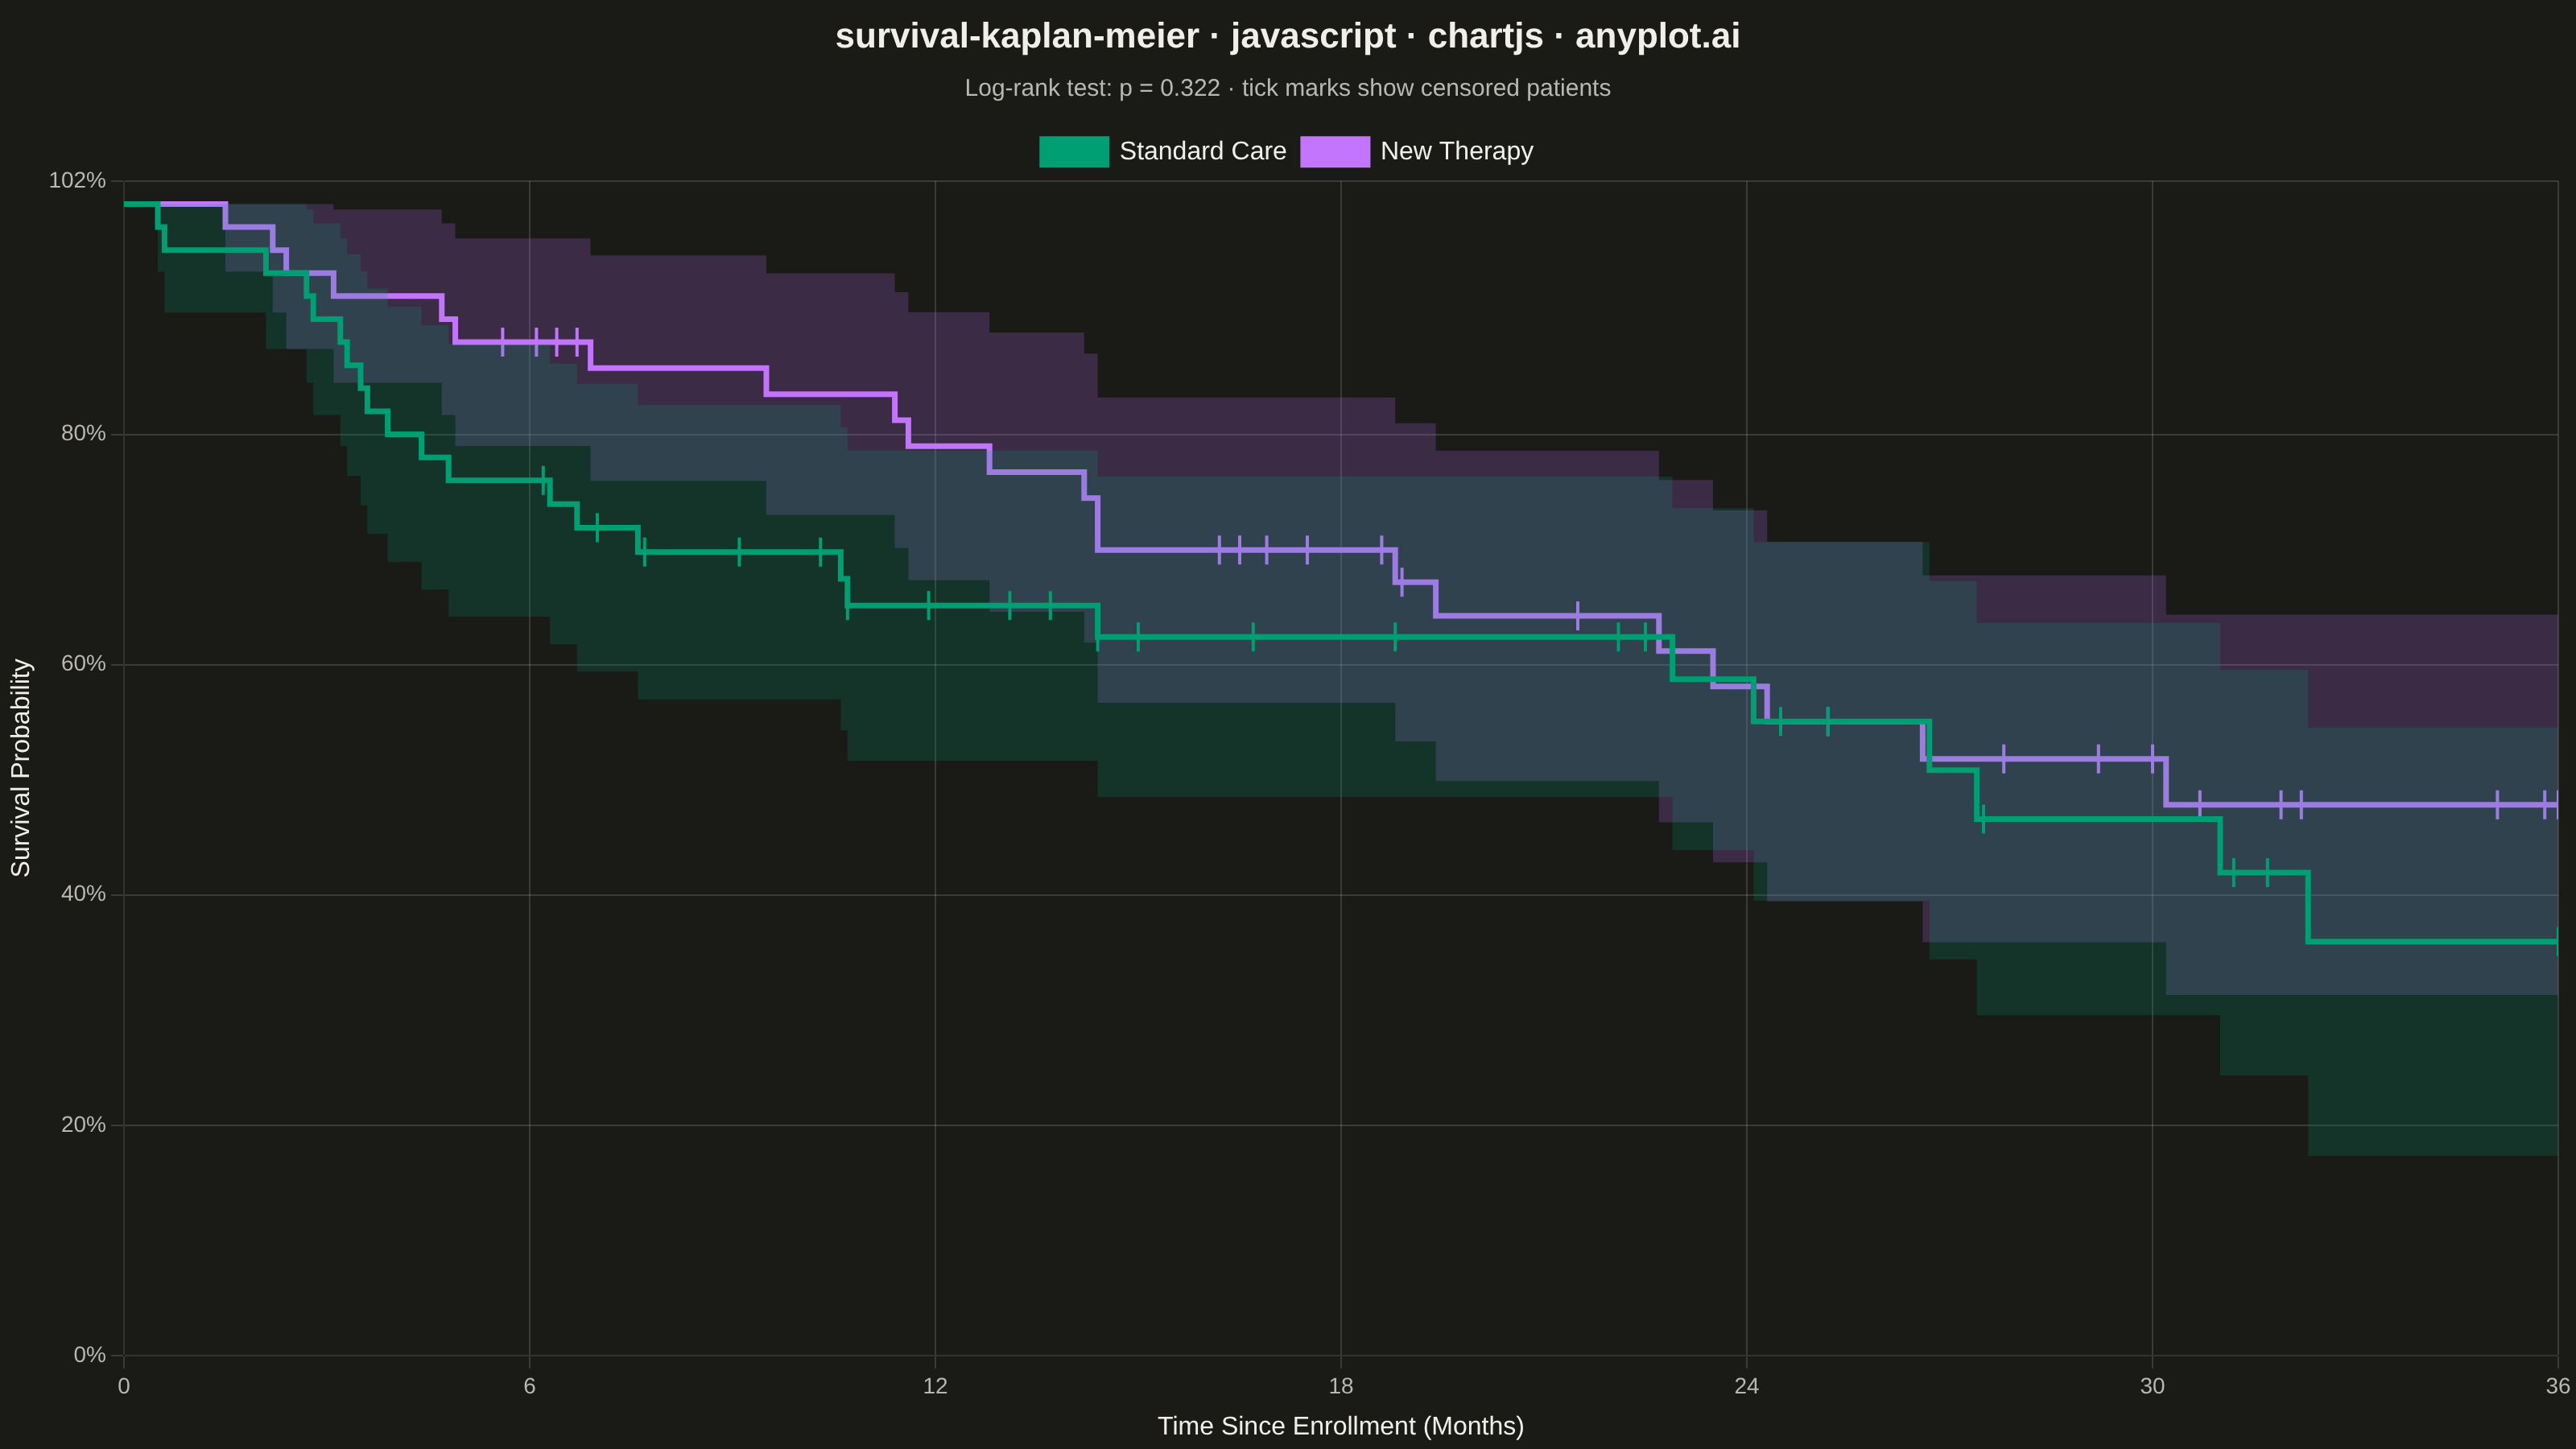
The same plot in 14 other libraries — JavaScript: D3.js, Apache ECharts, Highcharts, MUI X Charts; Python: Altair, Bokeh, lets-plot, Matplotlib, Plotly, plotnine, Pygal, Seaborn; R: ggplot2; Julia: Makie.jl. Compare all 15 side by side: Kaplan-Meier Survival Plot in Python, R, Julia and JavaScript.
A Kaplan-Meier survival plot visualizes the probability of survival (or event-free time) over a time period using a step function. It is the standard method for estimating survival functions from time-to-event data, handling censored observations where the event has not yet occurred. The plot shows how survival probability decreases over time, with optional confidence intervals and comparison between groups.
// anyplot.ai
// survival-kaplan-meier: Kaplan-Meier Survival Plot
// Library: chartjs 4.4.7 | JavaScript 22.23.2
// Quality: 90/100 | Created: 2026-09-09

const t = window.ANYPLOT_TOKENS;

// --- Data: two-arm clinical trial, 36-month follow-up ----------------------
// Tiny fixed-seed LCG — the browser has no seeded RNG.
const HORIZON = 36;
let seed = 42;
function rand() {
  seed = (seed * 1664525 + 1013904223) % 4294967296;
  return seed / 4294967296;
}

function generateArm(hazardRate, n) {
  const times = [];
  const events = [];
  for (let i = 0; i < n; i++) {
    const trueEventTime = -Math.log(1 - rand()) / hazardRate;
    const dropoutTime = 5 + rand() * 45;
    const observed = Math.min(trueEventTime, dropoutTime, HORIZON);
    const event = trueEventTime <= dropoutTime && trueEventTime <= HORIZON ? 1 : 0;
    times.push(Math.round(observed * 10) / 10);
    events.push(event);
  }
  return { times, events };
}

const standardCare = generateArm(0.0385, 50); // median ~18 months
const newTherapy = generateArm(0.0231, 50); // median ~30 months

// --- Kaplan-Meier estimator with Greenwood confidence intervals ------------
function kaplanMeier(times, events, horizon) {
  const n = times.length;
  const paired = times.map((time, i) => ({ time, event: events[i] })).sort((a, b) => a.time - b.time);
  const uniqueTimes = [...new Set(paired.map((p) => p.time))].sort((a, b) => a - b);

  let atRisk = n;
  let survival = 1;
  let cumVarTerm = 0;

  const stepTimes = [0];
  const stepSurvival = [1];
  const ciLower = [1];
  const ciUpper = [1];
  const censorPoints = [];

  for (const time of uniqueTimes) {
    const atT = paired.filter((p) => p.time === time);
    const deaths = atT.filter((p) => p.event === 1).length;
    const censored = atT.filter((p) => p.event === 0).length;

    if (deaths > 0) {
      survival *= 1 - deaths / atRisk;
      cumVarTerm += deaths / (atRisk * (atRisk - deaths));
      const se = survival * Math.sqrt(cumVarTerm);
      stepTimes.push(time);
      stepSurvival.push(survival);
      ciLower.push(Math.max(0, survival - 1.96 * se));
      ciUpper.push(Math.min(1, survival + 1.96 * se));
    }
    if (censored > 0) censorPoints.push({ time, survival });
    atRisk -= atT.length;
  }

  if (stepTimes[stepTimes.length - 1] < horizon) {
    stepTimes.push(horizon);
    stepSurvival.push(survival);
    ciLower.push(ciLower[ciLower.length - 1]);
    ciUpper.push(ciUpper[ciUpper.length - 1]);
  }

  return { stepTimes, stepSurvival, ciLower, ciUpper, censorPoints };
}

// --- Log-rank test (Mantel-Haenszel), reported in the subtitle -------------
function erf(x) {
  const sign = x < 0 ? -1 : 1;
  const ax = Math.abs(x);
  const a1 = 0.254829592,
    a2 = -0.284496736,
    a3 = 1.421413741,
    a4 = -1.453152027,
    a5 = 1.061405429,
    p = 0.3275911;
  const s = 1 / (1 + p * ax);
  const y = 1 - (((((a5 * s + a4) * s + a3) * s + a2) * s + a1) * s) * Math.exp(-ax * ax);
  return sign * y;
}

function logRankTest(timesA, eventsA, timesB, eventsB) {
  const records = timesA
    .map((time, i) => ({ time, event: eventsA[i], arm: 0 }))
    .concat(timesB.map((time, i) => ({ time, event: eventsB[i], arm: 1 })));
  const uniqueTimes = [...new Set(records.map((r) => r.time))].sort((a, b) => a - b);

  let nA = timesA.length;
  let nB = timesB.length;
  let observedA = 0;
  let expectedA = 0;
  let variance = 0;

  for (const time of uniqueTimes) {
    const atT = records.filter((r) => r.time === time);
    const dA = atT.filter((r) => r.arm === 0 && r.event === 1).length;
    const dB = atT.filter((r) => r.arm === 1 && r.event === 1).length;
    const d = dA + dB;
    const nTotal = nA + nB;
    if (d > 0 && nTotal > 1) {
      observedA += dA;
      expectedA += (d * nA) / nTotal;
      variance += (d * (nA / nTotal) * (nB / nTotal) * (nTotal - d)) / (nTotal - 1);
    }
    nA -= atT.filter((r) => r.arm === 0).length;
    nB -= atT.filter((r) => r.arm === 1).length;
  }

  const z = (observedA - expectedA) / Math.sqrt(variance);
  return 1 - erf(Math.abs(z) / Math.SQRT2);
}

const controlKM = kaplanMeier(standardCare.times, standardCare.events, HORIZON);
const treatmentKM = kaplanMeier(newTherapy.times, newTherapy.events, HORIZON);
const pValue = logRankTest(standardCare.times, standardCare.events, newTherapy.times, newTherapy.events);
const pLabel = pValue < 0.001 ? "p < 0.001" : `p = ${pValue.toFixed(3)}`;

// --- Datasets ----------------------------------------------------------
// Each arm contributes 4 datasets: a hidden CI floor, a filled CI ceiling
// (shaded band between the two), the visible step curve, and a tick-mark
// layer at censoring times. Only the step-curve datasets carry a label so
// the legend shows just the two arms, not the CI/censor plumbing.
function armDatasets(km, colorHex, label) {
  const bandFill = `${colorHex}33`; // ~20% opacity
  const stepPoints = km.stepTimes.map((time, i) => ({ x: time, y: km.stepSurvival[i] }));
  const lowerPoints = km.stepTimes.map((time, i) => ({ x: time, y: km.ciLower[i] }));
  const upperPoints = km.stepTimes.map((time, i) => ({ x: time, y: km.ciUpper[i] }));
  const censorPoints = km.censorPoints.map((c) => ({ x: c.time, y: c.survival }));

  return [
    {
      label: "",
      data: lowerPoints,
      stepped: true,
      borderWidth: 0,
      pointRadius: 0,
      fill: false,
    },
    {
      label: "",
      data: upperPoints,
      stepped: true,
      borderWidth: 0,
      pointRadius: 0,
      backgroundColor: bandFill,
      fill: "-1",
    },
    {
      label,
      data: stepPoints,
      stepped: true,
      borderColor: colorHex,
      backgroundColor: colorHex,
      borderWidth: 3.5,
      pointRadius: 0,
      fill: false,
    },
    {
      label: "",
      data: censorPoints,
      showLine: false,
      pointStyle: "line",
      pointRotation: 90,
      pointRadius: 9,
      pointBorderWidth: 2,
      borderColor: colorHex,
      backgroundColor: colorHex,
    },
  ];
}

const datasets = [
  ...armDatasets(controlKM, t.palette[0], "Standard Care"),
  ...armDatasets(treatmentKM, t.palette[1], "New Therapy"),
];

// --- Mount -----------------------------------------------------------------
const canvas = document.createElement("canvas");
document.getElementById("container").appendChild(canvas);

// --- Chart -----------------------------------------------------------------
new Chart(canvas, {
  type: "line",
  data: { datasets },
  options: {
    responsive: true,
    maintainAspectRatio: false,
    animation: false,
    plugins: {
      title: {
        display: true,
        text: "survival-kaplan-meier · javascript · chartjs · anyplot.ai",
        color: t.ink,
        font: { size: 22 },
      },
      subtitle: {
        display: true,
        text: `Log-rank test: ${pLabel} · tick marks show censored patients`,
        color: t.inkSoft,
        font: { size: 15 },
        padding: { bottom: 12 },
      },
      legend: {
        labels: {
          color: t.ink,
          font: { size: 16 },
          filter: (item, data) => data.datasets[item.datasetIndex].label !== "",
        },
      },
    },
    scales: {
      x: {
        type: "linear",
        min: 0,
        max: HORIZON,
        ticks: { color: t.inkSoft, font: { size: 14 }, stepSize: 6 },
        grid: { color: t.grid },
        title: { display: true, text: "Time Since Enrollment (Months)", color: t.ink, font: { size: 16 } },
      },
      y: {
        min: 0,
        max: 1.02,
        ticks: {
          color: t.inkSoft,
          font: { size: 14 },
          stepSize: 0.2,
          callback: (value) => `${Math.round(value * 100)}%`,
        },
        grid: { color: t.grid },
        title: { display: true, text: "Survival Probability", color: t.ink, font: { size: 16 } },
      },
    },
  },
});
Runnable source as JSON, for any HTTP client: https://api.anyplot.ai/specs/survival-kaplan-meier/chartjs/code. Any spec id and library id listed in llms-full.txt fit the same URL shape; every URL below is complete and callable.
{
  "spec_id": "survival-kaplan-meier",
  "language": "javascript",
  "library": "chartjs",
  "page": "https://anyplot.ai/survival-kaplan-meier/javascript/chartjs",
  "hub": "https://anyplot.ai/survival-kaplan-meier",
  "code_json": "https://api.anyplot.ai/specs/survival-kaplan-meier/chartjs/code",
  "spec_json": "https://api.anyplot.ai/specs/survival-kaplan-meier",
  "render_light_png": "https://storage.googleapis.com/anyplot-images/plots/survival-kaplan-meier/javascript/chartjs/plot-light.png",
  "render_dark_png": "https://storage.googleapis.com/anyplot-images/plots/survival-kaplan-meier/javascript/chartjs/plot-dark.png",
  "interactive_light_html": "https://storage.googleapis.com/anyplot-images/plots/survival-kaplan-meier/javascript/chartjs/plot-light.html",
  "interactive_dark_html": "https://storage.googleapis.com/anyplot-images/plots/survival-kaplan-meier/javascript/chartjs/plot-dark.html",
  "quality_score": 90.0,
  "license": "MIT",
  "guide": "https://anyplot.ai/llms.txt"
}
Part of Kaplan-Meier Survival Plot on anyplot.ai.