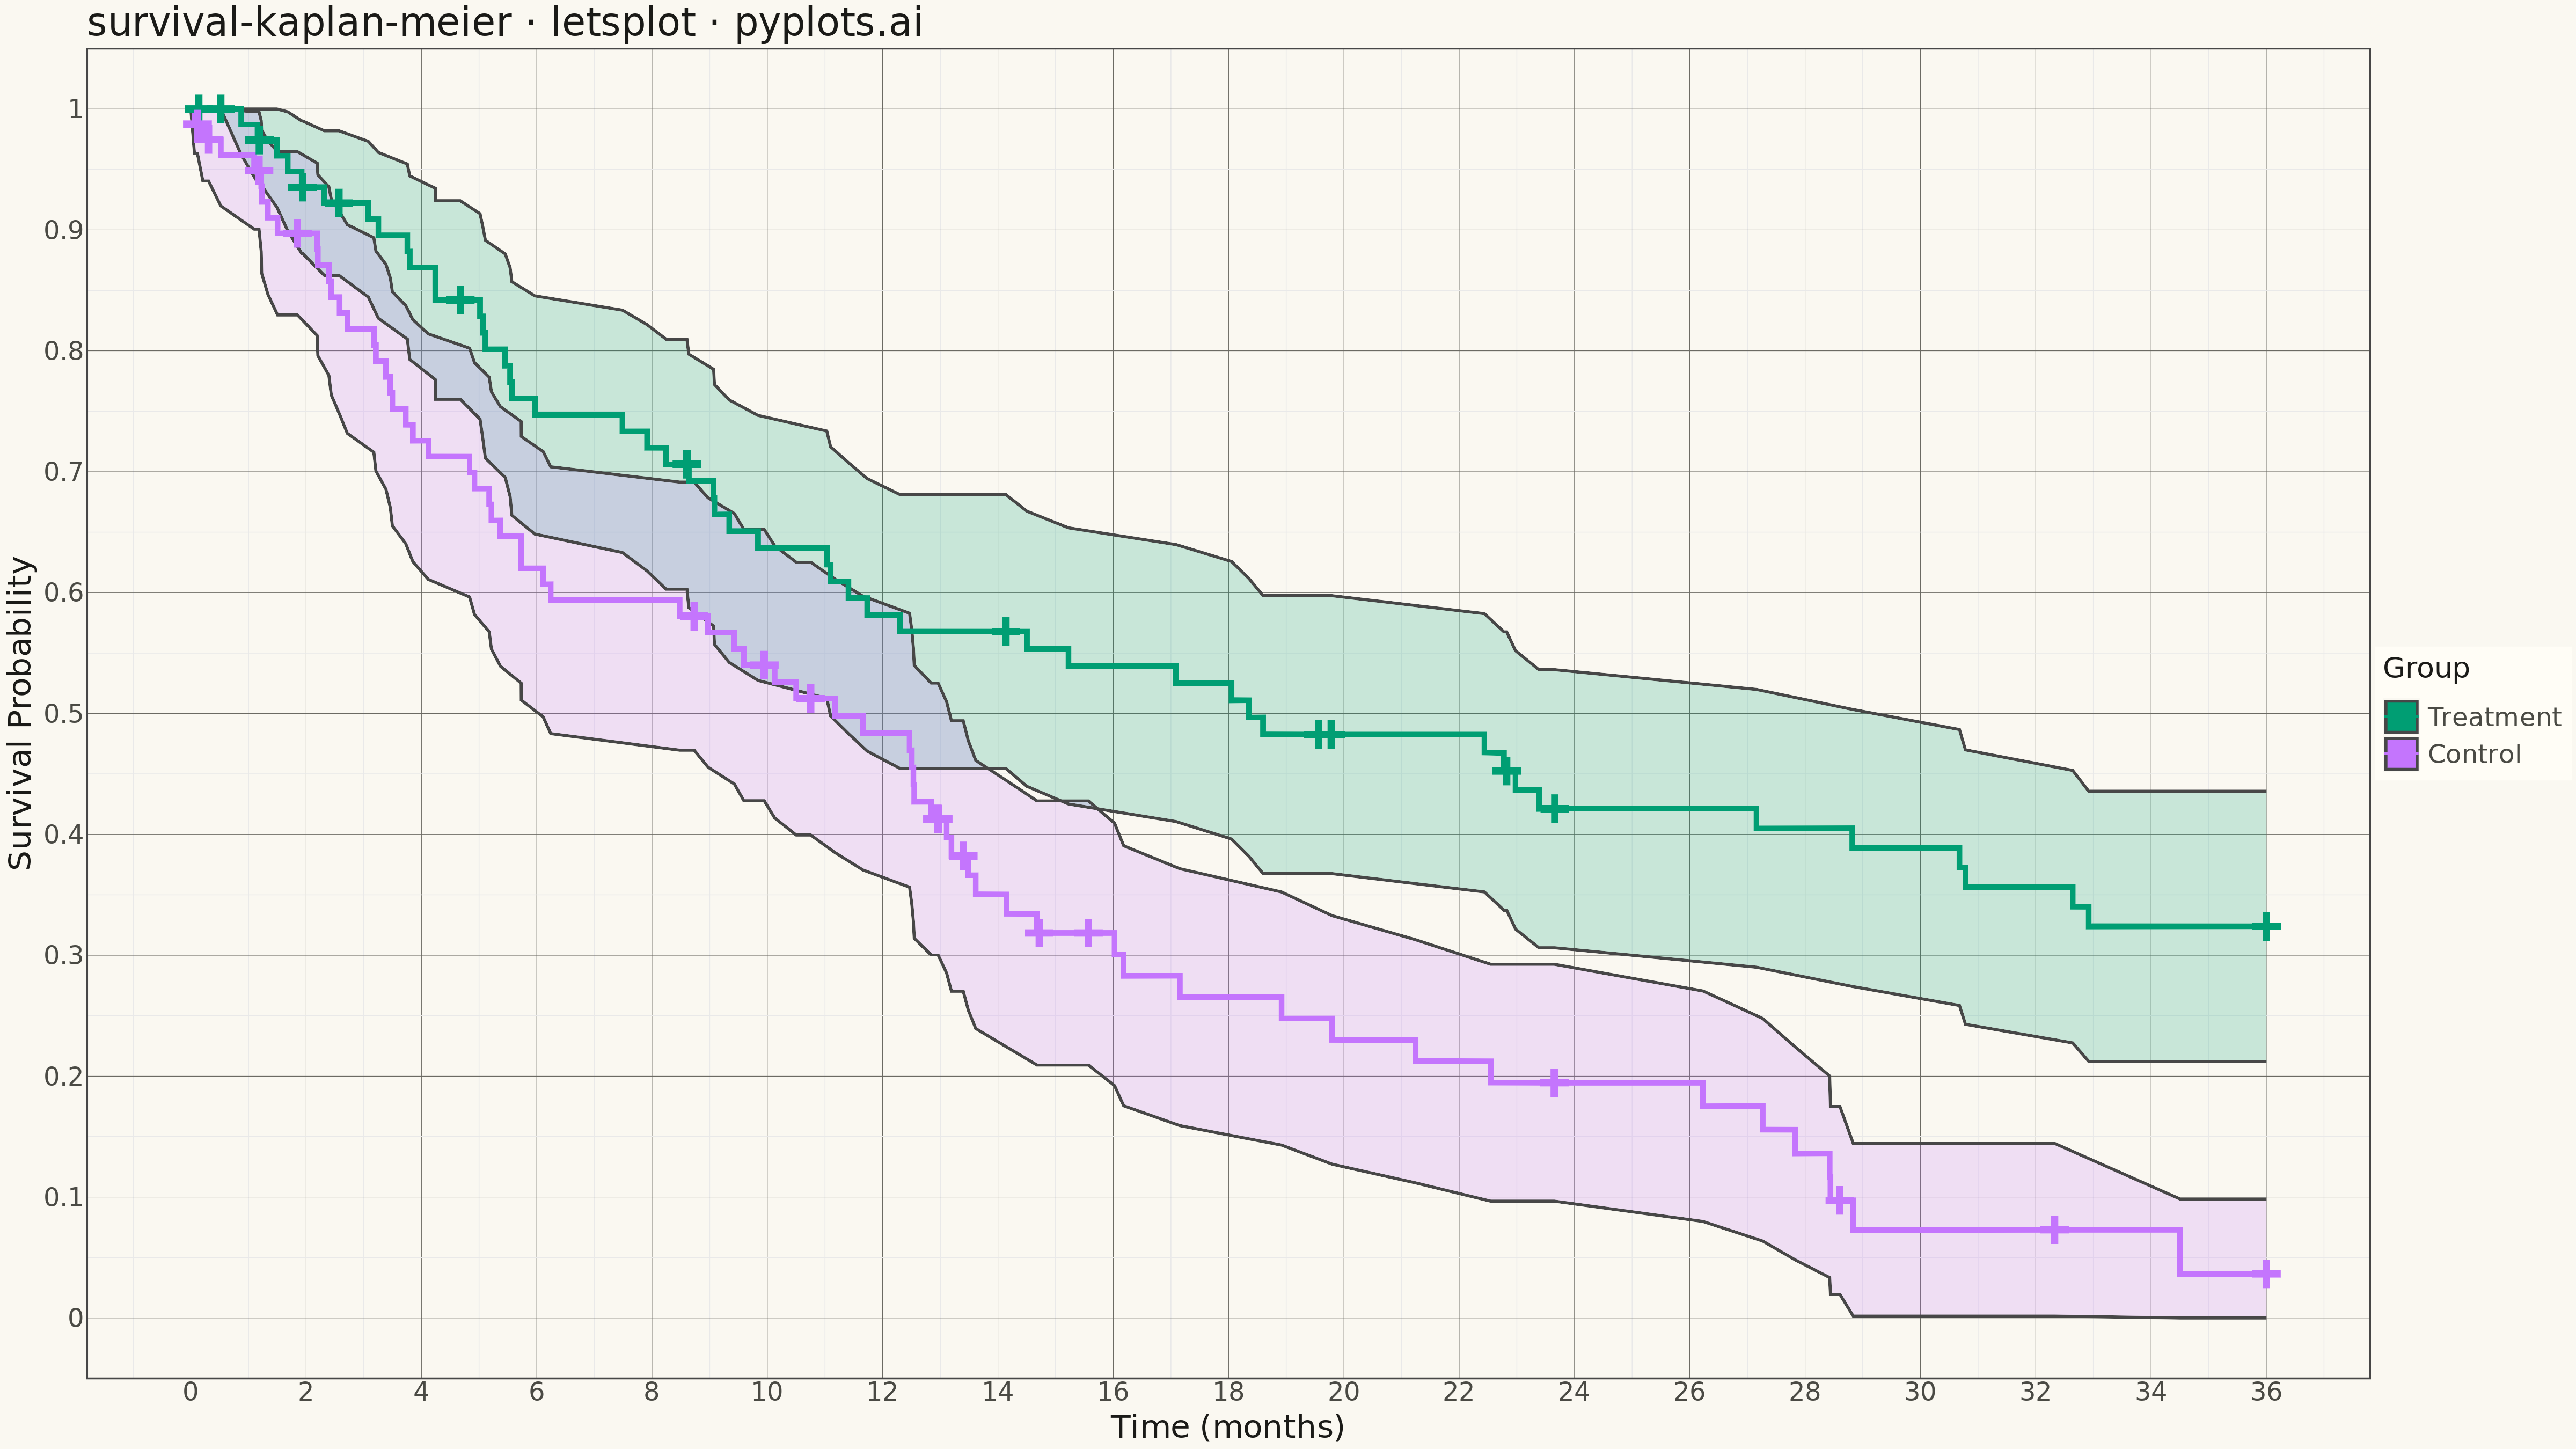
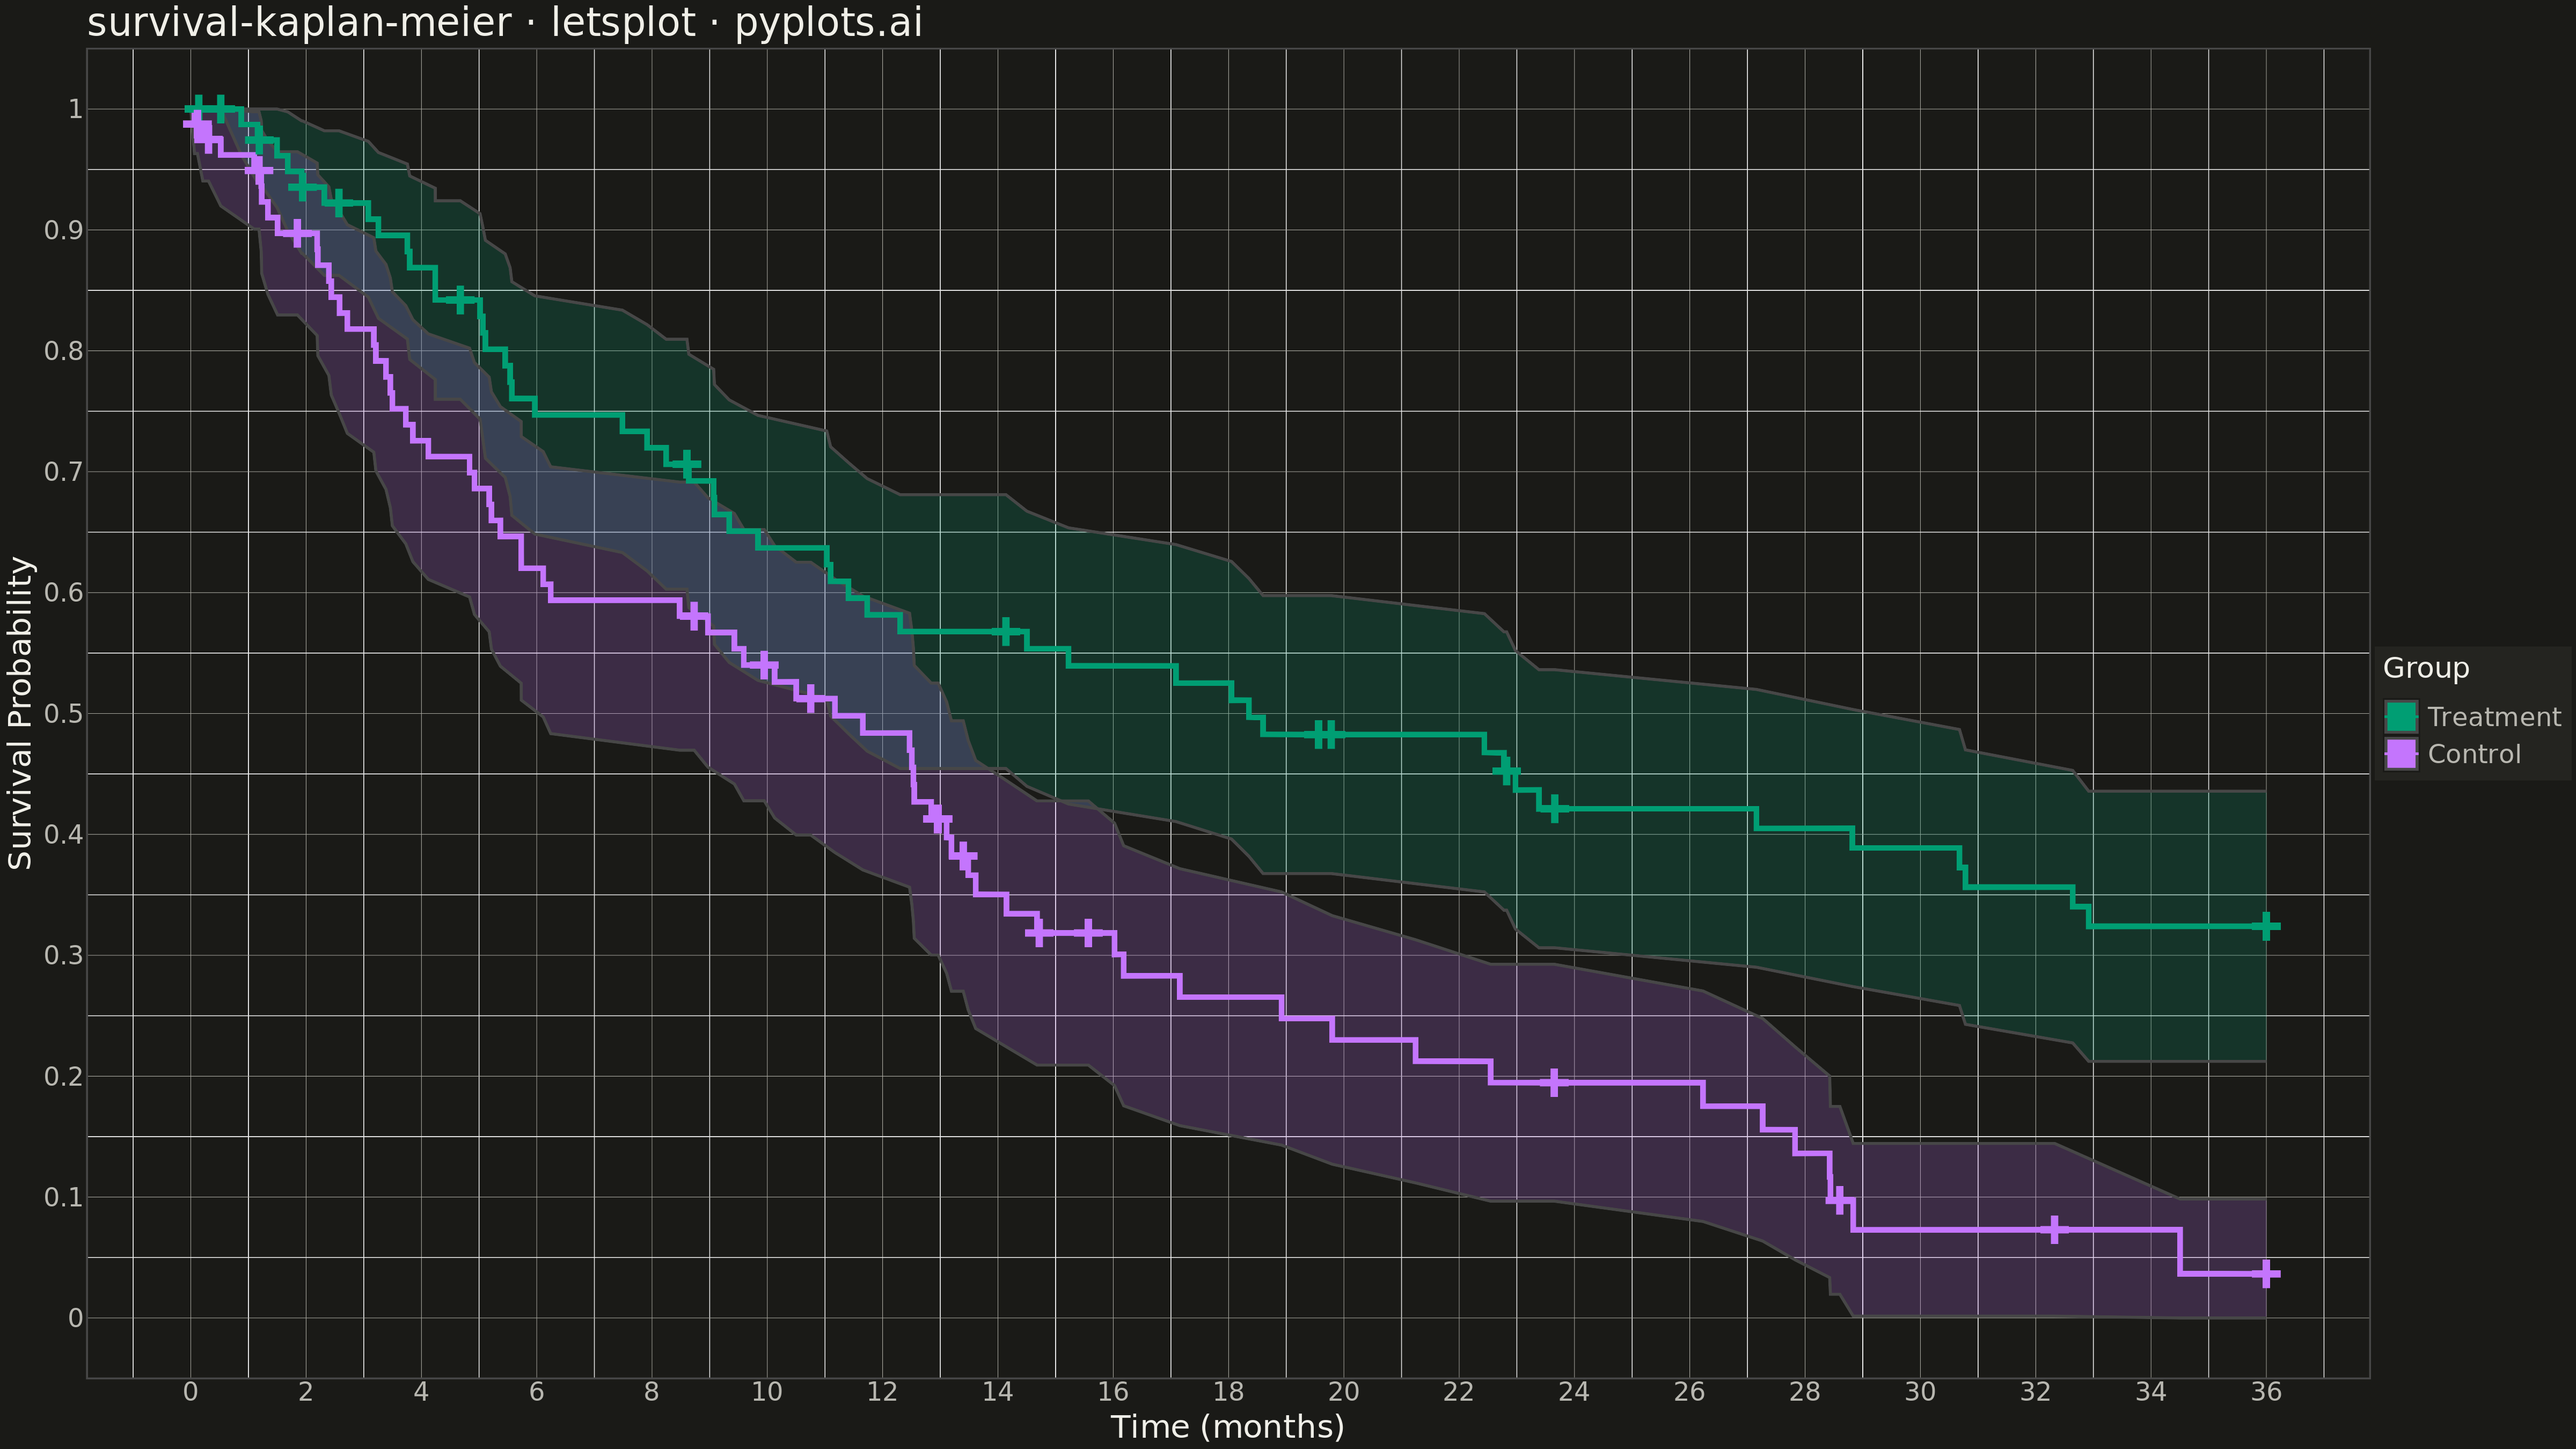
A Kaplan-Meier survival plot visualizes the probability of survival (or event-free time) over a time period using a step function. It is the standard method for estimating survival functions from time-to-event data, handling censored observations where the event has not yet occurred. The plot shows how survival probability decreases over time, with optional confidence intervals and comparison between groups.
""" anyplot.ai
survival-kaplan-meier: Kaplan-Meier Survival Plot
Library: letsplot 4.9.0 | Python 3.13.13
Quality: 94/100 | Updated: 2026-05-11
"""

import os
import shutil

import numpy as np
import pandas as pd
from lets_plot import (
    LetsPlot,
    aes,
    element_line,
    element_rect,
    element_text,
    geom_point,
    geom_ribbon,
    geom_step,
    ggplot,
    ggsave,
    ggsize,
    labs,
    scale_color_manual,
    scale_fill_manual,
    theme,
    theme_minimal,
)


LetsPlot.setup_html()

# Theme tokens
THEME = os.getenv("ANYPLOT_THEME", "light")
PAGE_BG = "#FAF8F1" if THEME == "light" else "#1A1A17"
ELEVATED_BG = "#FFFDF6" if THEME == "light" else "#242420"
INK = "#1A1A17" if THEME == "light" else "#F0EFE8"
INK_SOFT = "#4A4A44" if THEME == "light" else "#B8B7B0"
INK_MUTED = "#6B6A63" if THEME == "light" else "#A8A79F"

# Okabe-Ito palette (brand color #009E73 is first series)
IMPRINT = ["#009E73", "#C475FD"]

# Data - Simulated clinical trial survival data for two treatment groups
np.random.seed(42)

n_per_group = 80


def generate_survival_data(n, hazard_rate, group_name):
    """Generate survival data with exponential distribution."""
    times = np.random.exponential(scale=1 / hazard_rate, size=n)
    times = np.clip(times, 0, 36)  # Max follow-up 36 months
    censored = times >= 36
    times[censored] = 36
    event = (~censored).astype(int)
    # Add random censoring (20% of non-terminal events)
    random_censor = np.random.random(n) < 0.2
    event[random_censor] = 0
    return pd.DataFrame({"time": times, "event": event, "group": group_name})


# Treatment group (lower hazard = better survival)
treatment = generate_survival_data(n_per_group, hazard_rate=0.04, group_name="Treatment")
# Control group (higher hazard = worse survival)
control = generate_survival_data(n_per_group, hazard_rate=0.08, group_name="Control")
df = pd.concat([treatment, control], ignore_index=True)


# Kaplan-Meier estimator function
def kaplan_meier(time, event):
    """Compute Kaplan-Meier survival curve with confidence intervals."""
    df_km = pd.DataFrame({"time": time, "event": event}).sort_values("time")
    unique_times = np.sort(df_km["time"].unique())
    n_at_risk = len(df_km)
    survival = 1.0
    results = [{"time": 0, "survival": 1.0, "ci_lower": 1.0, "ci_upper": 1.0, "n_at_risk": n_at_risk}]
    var_sum = 0

    for t in unique_times:
        at_time = df_km[df_km["time"] == t]
        d = at_time["event"].sum()  # Number of events
        n = n_at_risk  # Number at risk
        if n > 0 and d > 0:
            survival *= 1 - d / n
            var_sum += d / (n * (n - d)) if n > d else 0
        # Greenwood's formula for variance
        se = survival * np.sqrt(var_sum) if var_sum > 0 else 0
        ci_lower = max(0, survival - 1.96 * se)
        ci_upper = min(1, survival + 1.96 * se)
        results.append({"time": t, "survival": survival, "ci_lower": ci_lower, "ci_upper": ci_upper, "n_at_risk": n})
        n_at_risk -= len(at_time)

    return pd.DataFrame(results)


# Compute Kaplan-Meier for each group
km_treatment = kaplan_meier(treatment["time"], treatment["event"])
km_treatment["group"] = "Treatment"
km_control = kaplan_meier(control["time"], control["event"])
km_control["group"] = "Control"
km_data = pd.concat([km_treatment, km_control], ignore_index=True)

# Find censored observations for tick marks
censored_treatment = treatment[treatment["event"] == 0].copy()
censored_control = control[control["event"] == 0].copy()


def get_survival_at_time(km_df, t):
    """Get survival probability at a given time."""
    km_df = km_df.sort_values("time")
    idx = km_df[km_df["time"] <= t].index
    if len(idx) == 0:
        return 1.0
    return km_df.loc[idx[-1], "survival"]


censored_treatment["survival"] = censored_treatment["time"].apply(lambda t: get_survival_at_time(km_treatment, t))
censored_treatment["group"] = "Treatment"
censored_control["survival"] = censored_control["time"].apply(lambda t: get_survival_at_time(km_control, t))
censored_control["group"] = "Control"
censored_data = pd.concat([censored_treatment, censored_control], ignore_index=True)

# Plot
plot = (
    ggplot()
    # Confidence interval ribbons
    + geom_ribbon(aes(x="time", ymin="ci_lower", ymax="ci_upper", fill="group"), data=km_data, alpha=0.2)
    # Step functions for survival curves
    + geom_step(aes(x="time", y="survival", color="group"), data=km_data, size=1.5)
    # Censored observation tick marks
    + geom_point(
        aes(x="time", y="survival", color="group"),
        data=censored_data,
        shape=3,  # Plus sign for censoring ticks
        size=4,
        stroke=2,
    )
    + scale_color_manual(values=IMPRINT)
    + scale_fill_manual(values=IMPRINT)
    + labs(
        x="Time (months)",
        y="Survival Probability",
        title="survival-kaplan-meier · letsplot · pyplots.ai",
        color="Group",
        fill="Group",
    )
    + theme_minimal()
    + theme(
        plot_background=element_rect(fill=PAGE_BG, color=PAGE_BG),
        panel_background=element_rect(fill=PAGE_BG),
        panel_grid_major=element_line(color=INK_MUTED, size=0.3),
        axis_title=element_text(size=20, color=INK),
        axis_text=element_text(size=16, color=INK_SOFT),
        axis_line=element_line(color=INK_SOFT, size=0.5),
        plot_title=element_text(size=24, color=INK),
        legend_background=element_rect(fill=ELEVATED_BG, color=INK_SOFT),
        legend_text=element_text(size=16, color=INK_SOFT),
        legend_title=element_text(size=18, color=INK),
    )
    + ggsize(1600, 900)
)

# Save
ggsave(plot, f"plot-{THEME}.png", scale=3)
ggsave(plot, f"plot-{THEME}.html")

# lets-plot creates a subdirectory; move files to current directory
if os.path.exists("lets-plot-images"):
    for file in os.listdir("lets-plot-images"):
        shutil.move(f"lets-plot-images/{file}", file)
    os.rmdir("lets-plot-images")
Runnable source as JSON, for any HTTP client: https://api.anyplot.ai/specs/survival-kaplan-meier/letsplot/code. Any spec id and library id listed in llms-full.txt fit the same URL shape; every URL below is complete and callable.
{
  "spec_id": "survival-kaplan-meier",
  "language": "python",
  "library": "letsplot",
  "page": "https://anyplot.ai/survival-kaplan-meier/python/letsplot",
  "hub": "https://anyplot.ai/survival-kaplan-meier",
  "code_json": "https://api.anyplot.ai/specs/survival-kaplan-meier/letsplot/code",
  "spec_json": "https://api.anyplot.ai/specs/survival-kaplan-meier",
  "render_light_png": "https://storage.googleapis.com/anyplot-images/plots/survival-kaplan-meier/python/letsplot/plot-light.png",
  "render_dark_png": "https://storage.googleapis.com/anyplot-images/plots/survival-kaplan-meier/python/letsplot/plot-dark.png",
  "interactive_light_html": "https://storage.googleapis.com/anyplot-images/plots/survival-kaplan-meier/python/letsplot/plot-light.html",
  "interactive_dark_html": "https://storage.googleapis.com/anyplot-images/plots/survival-kaplan-meier/python/letsplot/plot-dark.html",
  "quality_score": 94.0,
  "license": "MIT",
  "guide": "https://anyplot.ai/llms.txt"
}
Part of Kaplan-Meier Survival Plot on anyplot.ai.