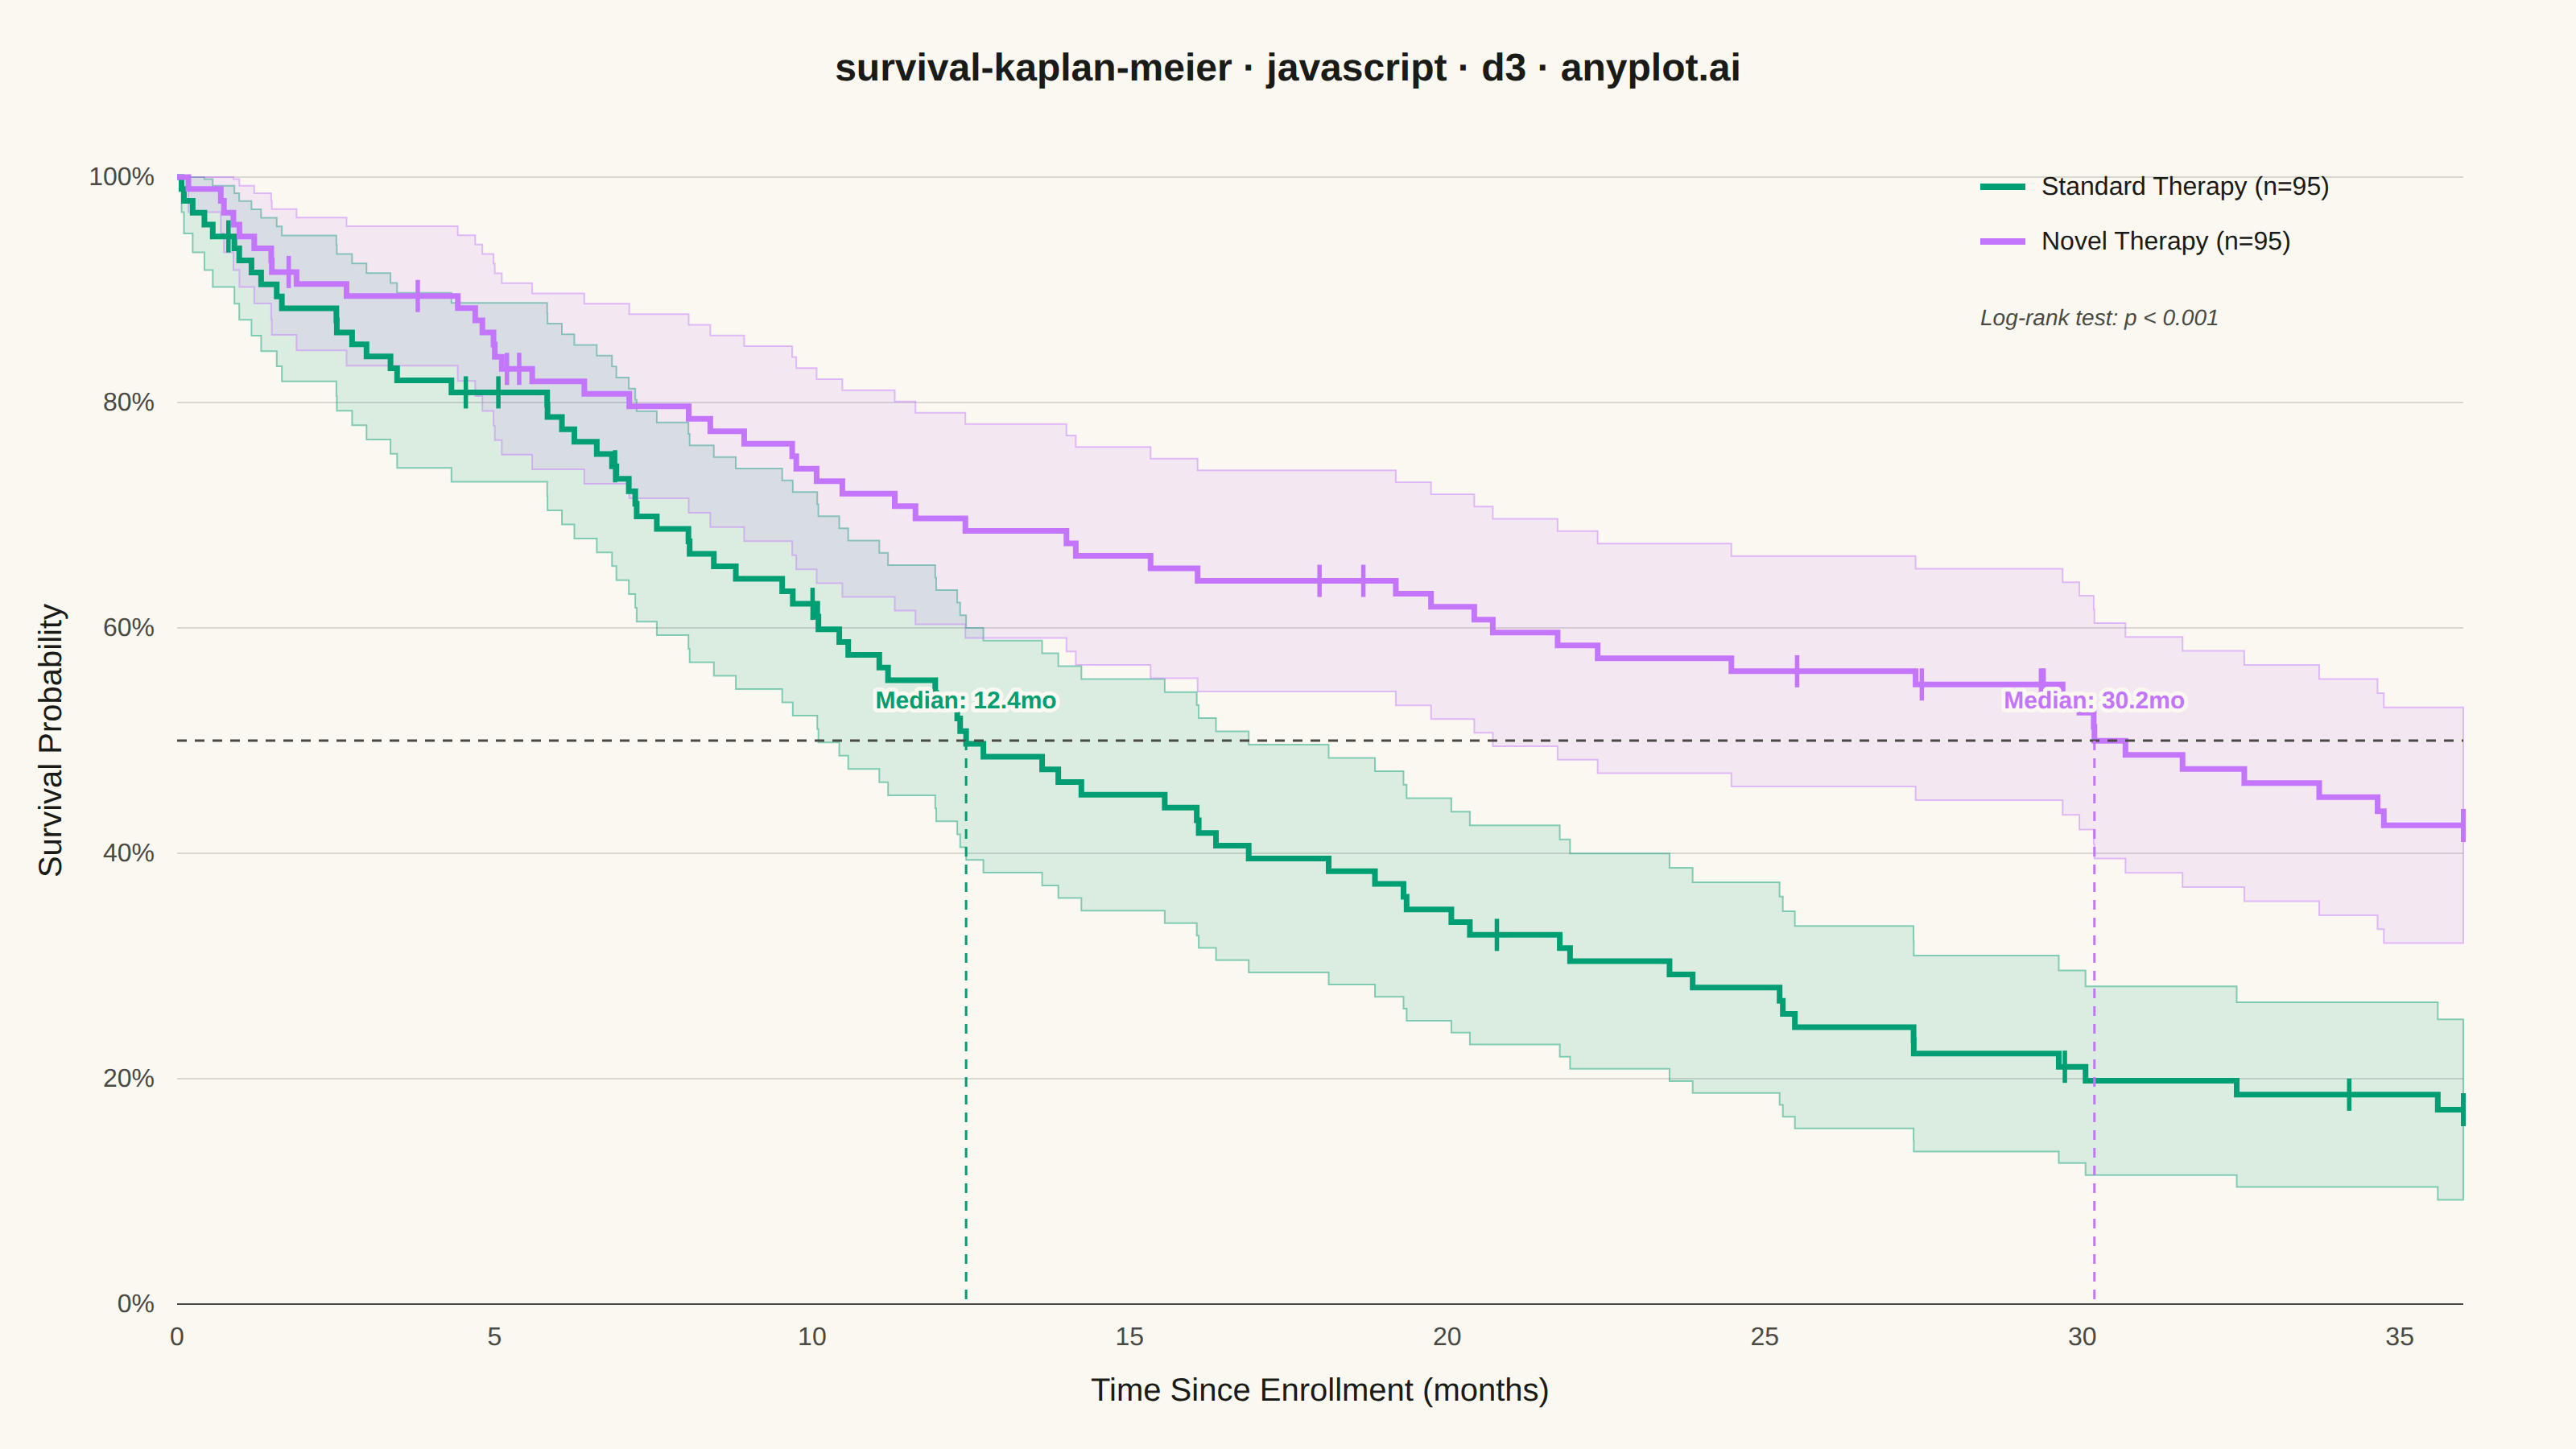
The same plot in 14 other libraries — JavaScript: Chart.js, Apache ECharts, Highcharts, MUI X Charts; Python: Altair, Bokeh, lets-plot, Matplotlib, Plotly, plotnine, Pygal, Seaborn; R: ggplot2; Julia: Makie.jl. Compare all 15 side by side: Kaplan-Meier Survival Plot in Python, R, Julia and JavaScript.
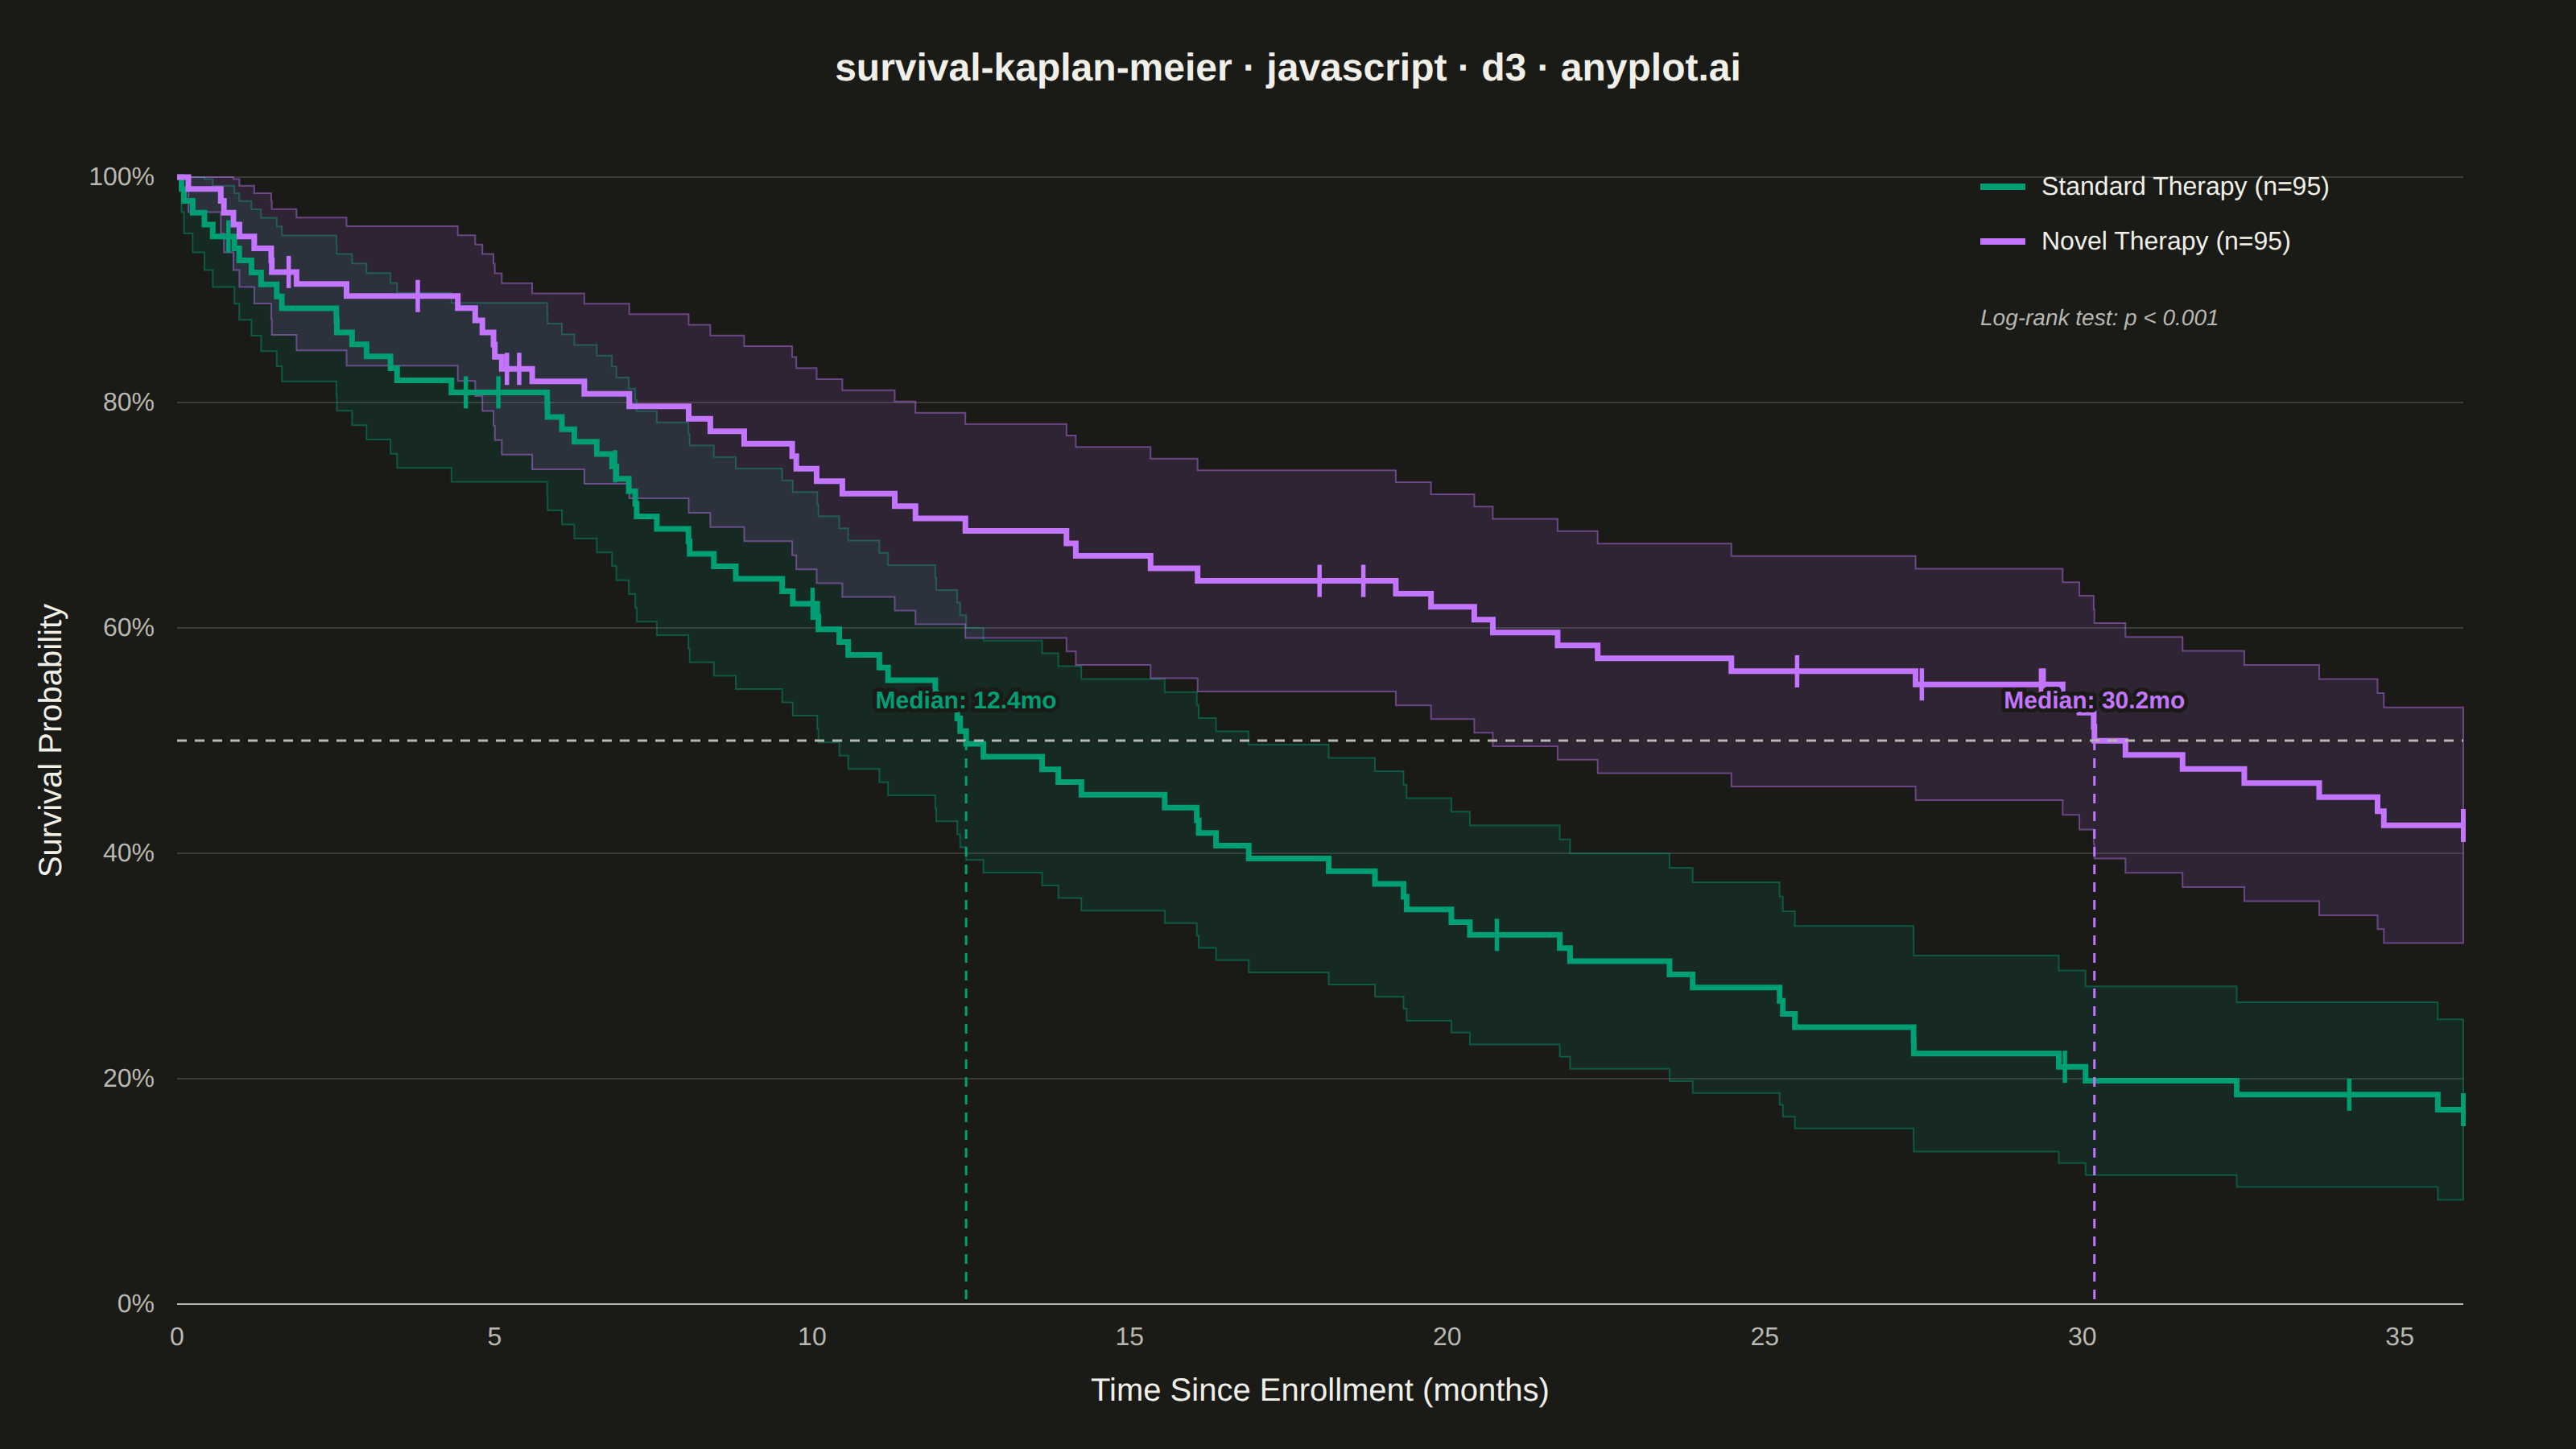
A Kaplan-Meier survival plot visualizes the probability of survival (or event-free time) over a time period using a step function. It is the standard method for estimating survival functions from time-to-event data, handling censored observations where the event has not yet occurred. The plot shows how survival probability decreases over time, with optional confidence intervals and comparison between groups.
// anyplot.ai
// survival-kaplan-meier: Kaplan-Meier Survival Plot
// Library: d3 7.9.0 | JavaScript 22.23.2
// Quality: 93/100 | Created: 2026-09-09

//# anyplot-orientation: landscape
const t = window.ANYPLOT_TOKENS;
const { width, height } = window.ANYPLOT_SIZE;
const margin = { top: 110, right: 70, bottom: 90, left: 110 };
const iw = width - margin.left - margin.right;
const ih = height - margin.top - margin.bottom;

// --- Data (in-memory, deterministic) ----------------------------------------
// Simple LCG — the browser has no seeded Math.random.
let seed = 42;
function rand() {
  seed = (seed * 1664525 + 1013904223) % 4294967296;
  return seed / 4294967296;
}

const FOLLOW_UP_MONTHS = 36;

function simulatePatients(n, hazardRate, dropoutProb) {
  const patients = [];
  for (let i = 0; i < n; i++) {
    const eventTime = -Math.log(rand()) / hazardRate;
    const dropoutTime =
      rand() < dropoutProb ? rand() * FOLLOW_UP_MONTHS : Infinity;
    const censorTime = Math.min(dropoutTime, FOLLOW_UP_MONTHS);
    const time = Math.min(eventTime, censorTime);
    patients.push({ time, event: eventTime <= censorTime ? 1 : 0 });
  }
  return patients;
}

function medianSurvivalTime(steps) {
  for (const s of steps) if (s.survival <= 0.5) return s.time;
  return null;
}

function normalCdf(z) {
  // Abramowitz-Stegun erf approximation
  const sign = z < 0 ? -1 : 1;
  const x = Math.abs(z) / Math.SQRT2;
  const a1 = 0.254829592,
    a2 = -0.284496736,
    a3 = 1.421413741,
    a4 = -1.453152027,
    a5 = 1.061405429,
    p = 0.3275911;
  const tt = 1 / (1 + p * x);
  const erf =
    1 -
    ((((a5 * tt + a4) * tt + a3) * tt + a2) * tt + a1) * tt * Math.exp(-x * x);
  return 0.5 * (1 + sign * erf);
}

function logRankTest(group1, group2) {
  const eventTimes = Array.from(
    new Set(
      [...group1, ...group2].filter((d) => d.event === 1).map((d) => d.time),
    ),
  ).sort((a, b) => a - b);

  let observed1 = 0;
  let expected1 = 0;
  let variance = 0;
  for (const time of eventTimes) {
    const n1 = group1.filter((d) => d.time >= time).length;
    const n2 = group2.filter((d) => d.time >= time).length;
    const d1 = group1.filter((d) => d.time === time && d.event === 1).length;
    const d2 = group2.filter((d) => d.time === time && d.event === 1).length;
    const n = n1 + n2;
    const d = d1 + d2;
    if (n <= 1) continue;
    observed1 += d1;
    expected1 += (d * n1) / n;
    variance += (d * (n - d) * n1 * n2) / (n * n * (n - 1));
  }
  const chiSquare = variance > 0 ? (observed1 - expected1) ** 2 / variance : 0;
  const pValue = 2 * (1 - normalCdf(Math.sqrt(chiSquare)));
  return { chiSquare, pValue };
}

function kaplanMeier(patients) {
  const eventTimes = Array.from(
    new Set(patients.filter((d) => d.event === 1).map((d) => d.time)),
  ).sort((a, b) => a - b);

  let survival = 1;
  let varianceSum = 0;
  const steps = [{ time: 0, survival: 1, lower: 1, upper: 1 }];

  for (const time of eventTimes) {
    const atRisk = patients.filter((d) => d.time >= time).length;
    const deaths = patients.filter(
      (d) => d.time === time && d.event === 1,
    ).length;
    survival *= 1 - deaths / atRisk;
    if (atRisk > deaths) varianceSum += deaths / (atRisk * (atRisk - deaths));
    const se = survival * Math.sqrt(varianceSum);
    steps.push({
      time,
      survival,
      lower: Math.max(0, survival - 1.96 * se),
      upper: Math.min(1, survival + 1.96 * se),
    });
  }
  steps.push({ ...steps[steps.length - 1], time: FOLLOW_UP_MONTHS });

  const censored = patients
    .filter((d) => d.event === 0 && d.time > 0)
    .map((d) => {
      let level = steps[0];
      for (const s of steps) if (s.time <= d.time) level = s;
      return { time: d.time, survival: level.survival };
    });

  return { steps, censored };
}

const groups = [
  { name: "Standard Therapy", n: 95, hazardRate: 0.05, dropoutProb: 0.18 },
  { name: "Novel Therapy", n: 95, hazardRate: 0.027, dropoutProb: 0.18 },
];
const patientSets = groups.map((group) =>
  simulatePatients(group.n, group.hazardRate, group.dropoutProb),
);
const curves = groups.map((group, i) => ({
  ...group,
  ...kaplanMeier(patientSets[i]),
}));
const logRank = logRankTest(patientSets[0], patientSets[1]);

// --- SVG mount ----------------------------------------------------------------
const svg = d3
  .select("#container")
  .append("svg")
  .attr("width", width)
  .attr("height", height);
const g = svg
  .append("g")
  .attr("transform", `translate(${margin.left},${margin.top})`);

// --- Scales ---------------------------------------------------------------
const x = d3.scaleLinear().domain([0, FOLLOW_UP_MONTHS]).range([0, iw]);
const y = d3.scaleLinear().domain([0, 1]).range([ih, 0]);

// --- Gridlines (y-axis only) -----------------------------------------------
g.append("g")
  .selectAll("line")
  .data(y.ticks(5))
  .join("line")
  .attr("x1", 0)
  .attr("x2", iw)
  .attr("y1", (d) => y(d))
  .attr("y2", (d) => y(d))
  .attr("stroke", t.grid)
  .attr("stroke-width", 1);

// --- 95% confidence bands ----------------------------------------------------
const band = d3
  .area()
  .x((d) => x(d.time))
  .y0((d) => y(d.lower))
  .y1((d) => y(d.upper))
  .curve(d3.curveStepAfter);

curves.forEach((c, i) => {
  g.append("path")
    .datum(c.steps)
    .attr("d", band)
    .attr("fill", t.palette[i])
    .attr("fill-opacity", 0.12)
    .attr("stroke", t.palette[i])
    .attr("stroke-width", 1)
    .attr("stroke-opacity", 0.45);
});

// --- Survival step curves -----------------------------------------------------
const stepLine = d3
  .line()
  .x((d) => x(d.time))
  .y((d) => y(d.survival))
  .curve(d3.curveStepAfter);

curves.forEach((c, i) => {
  g.append("path")
    .datum(c.steps)
    .attr("d", stepLine)
    .attr("fill", "none")
    .attr("stroke", t.palette[i])
    .attr("stroke-width", 3.5);
});

// --- Censoring tick marks -------------------------------------------------
const tickHalf = 10;
curves.forEach((c, i) => {
  g.append("g")
    .selectAll("line")
    .data(c.censored)
    .join("line")
    .attr("x1", (d) => x(d.time))
    .attr("x2", (d) => x(d.time))
    .attr("y1", (d) => y(d.survival) - tickHalf)
    .attr("y2", (d) => y(d.survival) + tickHalf)
    .attr("stroke", t.palette[i])
    .attr("stroke-width", 2.75);
});

// --- Median survival annotations --------------------------------------------
const y50 = y(0.5);
g.append("line")
  .attr("x1", 0)
  .attr("x2", iw)
  .attr("y1", y50)
  .attr("y2", y50)
  .attr("stroke", t.inkSoft)
  .attr("stroke-width", 1.5)
  .attr("stroke-dasharray", "6,5");

curves.forEach((c, i) => {
  const medianTime = medianSurvivalTime(c.steps);
  if (medianTime == null) return;
  const mx = x(medianTime);
  g.append("line")
    .attr("x1", mx)
    .attr("x2", mx)
    .attr("y1", y50)
    .attr("y2", ih)
    .attr("stroke", t.palette[i])
    .attr("stroke-width", 1.5)
    .attr("stroke-dasharray", "6,5");
  g.append("text")
    .attr("x", mx)
    .attr("y", y50 - 20)
    .attr("text-anchor", "middle")
    .attr("fill", t.palette[i])
    .style("font-size", "15px")
    .style("font-weight", "600")
    .style("paint-order", "stroke")
    .attr("stroke", t.pageBg)
    .attr("stroke-width", 5)
    .attr("stroke-linejoin", "round")
    .text(`Median: ${medianTime.toFixed(1)}mo`);
});

// --- Axes -------------------------------------------------------------------
const xAxis = g
  .append("g")
  .attr("transform", `translate(0,${ih})`)
  .call(d3.axisBottom(x).ticks(9).tickSize(0).tickPadding(14));
const yAxis = g
  .append("g")
  .call(
    d3
      .axisLeft(y)
      .ticks(5)
      .tickFormat(d3.format(".0%"))
      .tickSize(0)
      .tickPadding(14),
  );

for (const axisG of [xAxis, yAxis]) {
  axisG.selectAll("text").attr("fill", t.inkSoft).style("font-size", "16px");
}
xAxis.select(".domain").attr("stroke", t.inkSoft);
yAxis.select(".domain").attr("stroke", "none");

// --- Axis labels --------------------------------------------------------------
g.append("text")
  .attr("x", iw / 2)
  .attr("y", ih + 60)
  .attr("text-anchor", "middle")
  .attr("fill", t.ink)
  .style("font-size", "20px")
  .text("Time Since Enrollment (months)");

g.append("text")
  .attr("transform", "rotate(-90)")
  .attr("x", -ih / 2)
  .attr("y", -72)
  .attr("text-anchor", "middle")
  .attr("fill", t.ink)
  .style("font-size", "20px")
  .text("Survival Probability");

// --- Legend -----------------------------------------------------------------
const legend = g.append("g").attr("transform", `translate(${iw - 300}, 6)`);
curves.forEach((c, i) => {
  const row = legend.append("g").attr("transform", `translate(0, ${i * 34})`);
  row
    .append("line")
    .attr("x1", 0)
    .attr("x2", 28)
    .attr("y1", 0)
    .attr("y2", 0)
    .attr("stroke", t.palette[i])
    .attr("stroke-width", 4);
  row
    .append("text")
    .attr("x", 38)
    .attr("y", 5)
    .attr("fill", t.ink)
    .style("font-size", "16px")
    .text(`${c.name} (n=${c.n})`);
});

const pValueText =
  logRank.pValue < 0.001 ? "p < 0.001" : `p = ${logRank.pValue.toFixed(3)}`;
legend
  .append("text")
  .attr("x", 0)
  .attr("y", groups.length * 34 + 18)
  .attr("fill", t.inkSoft)
  .style("font-size", "14px")
  .style("font-style", "italic")
  .text(`Log-rank test: ${pValueText}`);

// --- Title --------------------------------------------------------------------
svg
  .append("text")
  .attr("x", width / 2)
  .attr("y", 50)
  .attr("text-anchor", "middle")
  .attr("fill", t.ink)
  .style("font-size", "24px")
  .style("font-weight", "600")
  .text("survival-kaplan-meier · javascript · d3 · anyplot.ai");
Runnable source as JSON, for any HTTP client: https://api.anyplot.ai/specs/survival-kaplan-meier/d3/code. Any spec id and library id listed in llms-full.txt fit the same URL shape; every URL below is complete and callable.
{
  "spec_id": "survival-kaplan-meier",
  "language": "javascript",
  "library": "d3",
  "page": "https://anyplot.ai/survival-kaplan-meier/javascript/d3",
  "hub": "https://anyplot.ai/survival-kaplan-meier",
  "code_json": "https://api.anyplot.ai/specs/survival-kaplan-meier/d3/code",
  "spec_json": "https://api.anyplot.ai/specs/survival-kaplan-meier",
  "render_light_png": "https://storage.googleapis.com/anyplot-images/plots/survival-kaplan-meier/javascript/d3/plot-light.png",
  "render_dark_png": "https://storage.googleapis.com/anyplot-images/plots/survival-kaplan-meier/javascript/d3/plot-dark.png",
  "interactive_light_html": "https://storage.googleapis.com/anyplot-images/plots/survival-kaplan-meier/javascript/d3/plot-light.html",
  "interactive_dark_html": "https://storage.googleapis.com/anyplot-images/plots/survival-kaplan-meier/javascript/d3/plot-dark.html",
  "quality_score": 93.0,
  "license": "MIT",
  "guide": "https://anyplot.ai/llms.txt"
}
Part of Kaplan-Meier Survival Plot on anyplot.ai.