The same plot in 14 other libraries — JavaScript: Chart.js, D3.js, Highcharts, MUI X Charts; Python: Altair, Bokeh, lets-plot, Matplotlib, Plotly, plotnine, Pygal, Seaborn; R: ggplot2; Julia: Makie.jl. Compare all 15 side by side: Kaplan-Meier Survival Plot in Python, R, Julia and JavaScript.
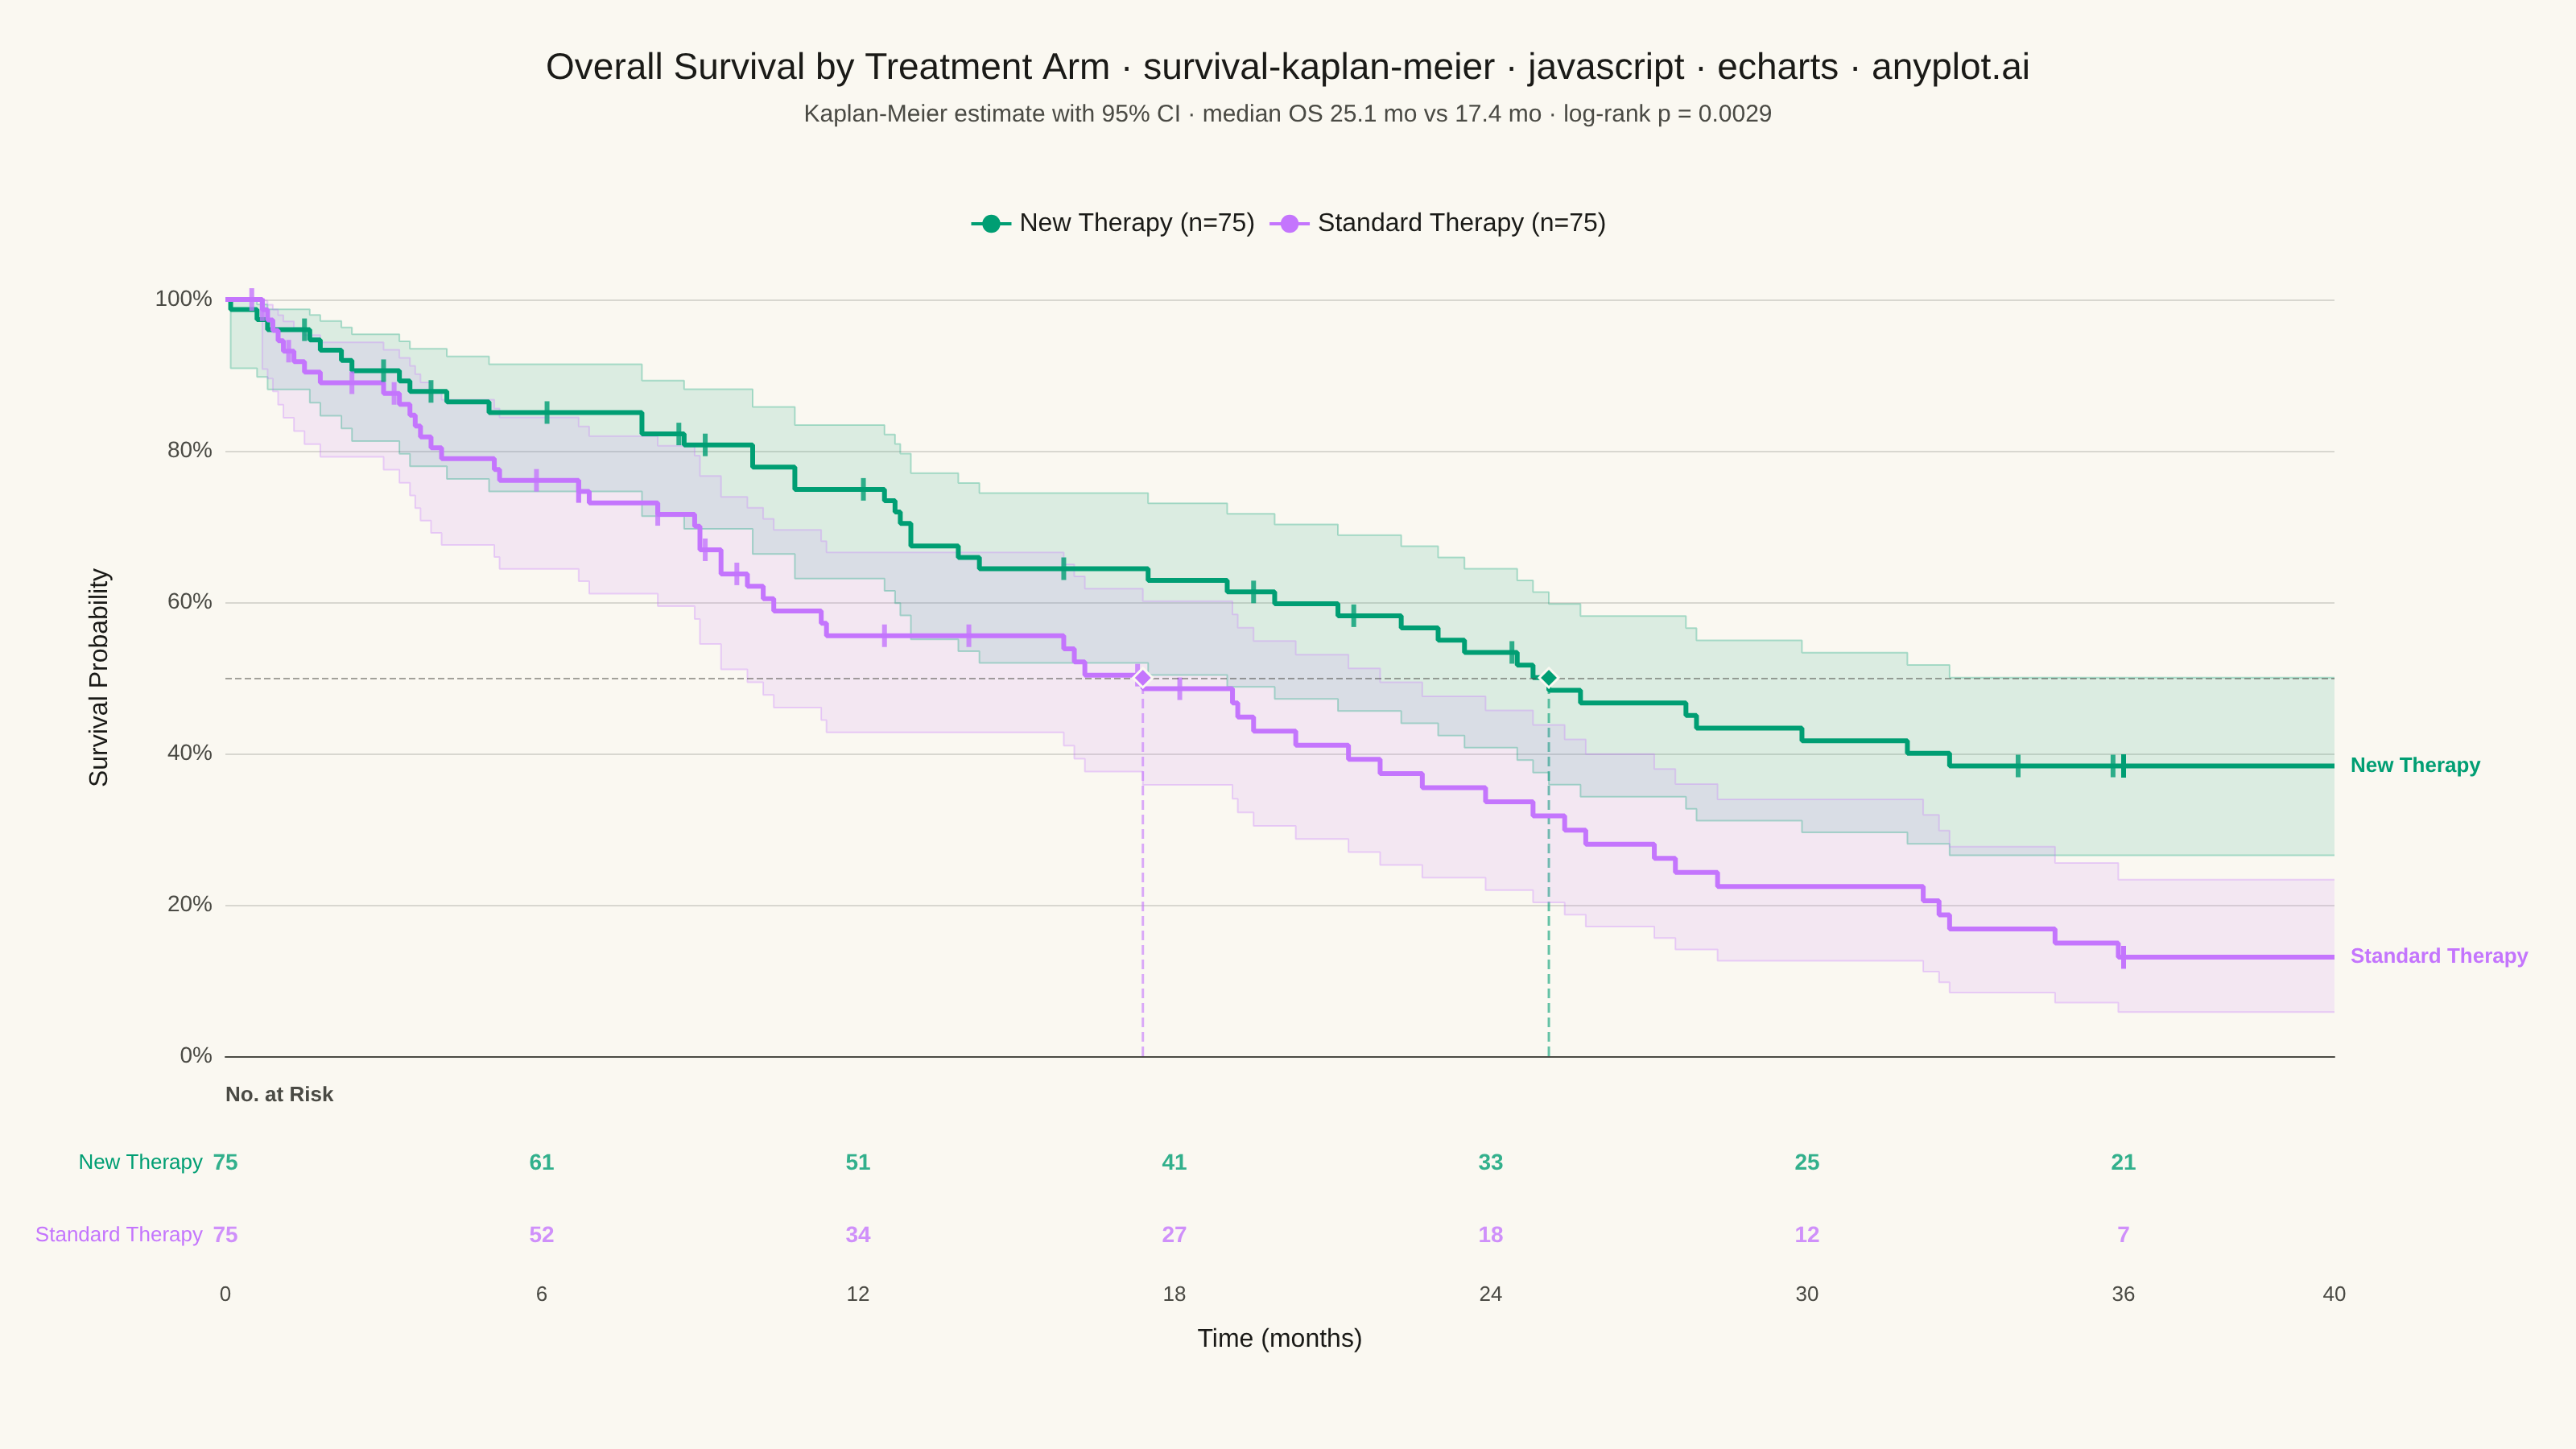
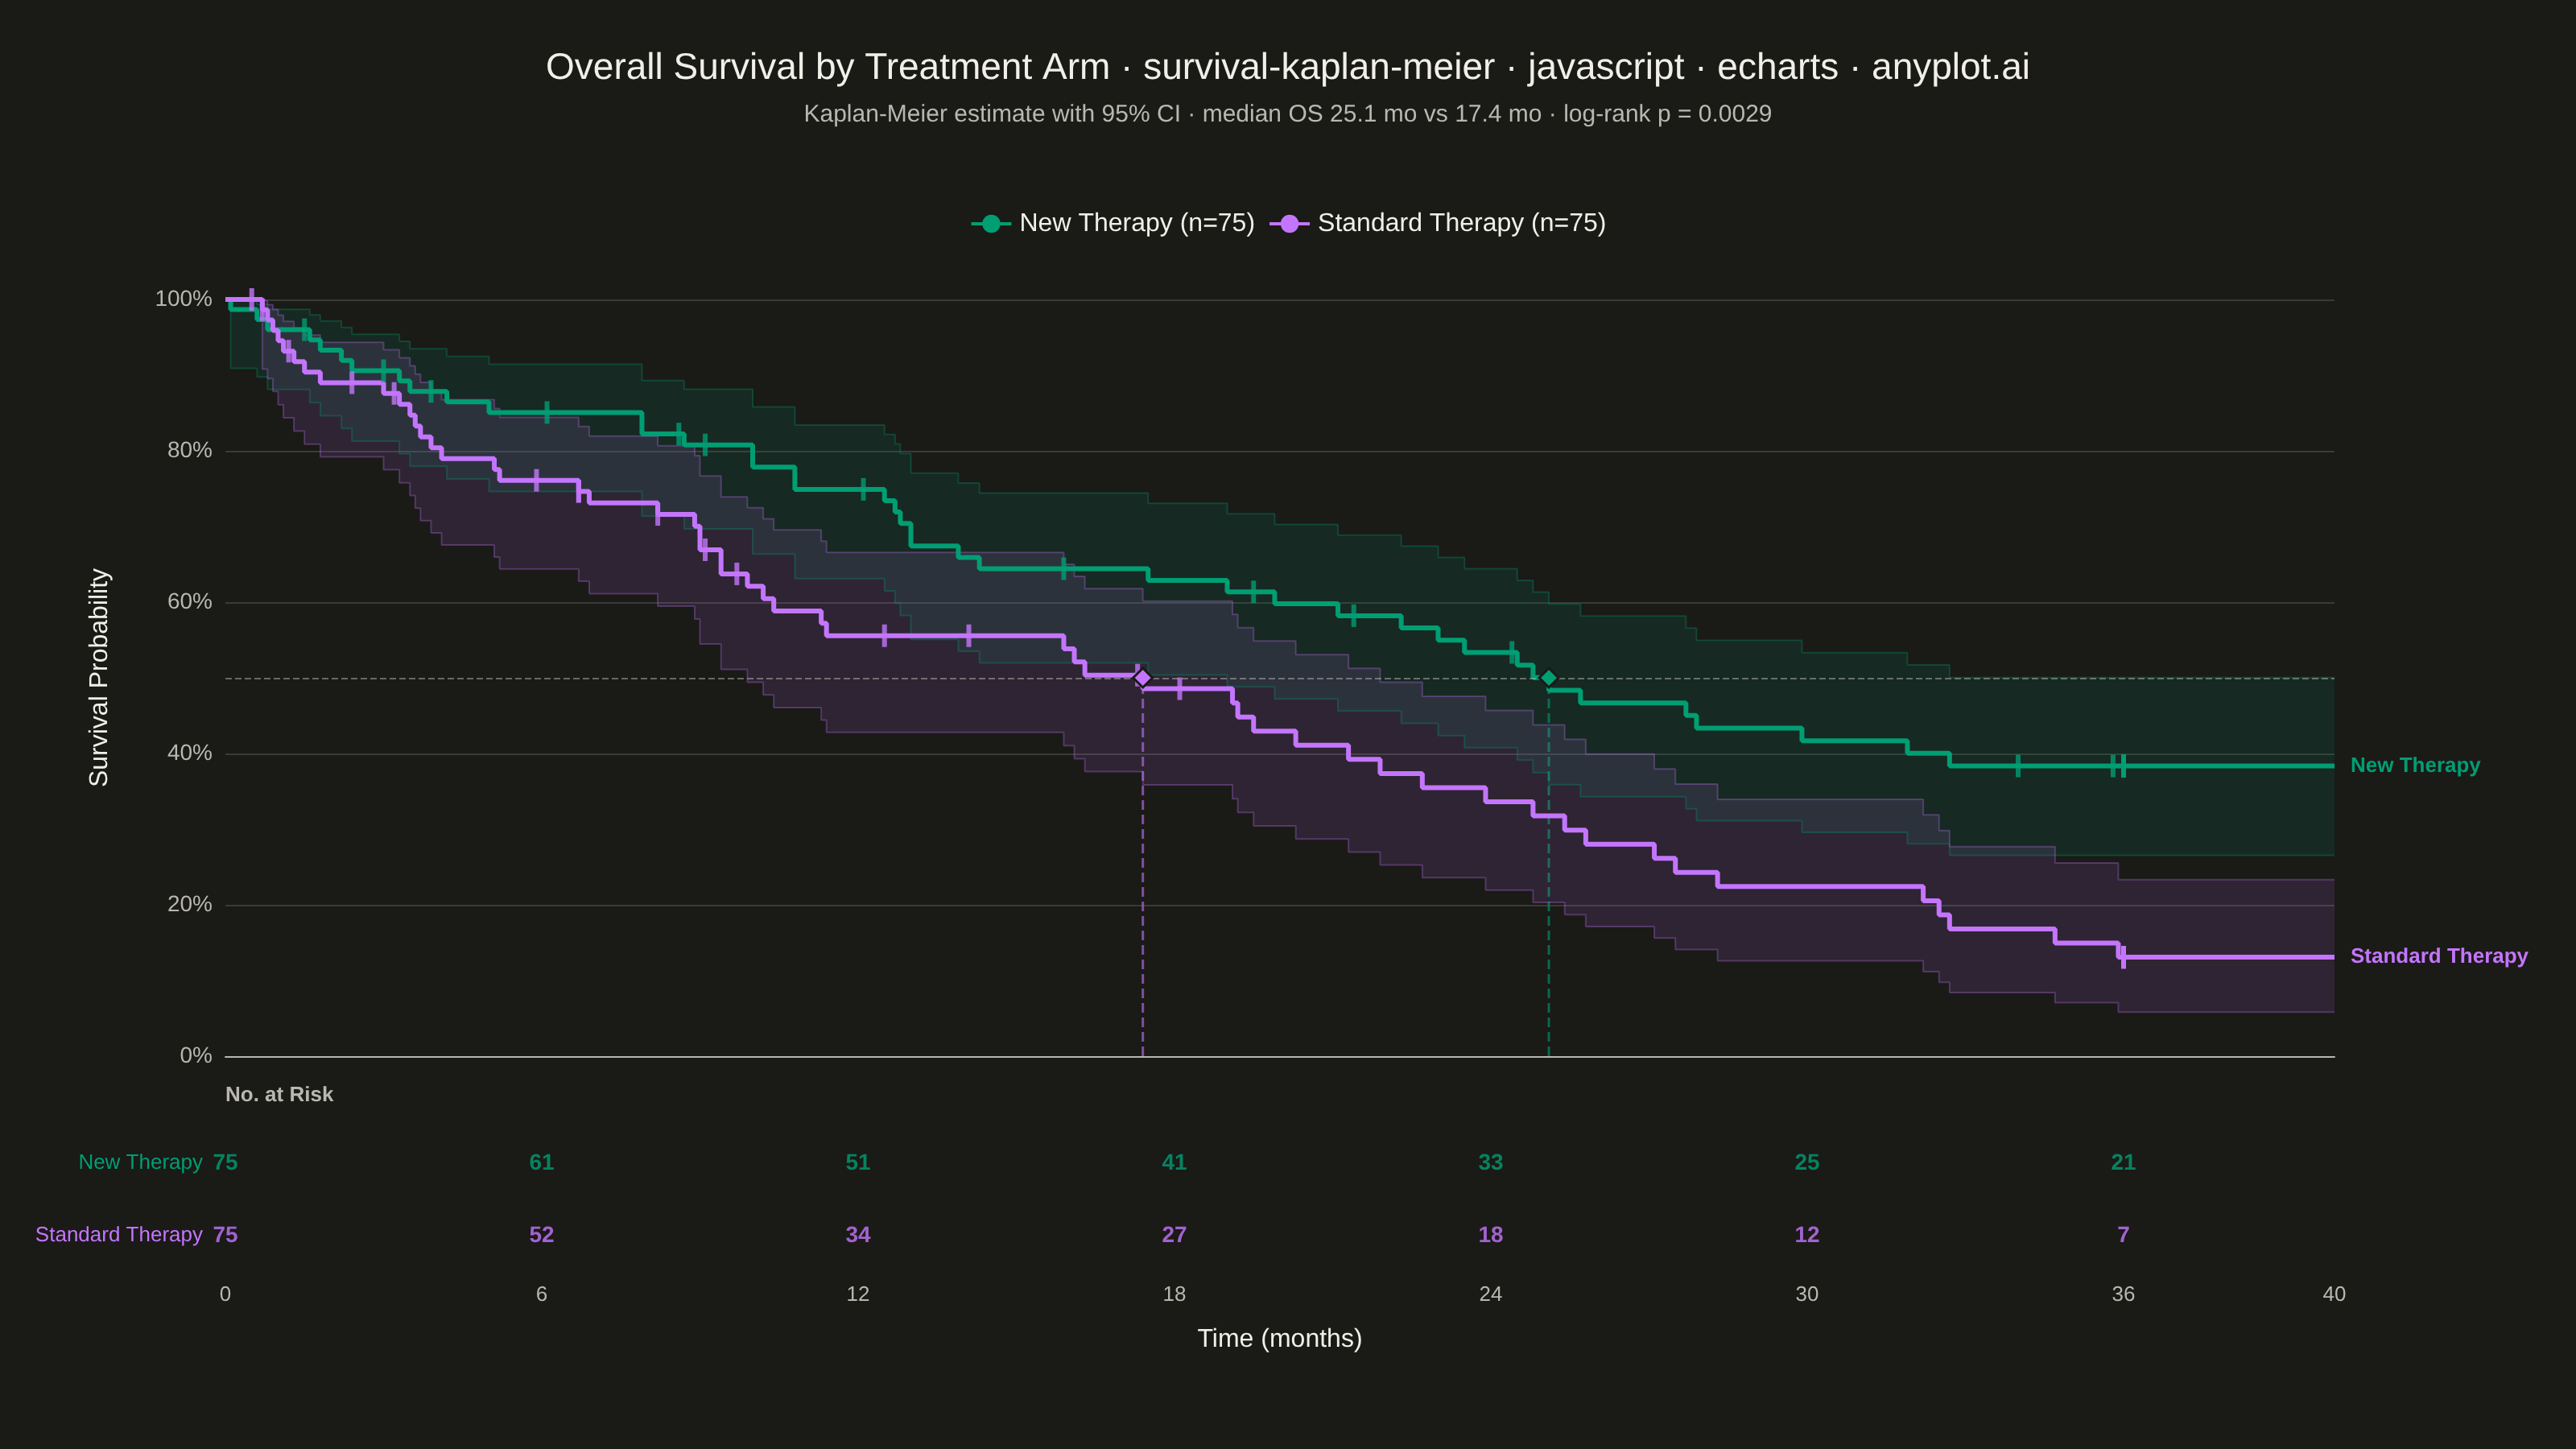
A Kaplan-Meier survival plot visualizes the probability of survival (or event-free time) over a time period using a step function. It is the standard method for estimating survival functions from time-to-event data, handling censored observations where the event has not yet occurred. The plot shows how survival probability decreases over time, with optional confidence intervals and comparison between groups.
// anyplot.ai
// survival-kaplan-meier: Kaplan-Meier Survival Plot
// Library: echarts 6.1.0 | JavaScript 22.23.2
// Quality: 95/100 | Created: 2026-09-09

const t = window.ANYPLOT_TOKENS;

// --- Data (in-memory, deterministic) ----------------------------------------
// Simulated two-arm oncology trial: overall survival, months since enrollment.
// Both arms share an administrative follow-up cutoff plus independent random
// loss-to-follow-up, so each arm carries its own realistic censoring pattern.
const lcgFactory = (seed) => {
  let state = seed;
  return () => {
    state = (state * 1103515245 + 12345) % 2147483648;
    return state / 2147483648;
  };
};
const rand = lcgFactory(42);
const exponential = (rate) => -Math.log(1 - rand()) / rate;

const FOLLOW_UP_CUTOFF = 36;
const DROPOUT_RATE = 1 / 130;

const generateArm = (n, medianMonths) => {
  const eventRate = Math.log(2) / medianMonths;
  const observations = [];
  for (let i = 0; i < n; i++) {
    const trueTime = exponential(eventRate);
    const dropoutTime = exponential(DROPOUT_RATE);
    const time = Math.min(trueTime, dropoutTime, FOLLOW_UP_CUTOFF);
    const event = trueTime <= dropoutTime && trueTime <= FOLLOW_UP_CUTOFF ? 1 : 0;
    observations.push({ time: Math.round(time * 10) / 10, event });
  }
  return observations;
};

const newTherapy = generateArm(75, 22);
const standardTherapy = generateArm(75, 13);

// --- Kaplan-Meier estimator --------------------------------------------------
// Greenwood's formula (log-log transform) gives the 95% CI; the transform
// keeps bounds inside [0, 1] without manual clipping.
const kaplanMeier = (observations) => {
  const sorted = [...observations].sort((a, b) => a.time - b.time);
  const eventTimes = [...new Set(sorted.filter((o) => o.event === 1).map((o) => o.time))].sort((a, b) => a - b);
  let survival = 1;
  let greenwoodSum = 0;
  const steps = [{ time: 0, survival: 1, lower: 1, upper: 1 }];
  for (const time of eventTimes) {
    const atRisk = sorted.filter((o) => o.time >= time).length;
    const deaths = sorted.filter((o) => o.time === time && o.event === 1).length;
    survival *= 1 - deaths / atRisk;
    greenwoodSum += deaths / (atRisk * (atRisk - deaths || 1));
    let lower = survival;
    let upper = survival;
    if (survival > 0 && survival < 1 && greenwoodSum > 0) {
      const logLogVar = greenwoodSum / Math.log(survival) ** 2;
      const z = 1.96 * Math.sqrt(logLogVar);
      lower = survival ** Math.exp(z);
      upper = survival ** Math.exp(-z);
    }
    steps.push({ time, survival, lower, upper });
  }
  const censorTimes = sorted.filter((o) => o.event === 0).map((o) => o.time);
  return { steps, censorTimes, n: sorted.length };
};

const survivalAt = (steps, time) => {
  let value = 1;
  for (const step of steps) {
    if (step.time <= time) value = step.survival;
    else break;
  }
  return value;
};

const medianSurvival = (steps) => {
  const hit = steps.find((s) => s.survival <= 0.5);
  return hit ? hit.time : null;
};

const atRiskCounts = (observations, times) => times.map((time) => observations.filter((o) => o.time >= time).length);

const kmNew = kaplanMeier(newTherapy);
const kmStandard = kaplanMeier(standardTherapy);
const medianNew = medianSurvival(kmNew.steps);
const medianStandard = medianSurvival(kmStandard.steps);

// --- Log-rank test (chi-square, 1 df) ----------------------------------------
const logRankPValue = (armA, armB) => {
  const eventTimes = [...new Set([...armA, ...armB].filter((o) => o.event === 1).map((o) => o.time))].sort(
    (a, b) => a - b
  );
  let observedA = 0;
  let expectedA = 0;
  let variance = 0;
  for (const time of eventTimes) {
    const atRiskA = armA.filter((o) => o.time >= time).length;
    const atRiskB = armB.filter((o) => o.time >= time).length;
    const n = atRiskA + atRiskB;
    if (n <= 1) continue;
    const deathsA = armA.filter((o) => o.time === time && o.event === 1).length;
    const deathsB = armB.filter((o) => o.time === time && o.event === 1).length;
    const deaths = deathsA + deathsB;
    observedA += deathsA;
    expectedA += (deaths * atRiskA) / n;
    variance += deaths * (atRiskA / n) * (atRiskB / n) * ((n - deaths) / (n - 1));
  }
  const chiSquare = variance > 0 ? (observedA - expectedA) ** 2 / variance : 0;
  // Abramowitz & Stegun 7.1.26 erf approximation; chi-square(1 df) = z^2, so
  // p = erfc(sqrt(chiSquare / 2)).
  const erf = (x) => {
    const sign = x < 0 ? -1 : 1;
    const ax = Math.abs(x);
    const a1 = 0.254829592;
    const a2 = -0.284496736;
    const a3 = 1.421413741;
    const a4 = -1.453152027;
    const a5 = 1.061405429;
    const p = 0.3275911;
    const u = 1 / (1 + p * ax);
    const y = 1 - (((((a5 * u + a4) * u + a3) * u + a2) * u + a1) * u) * Math.exp(-ax * ax);
    return sign * y;
  };
  return 1 - erf(Math.sqrt(chiSquare / 2));
};

const pValue = logRankPValue(newTherapy, standardTherapy);

// --- Series construction ------------------------------------------------------
const AXIS_MAX = Math.ceil(Math.max(...kmNew.steps.map((s) => s.time), ...kmStandard.steps.map((s) => s.time)) / 5) * 5;

const extendToAxisMax = (steps) => {
  const last = steps[steps.length - 1];
  return last.time < AXIS_MAX ? [...steps, { ...last, time: AXIS_MAX }] : steps;
};

const colorNew = t.palette[0];
const colorStandard = t.palette[1];

const buildArmSeries = (label, km, color, medianTime) => {
  const extended = extendToAxisMax(km.steps);
  const curveData = extended.map((s) => [s.time, s.survival]);
  const lowerData = extended.map((s) => [s.time, s.lower]);
  const widthData = extended.map((s) => [s.time, s.upper - s.lower]);
  const censorData = km.censorTimes.map((time) => [time, survivalAt(km.steps, time)]);
  const stackKey = `ci-${label}`;
  return [
    {
      type: "line",
      stack: stackKey,
      step: "end",
      data: lowerData,
      lineStyle: { opacity: 0.3, width: 1, color },
      symbol: "none",
      silent: true,
      tooltip: { show: false },
      z: 2,
    },
    {
      type: "line",
      stack: stackKey,
      step: "end",
      data: widthData,
      lineStyle: { opacity: 0.3, width: 1, color },
      symbol: "none",
      areaStyle: { color, opacity: 0.12 },
      silent: true,
      tooltip: { show: false },
      z: 2,
    },
    {
      name: `${label} (n=${km.n})`,
      type: "line",
      step: "end",
      data: curveData,
      symbol: "none",
      lineStyle: { width: 3, color },
      itemStyle: { color },
      endLabel: { show: true, formatter: label, color, fontSize: 13, fontWeight: 600, distance: 10 },
      clip: false,
      z: 3,
      ...(medianTime == null
        ? {}
        : {
            markPoint: {
              symbol: "diamond",
              symbolSize: 12,
              itemStyle: { color, borderColor: t.pageBg, borderWidth: 1.5 },
              label: { show: false },
              silent: true,
              tooltip: { show: false },
              data: [{ coord: [medianTime, 0.5], name: "median" }],
            },
          }),
    },
    {
      name: `${label} censored`,
      type: "scatter",
      data: censorData,
      symbol: "rect",
      symbolSize: [3, 14],
      itemStyle: { color },
      silent: true,
      tooltip: { show: false },
      z: 4,
    },
  ];
};

const medianDropLine = (medianTime, color) =>
  medianTime == null
    ? []
    : [
        {
          type: "line",
          data: [
            [medianTime, 0],
            [medianTime, 0.5],
          ],
          lineStyle: { color, type: "dashed", width: 1.5, opacity: 0.6 },
          symbol: "none",
          silent: true,
          tooltip: { show: false },
          z: 1,
        },
      ];

// --- At-risk table (below the plot, own grid sharing the time scale) --------
const AT_RISK_STEP = 6;
const AT_RISK_TIMES = [];
for (let time = 0; time <= AXIS_MAX; time += AT_RISK_STEP) AT_RISK_TIMES.push(time);
const atRiskNewCounts = atRiskCounts(newTherapy, AT_RISK_TIMES);
const atRiskStandardCounts = atRiskCounts(standardTherapy, AT_RISK_TIMES);

const atRiskRowSeries = (rowIndex, counts, color) => ({
  type: "scatter",
  xAxisIndex: 1,
  yAxisIndex: 1,
  data: AT_RISK_TIMES.map((time, i) => [time, rowIndex, counts[i]]),
  encode: { x: 0, y: 1, label: 2 },
  symbolSize: 0,
  label: { show: true, formatter: (p) => p.value[2], color, fontSize: 14, fontWeight: 600 },
  silent: true,
  tooltip: { show: false },
});

const series = [
  ...buildArmSeries("New Therapy", kmNew, colorNew, medianNew),
  ...buildArmSeries("Standard Therapy", kmStandard, colorStandard, medianStandard),
  ...medianDropLine(medianNew, colorNew),
  ...medianDropLine(medianStandard, colorStandard),
  atRiskRowSeries(0, atRiskNewCounts, colorNew),
  atRiskRowSeries(1, atRiskStandardCounts, colorStandard),
];

// 50%-survival reference line, attached to the first real curve series.
series[2].markLine = {
  silent: true,
  symbol: "none",
  lineStyle: { type: "dashed", color: t.inkSoft, opacity: 0.5, width: 1 },
  label: { show: false },
  data: [{ yAxis: 0.5 }],
};

// --- Title sizing (scales down once the string runs past the 78-char baseline) ---
const TITLE = "Overall Survival by Treatment Arm · survival-kaplan-meier · javascript · echarts · anyplot.ai";
const titleFontSize = Math.max(18, Math.round(28 * Math.min(1, 78 / TITLE.length)));
const medianLabel = (m) => (m == null ? "not reached" : `${m.toFixed(1)} mo`);
const pLabel = pValue < 0.0001 ? "< 0.0001" : pValue.toFixed(4);
const SUBTITLE = `Kaplan-Meier estimate with 95% CI · median OS ${medianLabel(medianNew)} vs ${medianLabel(medianStandard)} · log-rank p = ${pLabel}`;

// --- Init ---------------------------------------------------------------
const chart = echarts.init(document.getElementById("container"));

// --- Option ---------------------------------------------------------------
chart.setOption({
  animation: false,
  color: t.palette,
  backgroundColor: "transparent",
  title: {
    text: TITLE,
    subtext: SUBTITLE,
    left: "center",
    top: 26,
    textStyle: { color: t.ink, fontSize: titleFontSize, fontWeight: 500 },
    subtextStyle: { color: t.inkSoft, fontSize: 15 },
  },
  tooltip: { trigger: "axis" },
  legend: {
    data: [`New Therapy (n=${kmNew.n})`, `Standard Therapy (n=${kmStandard.n})`],
    top: 126,
    textStyle: { color: t.ink, fontSize: 16 },
  },
  graphic: [
    {
      type: "text",
      left: 140,
      top: 674,
      style: { text: "No. at Risk", fill: t.inkSoft, fontSize: 13, fontWeight: 600 },
    },
  ],
  grid: [
    { left: 140, right: 150, top: 186, height: 470 },
    { left: 140, right: 150, top: 700, height: 90 },
  ],
  xAxis: [
    {
      type: "value",
      gridIndex: 0,
      min: 0,
      max: AXIS_MAX,
      axisLabel: { show: false },
      axisLine: { lineStyle: { color: t.inkSoft } },
      axisTick: { show: false },
      splitLine: { show: false },
    },
    {
      type: "value",
      gridIndex: 1,
      name: "Time (months)",
      nameLocation: "middle",
      nameGap: 34,
      nameTextStyle: { color: t.ink, fontSize: 16 },
      min: 0,
      max: AXIS_MAX,
      interval: AT_RISK_STEP,
      axisLabel: { color: t.inkSoft, fontSize: 13 },
      axisLine: { lineStyle: { color: t.inkSoft } },
      axisTick: { show: false },
      splitLine: { show: false },
    },
  ],
  yAxis: [
    {
      type: "value",
      gridIndex: 0,
      name: "Survival Probability",
      nameLocation: "middle",
      nameGap: 70,
      nameTextStyle: { color: t.ink, fontSize: 16 },
      min: 0,
      max: 1,
      axisLabel: { color: t.inkSoft, fontSize: 14, formatter: (value) => `${Math.round(value * 100)}%` },
      axisLine: { show: false },
      axisTick: { show: false },
      splitLine: { lineStyle: { color: t.grid } },
    },
    {
      type: "category",
      gridIndex: 1,
      data: ["New Therapy", "Standard Therapy"],
      inverse: true,
      axisLabel: {
        color: (value, index) => (index === 0 ? colorNew : colorStandard),
        fontSize: 13,
        fontWeight: 500,
        margin: 14,
      },
      axisLine: { show: false },
      axisTick: { show: false },
      splitLine: { show: false },
    },
  ],
  series,
});
Runnable source as JSON, for any HTTP client: https://api.anyplot.ai/specs/survival-kaplan-meier/echarts/code. Any spec id and library id listed in llms-full.txt fit the same URL shape; every URL below is complete and callable.
{
  "spec_id": "survival-kaplan-meier",
  "language": "javascript",
  "library": "echarts",
  "page": "https://anyplot.ai/survival-kaplan-meier/javascript/echarts",
  "hub": "https://anyplot.ai/survival-kaplan-meier",
  "code_json": "https://api.anyplot.ai/specs/survival-kaplan-meier/echarts/code",
  "spec_json": "https://api.anyplot.ai/specs/survival-kaplan-meier",
  "render_light_png": "https://storage.googleapis.com/anyplot-images/plots/survival-kaplan-meier/javascript/echarts/plot-light.png",
  "render_dark_png": "https://storage.googleapis.com/anyplot-images/plots/survival-kaplan-meier/javascript/echarts/plot-dark.png",
  "interactive_light_html": "https://storage.googleapis.com/anyplot-images/plots/survival-kaplan-meier/javascript/echarts/plot-light.html",
  "interactive_dark_html": "https://storage.googleapis.com/anyplot-images/plots/survival-kaplan-meier/javascript/echarts/plot-dark.html",
  "quality_score": 95.0,
  "license": "MIT",
  "guide": "https://anyplot.ai/llms.txt"
}
Part of Kaplan-Meier Survival Plot on anyplot.ai.