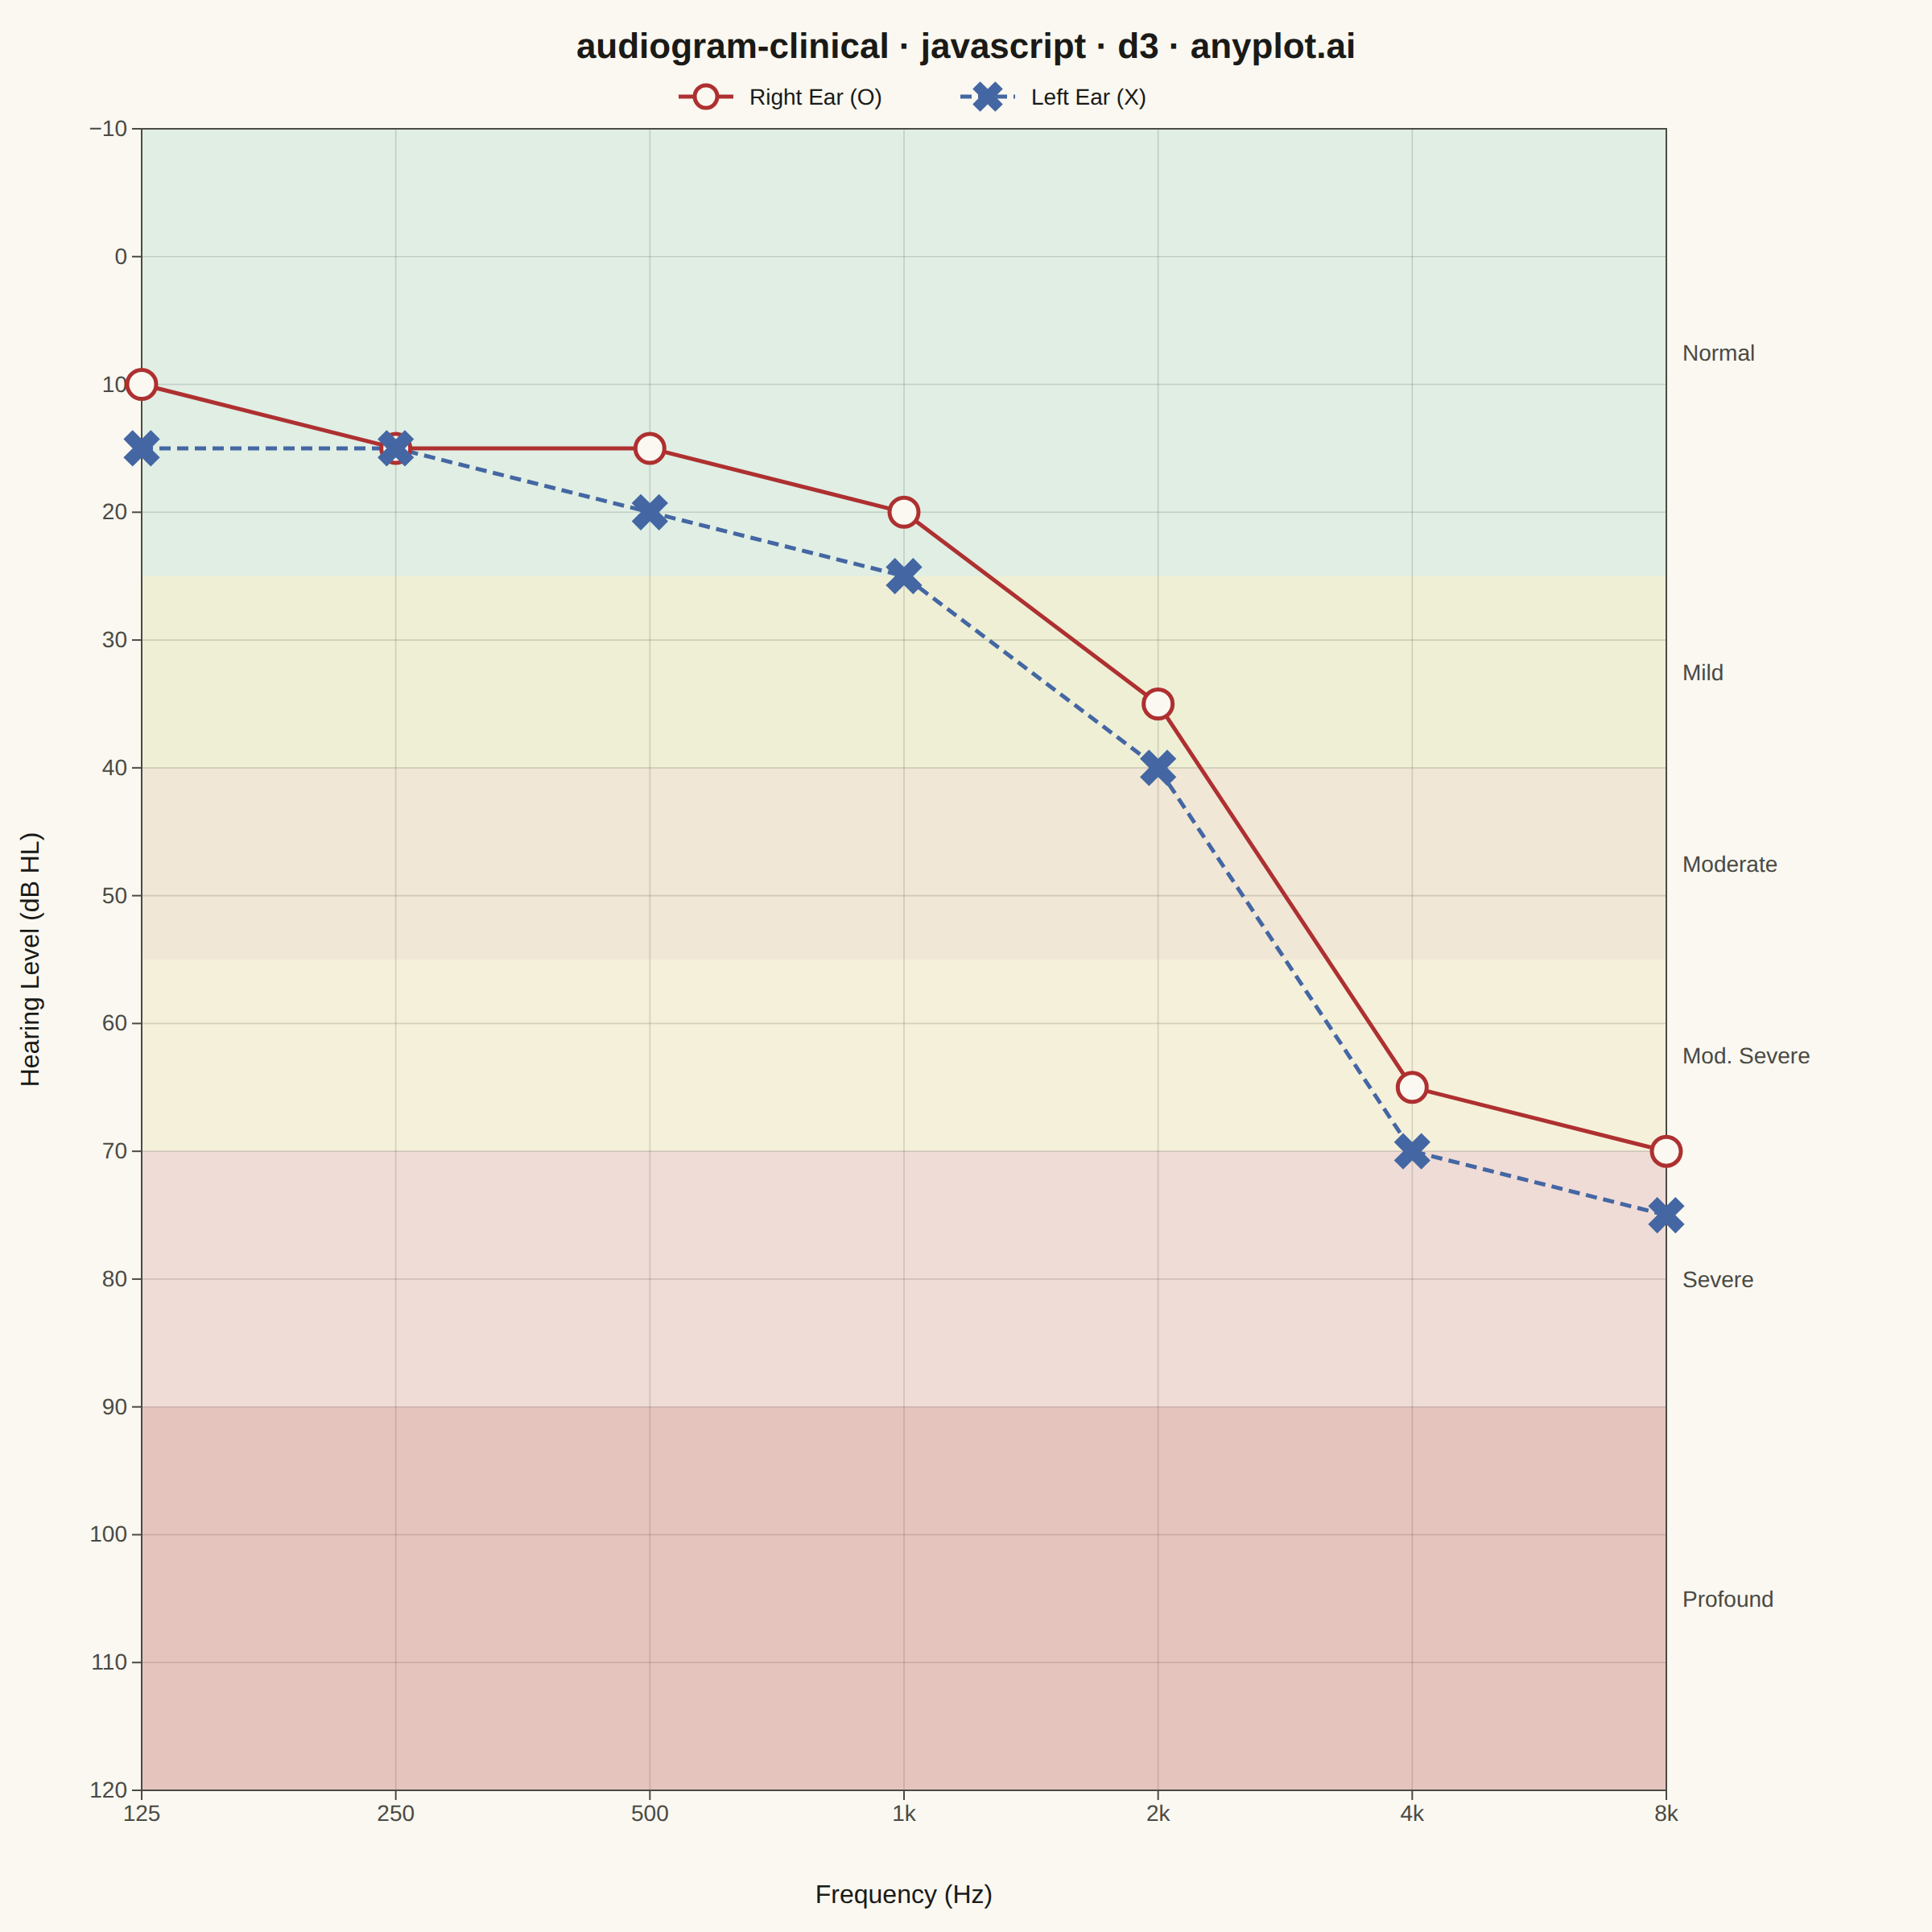
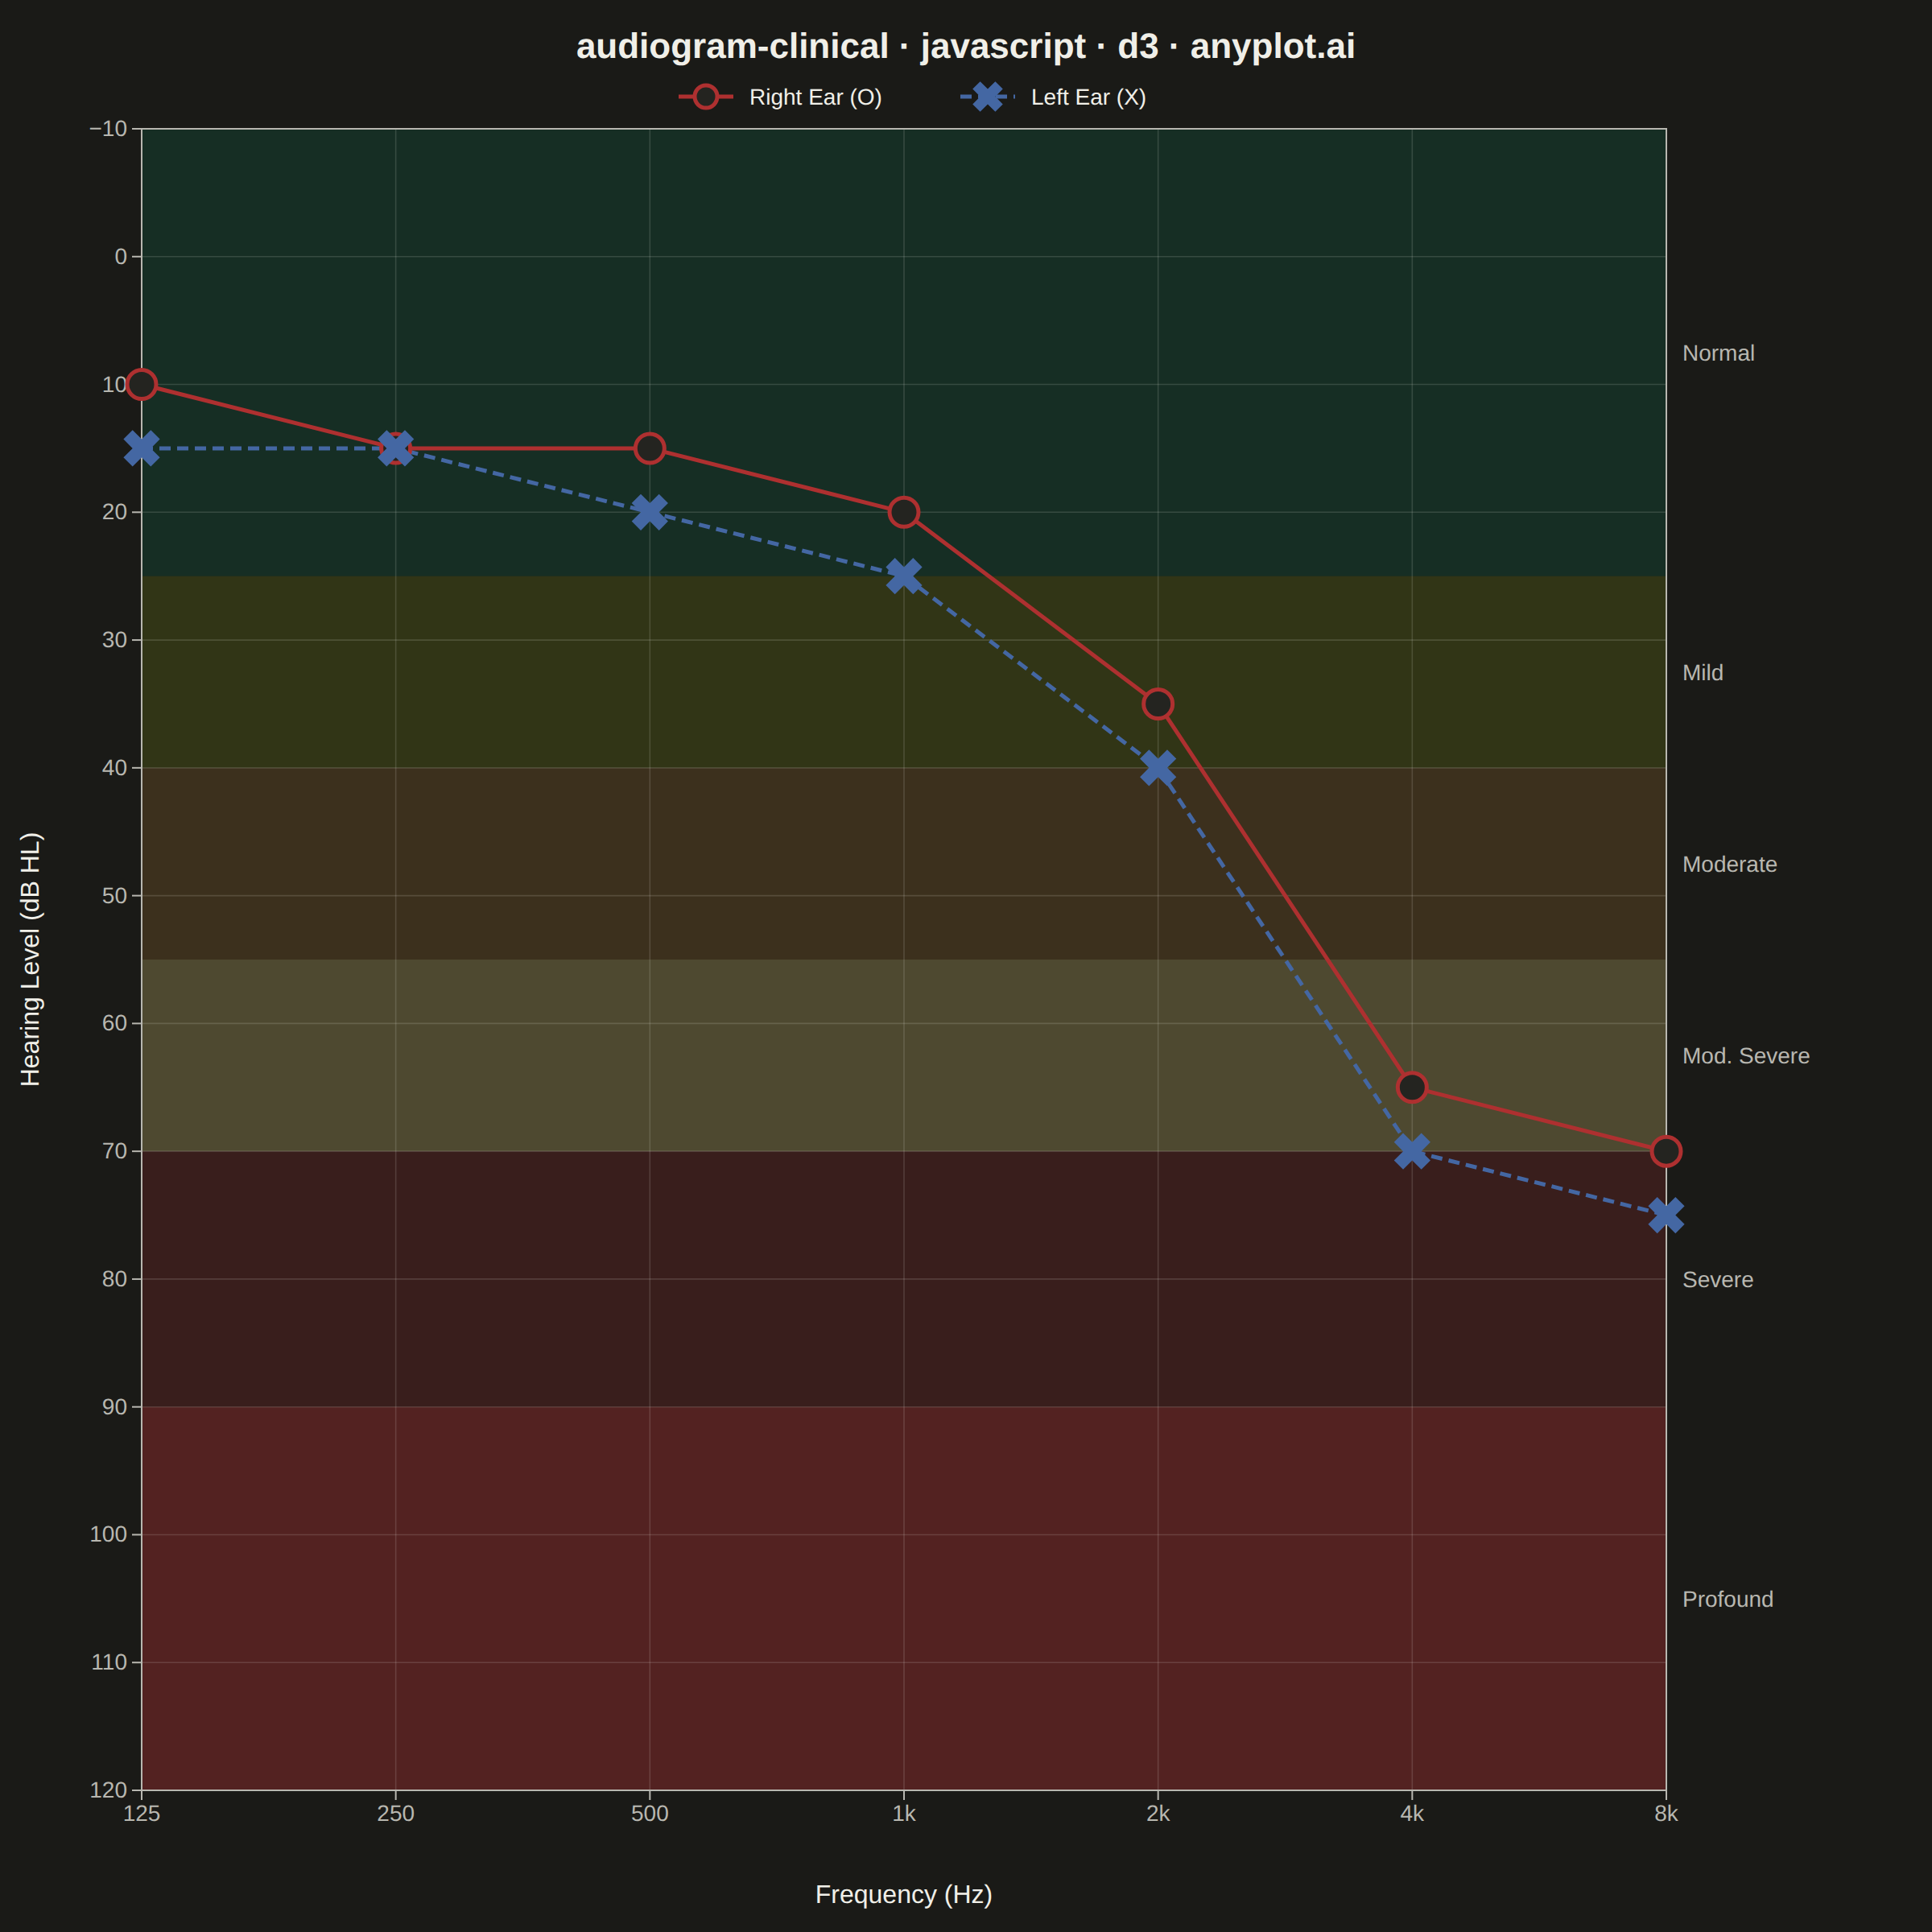
A standardized clinical audiogram that displays hearing test results, plotting hearing threshold (dB HL) against test frequency for each ear. The y-axis is inverted so that 0 dB HL (best hearing) sits at the top and increasing hearing loss extends downward, while the x-axis is logarithmic spanning the standard audiometric frequencies (125 Hz to 8 kHz). Thresholds are marked with the conventional symbols — a circle (O) for the right ear in red and a cross (X) for the left ear in blue — and connected per ear, with shaded horizontal bands indicating severity of hearing loss (normal, mild, moderate, severe, profound).
// anyplot.ai
// audiogram-clinical: Clinical Audiogram
// Library: d3 7.9.0 | JavaScript 22.22.3
// Quality: 93/100 | Created: 2026-06-15

//# anyplot-orientation: square

const t = window.ANYPLOT_TOKENS;
const { width, height } = window.ANYPLOT_SIZE;
const margin = { top: 80, right: 165, bottom: 88, left: 88 };
const iw = width  - margin.left - margin.right;
const ih = height - margin.top  - margin.bottom;

// --- Data: noise-induced high-frequency sensorineural hearing loss -----------
const frequencies = [125, 250, 500, 1000, 2000, 4000, 8000];
const freqLabel   = { 125: "125", 250: "250", 500: "500", 1000: "1k",
                      2000: "2k", 4000: "4k", 8000: "8k" };

// Right ear: gradual sensorineural notch peaking at 4 kHz (O markers, red)
const rightEar = [
  { freq: 125, db: 10 }, { freq: 250, db: 15 }, { freq: 500, db: 15 },
  { freq: 1000, db: 20 }, { freq: 2000, db: 35 }, { freq: 4000, db: 65 },
  { freq: 8000, db: 70 },
];

// Left ear: similar sensorineural pattern, slightly worse (X markers, blue)
const leftEar = [
  { freq: 125, db: 15 }, { freq: 250, db: 15 }, { freq: 500, db: 20 },
  { freq: 1000, db: 25 }, { freq: 2000, db: 40 }, { freq: 4000, db: 70 },
  { freq: 8000, db: 75 },
];

// ISO 8253 severity bands — Imprint-derived fills, 1.5× opacity lift for dark theme
const isDark = window.ANYPLOT_THEME === "dark";
const bands = [
  { label: "Normal",      lo: -10, hi: 25,
    fill: isDark ? "rgba(0,158,115,0.15)"   : "rgba(0,158,115,0.10)"   },
  { label: "Mild",        lo: 25,  hi: 40,
    fill: isDark ? "rgba(153,179,20,0.18)"  : "rgba(153,179,20,0.12)"  },
  { label: "Moderate",    lo: 40,  hi: 55,
    fill: isDark ? "rgba(189,130,51,0.21)"  : "rgba(189,130,51,0.14)"  },
  { label: "Mod. Severe", lo: 55,  hi: 70,
    fill: isDark ? "rgba(221,204,119,0.27)" : "rgba(221,204,119,0.18)" },
  { label: "Severe",      lo: 70,  hi: 90,
    fill: isDark ? "rgba(174,48,48,0.21)"   : "rgba(174,48,48,0.14)"   },
  { label: "Profound",    lo: 90,  hi: 120,
    fill: isDark ? "rgba(174,48,48,0.39)"   : "rgba(174,48,48,0.26)"   },
];

// Semantic colors: ISO 8253 clinical convention (red = right, blue = left)
const RIGHT_COLOR = "#AE3030";  // Imprint matte red — right ear convention
const LEFT_COLOR  = "#4467A3";  // Imprint blue     — left ear convention

// --- SVG mount --------------------------------------------------------------
const svg = d3.select("#container")
  .append("svg")
  .attr("width", width)
  .attr("height", height);

const g = svg.append("g")
  .attr("transform", `translate(${margin.left},${margin.top})`);

// --- Scales -----------------------------------------------------------------
const x = d3.scaleLog()
  .domain([125, 8000])
  .range([0, iw]);

// Inverted Y: -10 dB at top (y = 0), 120 dB at bottom (y = ih)
const y = d3.scaleLinear()
  .domain([-10, 120])
  .range([0, ih]);

// --- Severity bands ---------------------------------------------------------
bands.forEach(band => {
  g.append("rect")
    .attr("x", 0)
    .attr("y", y(band.lo))
    .attr("width", iw)
    .attr("height", y(band.hi) - y(band.lo))
    .attr("fill", band.fill);
});

// --- Gridlines --------------------------------------------------------------
// Horizontal: every 10 dB (full y-range)
d3.range(-10, 121, 10).forEach(db => {
  g.append("line")
    .attr("x1", 0).attr("x2", iw)
    .attr("y1", y(db)).attr("y2", y(db))
    .attr("stroke", t.grid)
    .attr("stroke-width", 0.8);
});

// Vertical: at each standard audiometric frequency
frequencies.forEach(freq => {
  g.append("line")
    .attr("x1", x(freq)).attr("x2", x(freq))
    .attr("y1", 0).attr("y2", ih)
    .attr("stroke", t.grid)
    .attr("stroke-width", 0.8);
});

// --- Plot border (all 4 sides — clinical audiogram standard) ----------------
g.append("rect")
  .attr("x", 0).attr("y", 0)
  .attr("width", iw).attr("height", ih)
  .attr("fill", "none")
  .attr("stroke", t.inkSoft)
  .attr("stroke-width", 1);

// --- Axes -------------------------------------------------------------------
const xAxis = g.append("g")
  .attr("transform", `translate(0,${ih})`)
  .call(
    d3.axisBottom(x)
      .tickValues(frequencies)
      .tickFormat(f => freqLabel[f])
      .tickSize(6)
  );
xAxis.selectAll("text")
  .attr("fill", t.inkSoft)
  .style("font-size", "14px");
xAxis.selectAll(".tick line").attr("stroke", t.inkSoft);
xAxis.select(".domain").remove();

const yAxis = g.append("g")
  .call(
    d3.axisLeft(y)
      .tickValues(d3.range(-10, 121, 10))
      .tickFormat(d3.format("d"))
      .tickSize(6)
  );
yAxis.selectAll("text")
  .attr("fill", t.inkSoft)
  .style("font-size", "14px");
yAxis.selectAll(".tick line").attr("stroke", t.inkSoft);
yAxis.select(".domain").remove();

// --- Ear connecting lines ---------------------------------------------------
const lineGen = d3.line()
  .x(d => x(d.freq))
  .y(d => y(d.db));

// Right ear: solid red line
g.append("path")
  .datum(rightEar)
  .attr("d", lineGen)
  .attr("fill", "none")
  .attr("stroke", RIGHT_COLOR)
  .attr("stroke-width", 2.5)
  .attr("stroke-linejoin", "round");

// Left ear: dashed blue line (accepted clinical convention to distinguish ears)
g.append("path")
  .datum(leftEar)
  .attr("d", lineGen)
  .attr("fill", "none")
  .attr("stroke", LEFT_COLOR)
  .attr("stroke-width", 2.5)
  .attr("stroke-dasharray", "7,4")
  .attr("stroke-linejoin", "round");

// --- Markers ----------------------------------------------------------------
// Right ear: open circles (O) — elevatedBg fill avoids blending into dark severity bands
const circleFill = isDark ? t.elevatedBg : t.pageBg;
g.selectAll(".m-right")
  .data(rightEar)
  .join("circle")
  .attr("class", "m-right")
  .attr("cx", d => x(d.freq))
  .attr("cy", d => y(d.db))
  .attr("r", 9)
  .attr("fill", circleFill)
  .attr("stroke", RIGHT_COLOR)
  .attr("stroke-width", 2.5);

// Left ear: X markers — d3.symbolCross rotated 45° gives the correct × shape
const xSymbol = d3.symbol().type(d3.symbolCross).size(320);
g.selectAll(".m-left")
  .data(leftEar)
  .join("path")
  .attr("class", "m-left")
  .attr("transform", d => `translate(${x(d.freq)},${y(d.db)}) rotate(45)`)
  .attr("d", xSymbol)
  .attr("fill", LEFT_COLOR)
  .attr("stroke", "none");

// --- Axis labels ------------------------------------------------------------
svg.append("text")
  .attr("x", margin.left + iw / 2)
  .attr("y", height - 18)
  .attr("text-anchor", "middle")
  .attr("fill", t.ink)
  .style("font-size", "16px")
  .text("Frequency (Hz)");

svg.append("text")
  .attr("transform", "rotate(-90)")
  .attr("x", -(margin.top + ih / 2))
  .attr("y", 24)
  .attr("text-anchor", "middle")
  .attr("fill", t.ink)
  .style("font-size", "16px")
  .text("Hearing Level (dB HL)");

// --- Severity band labels (right margin) ------------------------------------
bands.forEach(band => {
  svg.append("text")
    .attr("x", margin.left + iw + 10)
    .attr("y", margin.top + y(band.lo) + (y(band.hi) - y(band.lo)) / 2)
    .attr("dy", "0.35em")
    .attr("fill", t.inkSoft)
    .style("font-size", "14px")
    .text(band.label);
});

// --- Legend (below title, above plot area) ----------------------------------
const lgY  = 60;
const lgX1 = margin.left + iw / 2 - 140;
const lgX2 = lgX1 + 175;

// Right ear legend entry
svg.append("line")
  .attr("x1", lgX1).attr("y1", lgY)
  .attr("x2", lgX1 + 34).attr("y2", lgY)
  .attr("stroke", RIGHT_COLOR)
  .attr("stroke-width", 2.5);
svg.append("circle")
  .attr("cx", lgX1 + 17).attr("cy", lgY).attr("r", 7)
  .attr("fill", circleFill)
  .attr("stroke", RIGHT_COLOR)
  .attr("stroke-width", 2.5);
svg.append("text")
  .attr("x", lgX1 + 44).attr("y", lgY).attr("dy", "0.35em")
  .attr("fill", t.ink)
  .style("font-size", "14px")
  .text("Right Ear (O)");

// Left ear legend entry
svg.append("line")
  .attr("x1", lgX2).attr("y1", lgY)
  .attr("x2", lgX2 + 34).attr("y2", lgY)
  .attr("stroke", LEFT_COLOR)
  .attr("stroke-width", 2.5)
  .attr("stroke-dasharray", "7,4");
svg.append("path")
  .attr("transform", `translate(${lgX2 + 17},${lgY}) rotate(45)`)
  .attr("d", d3.symbol().type(d3.symbolCross).size(220))
  .attr("fill", LEFT_COLOR)
  .attr("stroke", "none");
svg.append("text")
  .attr("x", lgX2 + 44).attr("y", lgY).attr("dy", "0.35em")
  .attr("fill", t.ink)
  .style("font-size", "14px")
  .text("Left Ear (X)");

// --- Title ------------------------------------------------------------------
svg.append("text")
  .attr("x", width / 2)
  .attr("y", 36)
  .attr("text-anchor", "middle")
  .attr("fill", t.ink)
  .style("font-size", "22px")
  .style("font-weight", "600")
  .text("audiogram-clinical · javascript · d3 · anyplot.ai");
Runnable source as JSON, for any HTTP client: https://api.anyplot.ai/specs/audiogram-clinical/d3/code. Any spec id and library id listed in llms-full.txt fit the same URL shape; every URL below is complete and callable.
{
  "spec_id": "audiogram-clinical",
  "language": "javascript",
  "library": "d3",
  "page": "https://anyplot.ai/audiogram-clinical/javascript/d3",
  "hub": "https://anyplot.ai/audiogram-clinical",
  "code_json": "https://api.anyplot.ai/specs/audiogram-clinical/d3/code",
  "spec_json": "https://api.anyplot.ai/specs/audiogram-clinical",
  "render_light_png": "https://storage.googleapis.com/anyplot-images/plots/audiogram-clinical/javascript/d3/plot-light.png",
  "render_dark_png": "https://storage.googleapis.com/anyplot-images/plots/audiogram-clinical/javascript/d3/plot-dark.png",
  "interactive_light_html": "https://storage.googleapis.com/anyplot-images/plots/audiogram-clinical/javascript/d3/plot-light.html",
  "interactive_dark_html": "https://storage.googleapis.com/anyplot-images/plots/audiogram-clinical/javascript/d3/plot-dark.html",
  "quality_score": 93.0,
  "license": "MIT",
  "guide": "https://anyplot.ai/llms.txt"
}
Part of Clinical Audiogram on anyplot.ai.