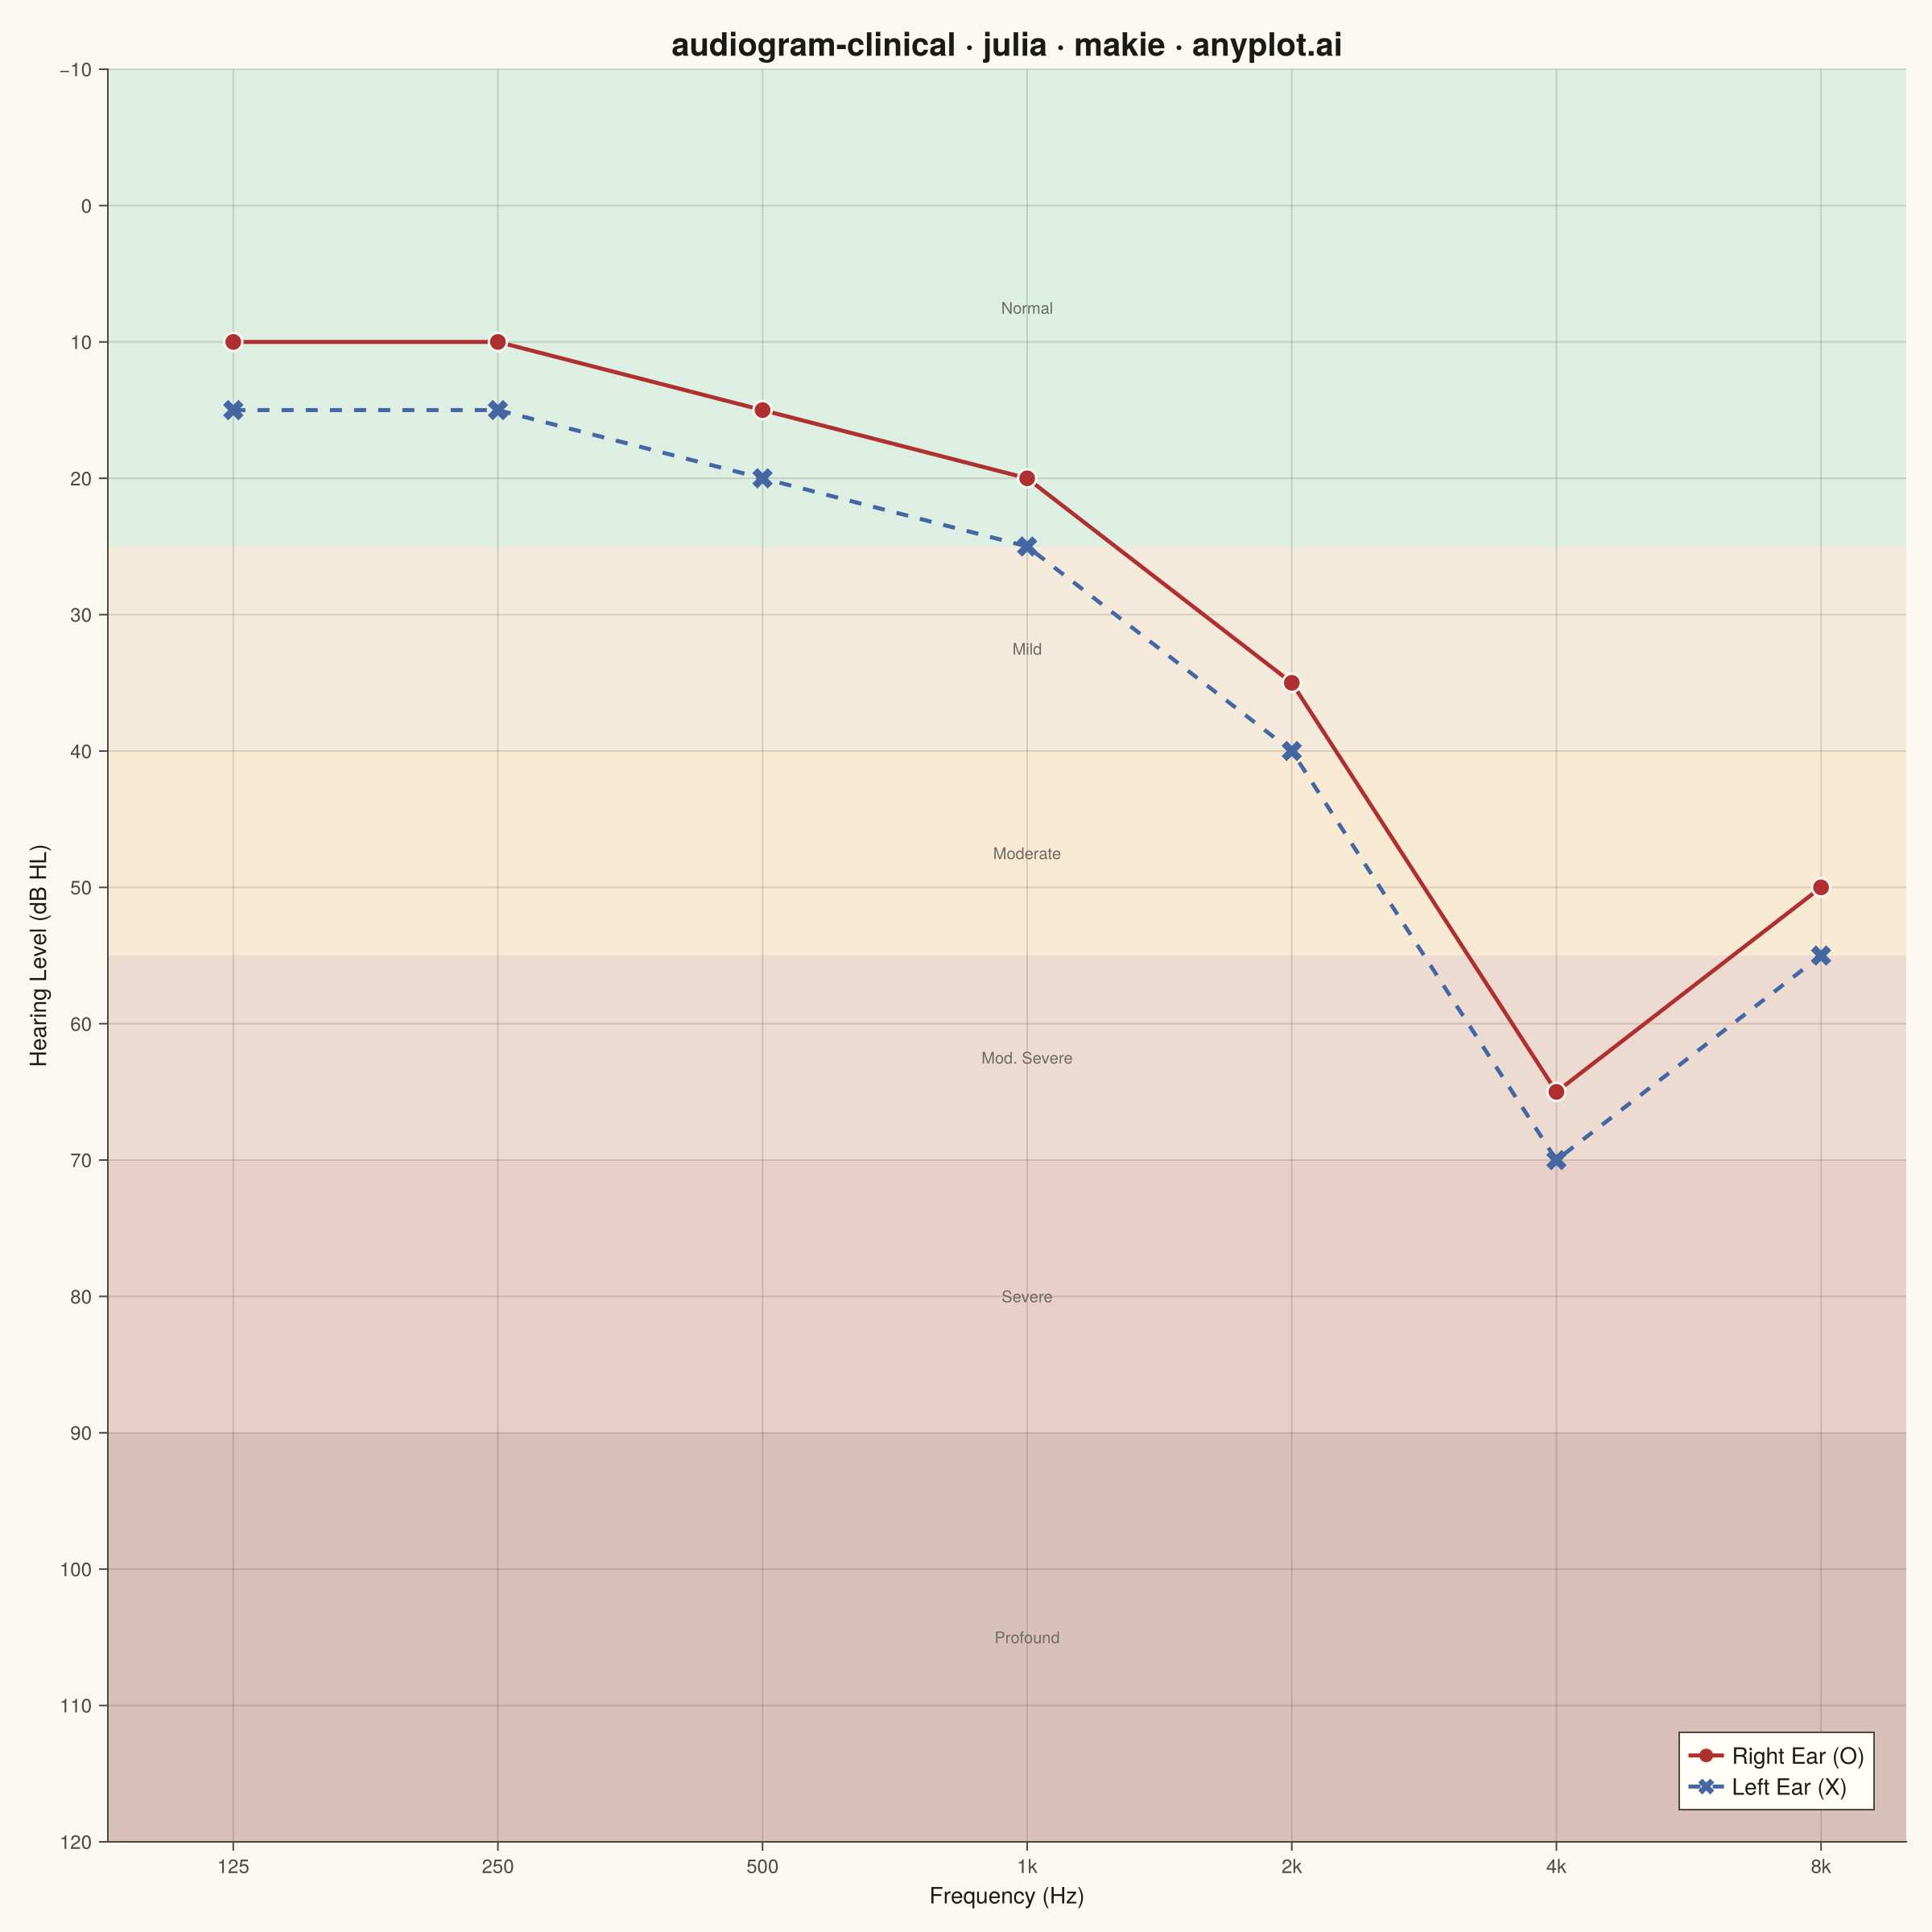
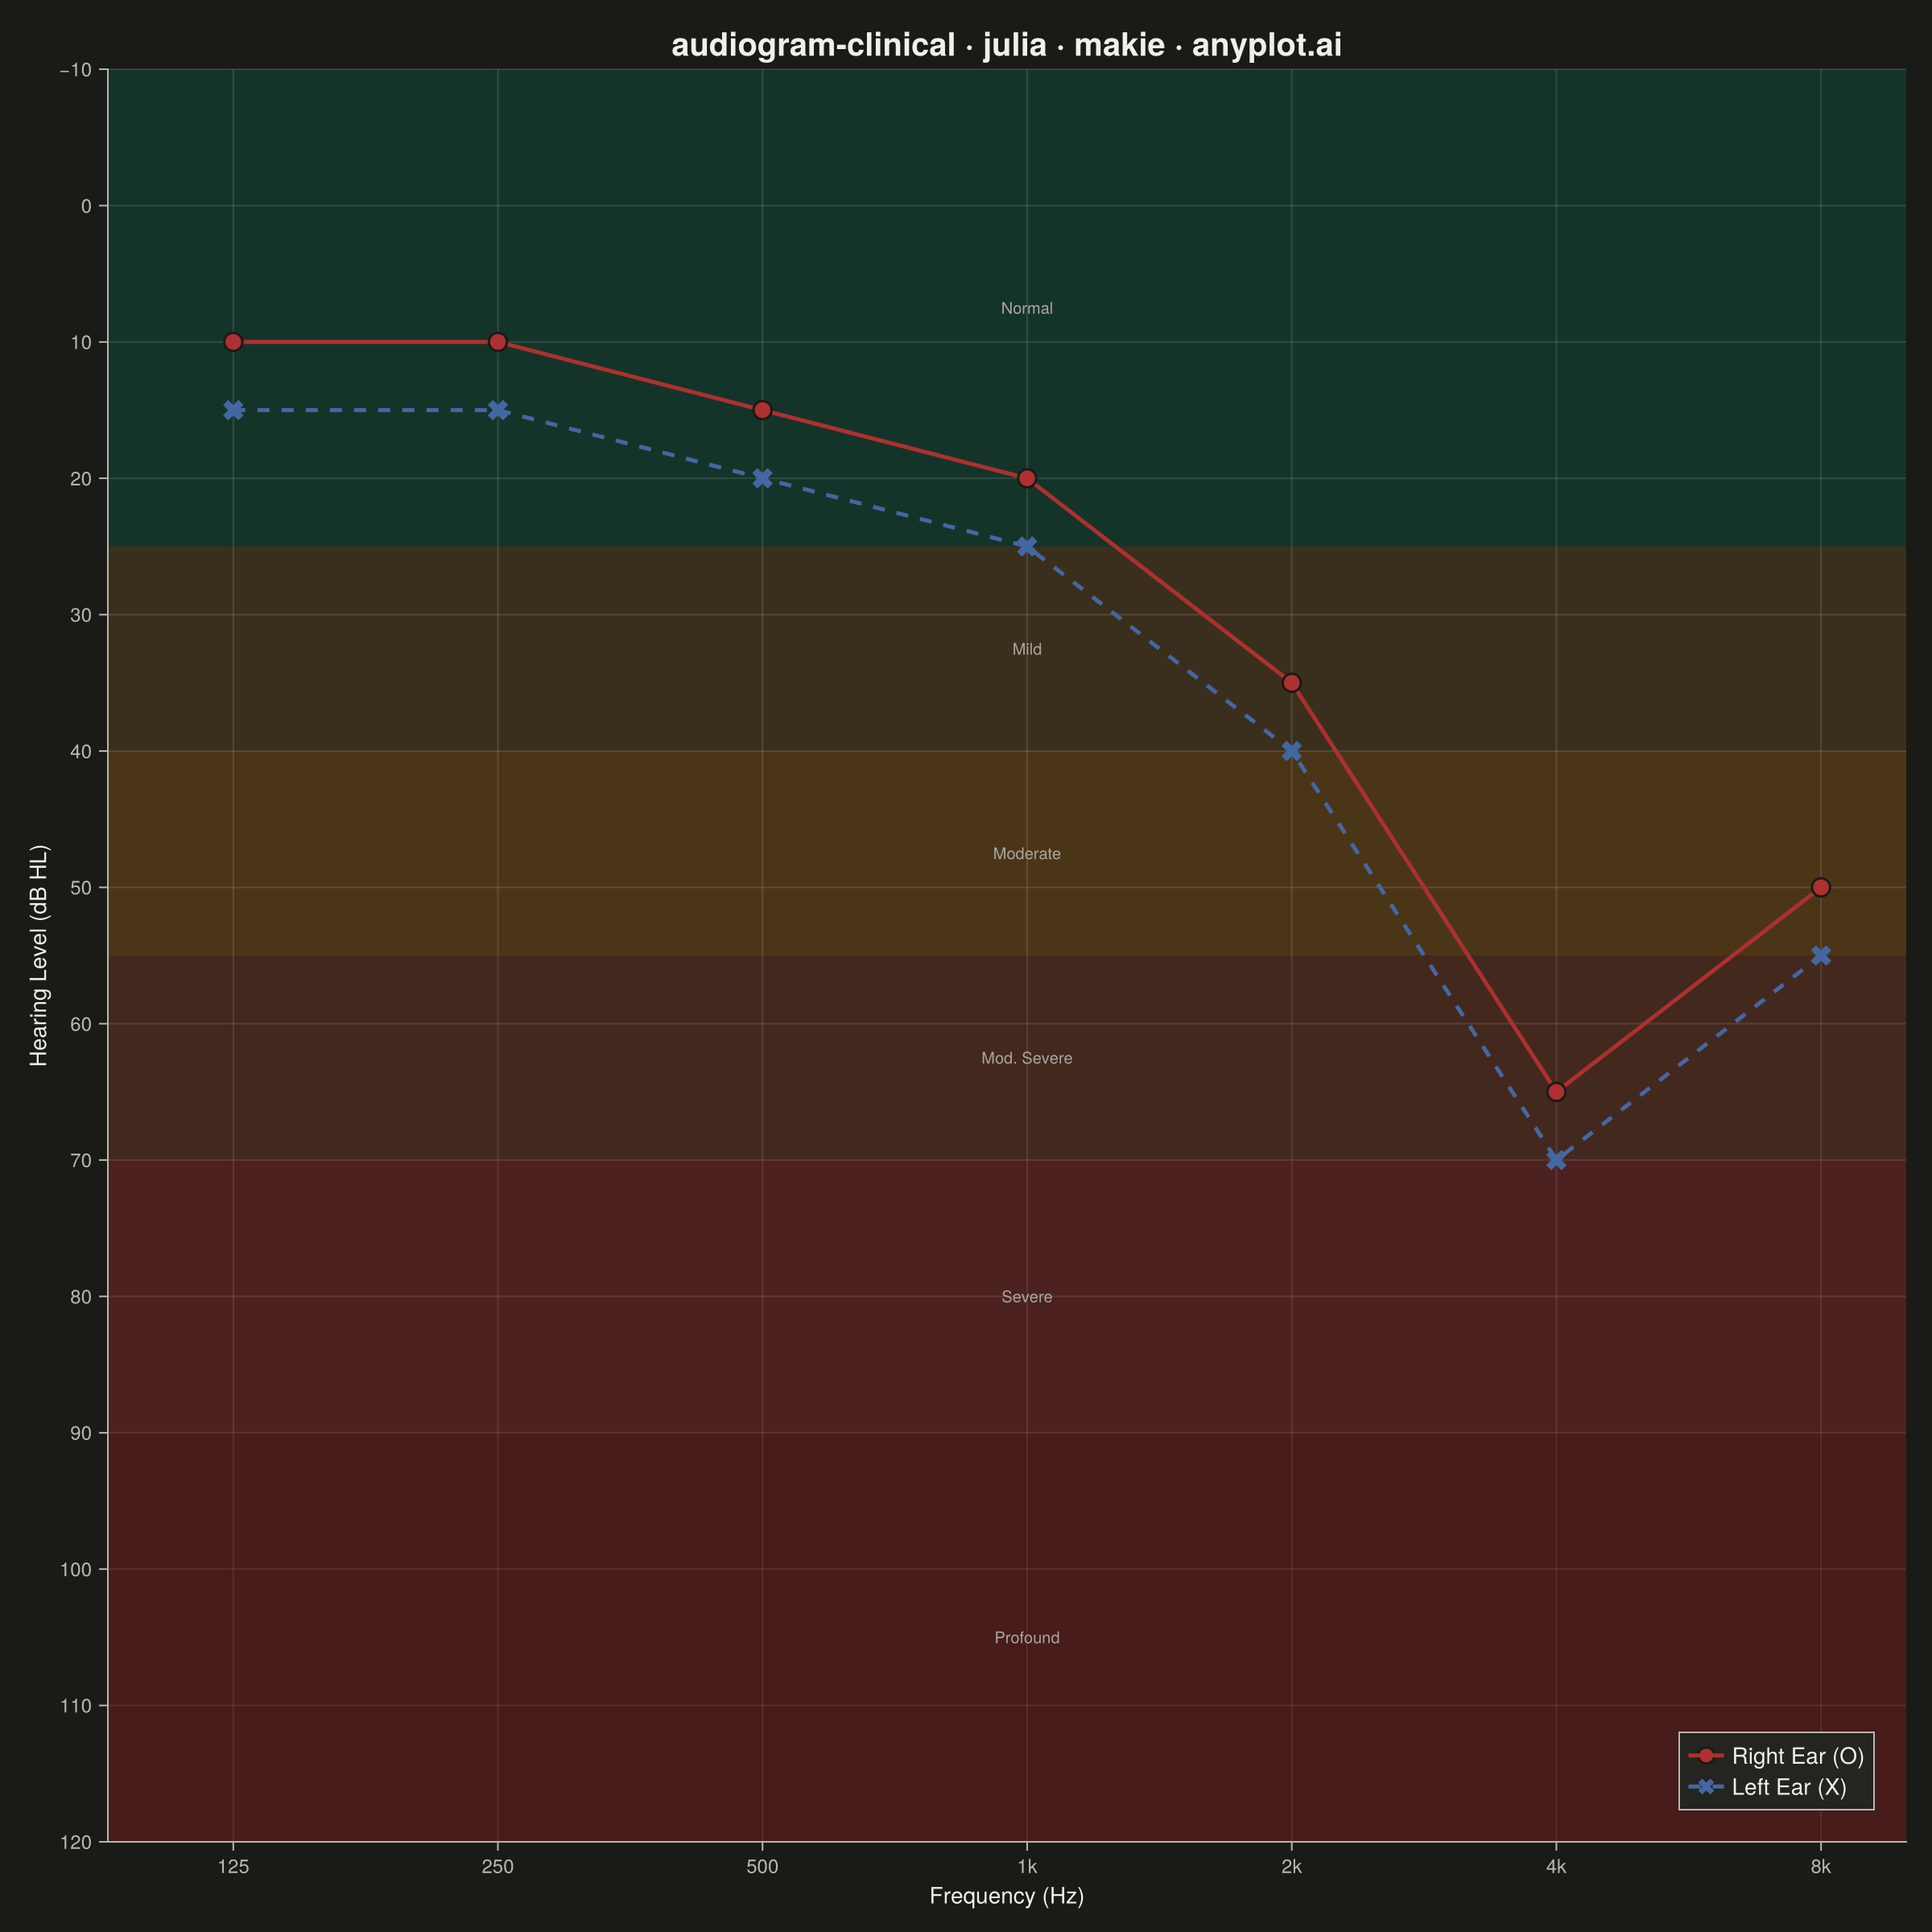
A standardized clinical audiogram that displays hearing test results, plotting hearing threshold (dB HL) against test frequency for each ear. The y-axis is inverted so that 0 dB HL (best hearing) sits at the top and increasing hearing loss extends downward, while the x-axis is logarithmic spanning the standard audiometric frequencies (125 Hz to 8 kHz). Thresholds are marked with the conventional symbols — a circle (O) for the right ear in red and a cross (X) for the left ear in blue — and connected per ear, with shaded horizontal bands indicating severity of hearing loss (normal, mild, moderate, severe, profound).
# anyplot.ai
# audiogram-clinical: Clinical Audiogram
# Library: makie 0.22.10 | Julia 1.11.9
# Quality: 89/100 | Created: 2026-06-15

using CairoMakie
using Colors
using Random

Random.seed!(42)

# Theme tokens
const THEME       = get(ENV, "ANYPLOT_THEME", "light")
const PAGE_BG     = THEME == "light" ? colorant"#FAF8F1" : colorant"#1A1A17"
const ELEVATED_BG = THEME == "light" ? colorant"#FFFDF6" : colorant"#242420"
const INK         = THEME == "light" ? colorant"#1A1A17" : colorant"#F0EFE8"
const INK_SOFT    = THEME == "light" ? colorant"#4A4A44" : colorant"#B8B7B0"
const INK_MUTED   = THEME == "light" ? colorant"#6B6A63" : colorant"#A8A79F"

# Audiogram follows standard audiological color conventions (semantic exception):
# right ear → red (Imprint position 5), left ear → blue (Imprint position 3)
const RIGHT_EAR_COLOR = colorant"#AE3030"
const LEFT_EAR_COLOR  = colorant"#4467A3"

# Pure-tone audiometry data — noise-induced high-frequency sensorineural notch
const FREQUENCIES     = Float64[125, 250, 500, 1000, 2000, 4000, 8000]
const THRESHOLD_RIGHT = Float64[10,  10,  15,  20,   35,   65,   50]
const THRESHOLD_LEFT  = Float64[15,  15,  20,  25,   40,   70,   55]

# Severity band fill alpha — dark mode reduced to prevent over-saturation
band_alpha = THEME == "light" ? 0.12f0 : 0.14f0

# Severity bands: (y_low, y_high, label, fill_color)
# Colors derived from exact Imprint palette members:
#   IP1 #009E73 (pos 1 — green), IP4 #BD8233 (pos 4 — ochre), IP5 #AE3030 (pos 5 — red)
bands = [
    (-10.0,  25.0, "Normal",      RGBAf(0.000f0, 0.620f0, 0.451f0, band_alpha)),
    ( 25.0,  40.0, "Mild",        RGBAf(0.741f0, 0.510f0, 0.200f0, band_alpha)),
    ( 40.0,  55.0, "Moderate",    RGBAf(0.741f0, 0.510f0, 0.200f0, band_alpha * 1.4f0)),
    ( 55.0,  70.0, "Mod. Severe", RGBAf(0.682f0, 0.188f0, 0.188f0, band_alpha)),
    ( 70.0,  90.0, "Severe",      RGBAf(0.682f0, 0.188f0, 0.188f0, band_alpha * 1.5f0)),
    ( 90.0, 120.0, "Profound",    RGBAf(0.682f0, 0.188f0, 0.188f0, band_alpha * 2.0f0)),
]

# Figure — square canvas (audiograms are conventionally square)
fig = Figure(
    resolution      = (1200, 1200),
    fontsize        = 14,
    backgroundcolor = PAGE_BG,
)

ax = Axis(
    fig[1, 1];
    title             = "audiogram-clinical · julia · makie · anyplot.ai",
    titlesize         = 20,
    titlecolor        = INK,
    xlabel            = "Frequency (Hz)",
    ylabel            = "Hearing Level (dB HL)",
    xlabelsize        = 14,
    ylabelsize        = 14,
    xlabelcolor       = INK,
    ylabelcolor       = INK,
    xticklabelsize    = 12,
    yticklabelsize    = 12,
    xticklabelcolor   = INK_SOFT,
    yticklabelcolor   = INK_SOFT,
    xtickcolor        = INK_SOFT,
    ytickcolor        = INK_SOFT,
    backgroundcolor   = PAGE_BG,
    topspinevisible   = false,
    rightspinevisible = false,
    leftspinecolor    = INK_SOFT,
    bottomspinecolor  = INK_SOFT,
    xscale            = log10,
    yreversed         = true,
    xticks            = ([125, 250, 500, 1000, 2000, 4000, 8000],
                         ["125", "250", "500", "1k", "2k", "4k", "8k"]),
    yticks            = collect(-10:10:120),
    limits            = (90, 10000, -10, 120),
    xgridcolor        = RGBAf(INK.r, INK.g, INK.b, 0.15f0),
    ygridcolor        = RGBAf(INK.r, INK.g, INK.b, 0.15f0),
    xminorgridvisible = false,
    yminorgridvisible = false,
)

# Severity bands drawn below data; labels centered in each band at 1 kHz
for (y1, y2, label, band_color) in bands
    hspan!(ax, y1, y2; color = band_color)
    text!(ax, 1000.0, (y1 + y2) / 2;
          text     = label,
          color    = INK_MUTED,
          fontsize = 12,
          align    = (:center, :center))
end

# Focal-point emphasis on clinically significant 4 kHz sensorineural notch
text!(ax, 4700.0, 56.0;
      text     = "4 kHz notch",
      color    = INK_SOFT,
      fontsize = 10,
      align    = (:left, :center))

# Connecting lines (drawn first so markers sit on top)
lines!(ax, FREQUENCIES, THRESHOLD_RIGHT;
       color     = RIGHT_EAR_COLOR,
       linewidth = 2.5)
lines!(ax, FREQUENCIES, THRESHOLD_LEFT;
       color     = LEFT_EAR_COLOR,
       linewidth = 2.5,
       linestyle = :dash)

# Markers — right ear: filled circle (O), left ear: × cross (X)
scatter!(ax, FREQUENCIES, THRESHOLD_RIGHT;
         color       = RIGHT_EAR_COLOR,
         marker      = :circle,
         markersize  = 16,
         strokewidth = 1.5,
         strokecolor = PAGE_BG)
scatter!(ax, FREQUENCIES, THRESHOLD_LEFT;
         color      = LEFT_EAR_COLOR,
         marker     = :xcross,
         markersize = 18,
         strokewidth = 0)

# Inset legend
leg_entries = [
    [MarkerElement(marker = :circle, color = RIGHT_EAR_COLOR, markersize = 14,
                   strokewidth = 1.5, strokecolor = PAGE_BG),
     LineElement(color = RIGHT_EAR_COLOR, linewidth = 2.5)],
    [MarkerElement(marker = :xcross, color = LEFT_EAR_COLOR, markersize = 14),
     LineElement(color = LEFT_EAR_COLOR, linewidth = 2.5, linestyle = :dash)],
]
leg_labels = ["Right Ear (O)", "Left Ear (X)"]

Legend(fig[1, 1], leg_entries, leg_labels;
       tellwidth       = false,
       tellheight      = false,
       halign          = :right,
       valign          = :bottom,
       margin          = (20, 20, 20, 20),
       framevisible    = true,
       framecolor      = INK_SOFT,
       backgroundcolor = ELEVATED_BG,
       labelcolor      = INK,
       fontsize        = 12,
       patchsize       = (22, 12),
)

# Save
save("plot-$(THEME).png", fig; px_per_unit = 2)
Runnable source as JSON, for any HTTP client: https://api.anyplot.ai/specs/audiogram-clinical/makie/code. Any spec id and library id listed in llms-full.txt fit the same URL shape; every URL below is complete and callable.
{
  "spec_id": "audiogram-clinical",
  "language": "julia",
  "library": "makie",
  "page": "https://anyplot.ai/audiogram-clinical/julia/makie",
  "hub": "https://anyplot.ai/audiogram-clinical",
  "code_json": "https://api.anyplot.ai/specs/audiogram-clinical/makie/code",
  "spec_json": "https://api.anyplot.ai/specs/audiogram-clinical",
  "render_light_png": "https://storage.googleapis.com/anyplot-images/plots/audiogram-clinical/julia/makie/plot-light.png",
  "render_dark_png": "https://storage.googleapis.com/anyplot-images/plots/audiogram-clinical/julia/makie/plot-dark.png",
  "quality_score": 89.0,
  "license": "MIT",
  "guide": "https://anyplot.ai/llms.txt"
}
Part of Clinical Audiogram on anyplot.ai.