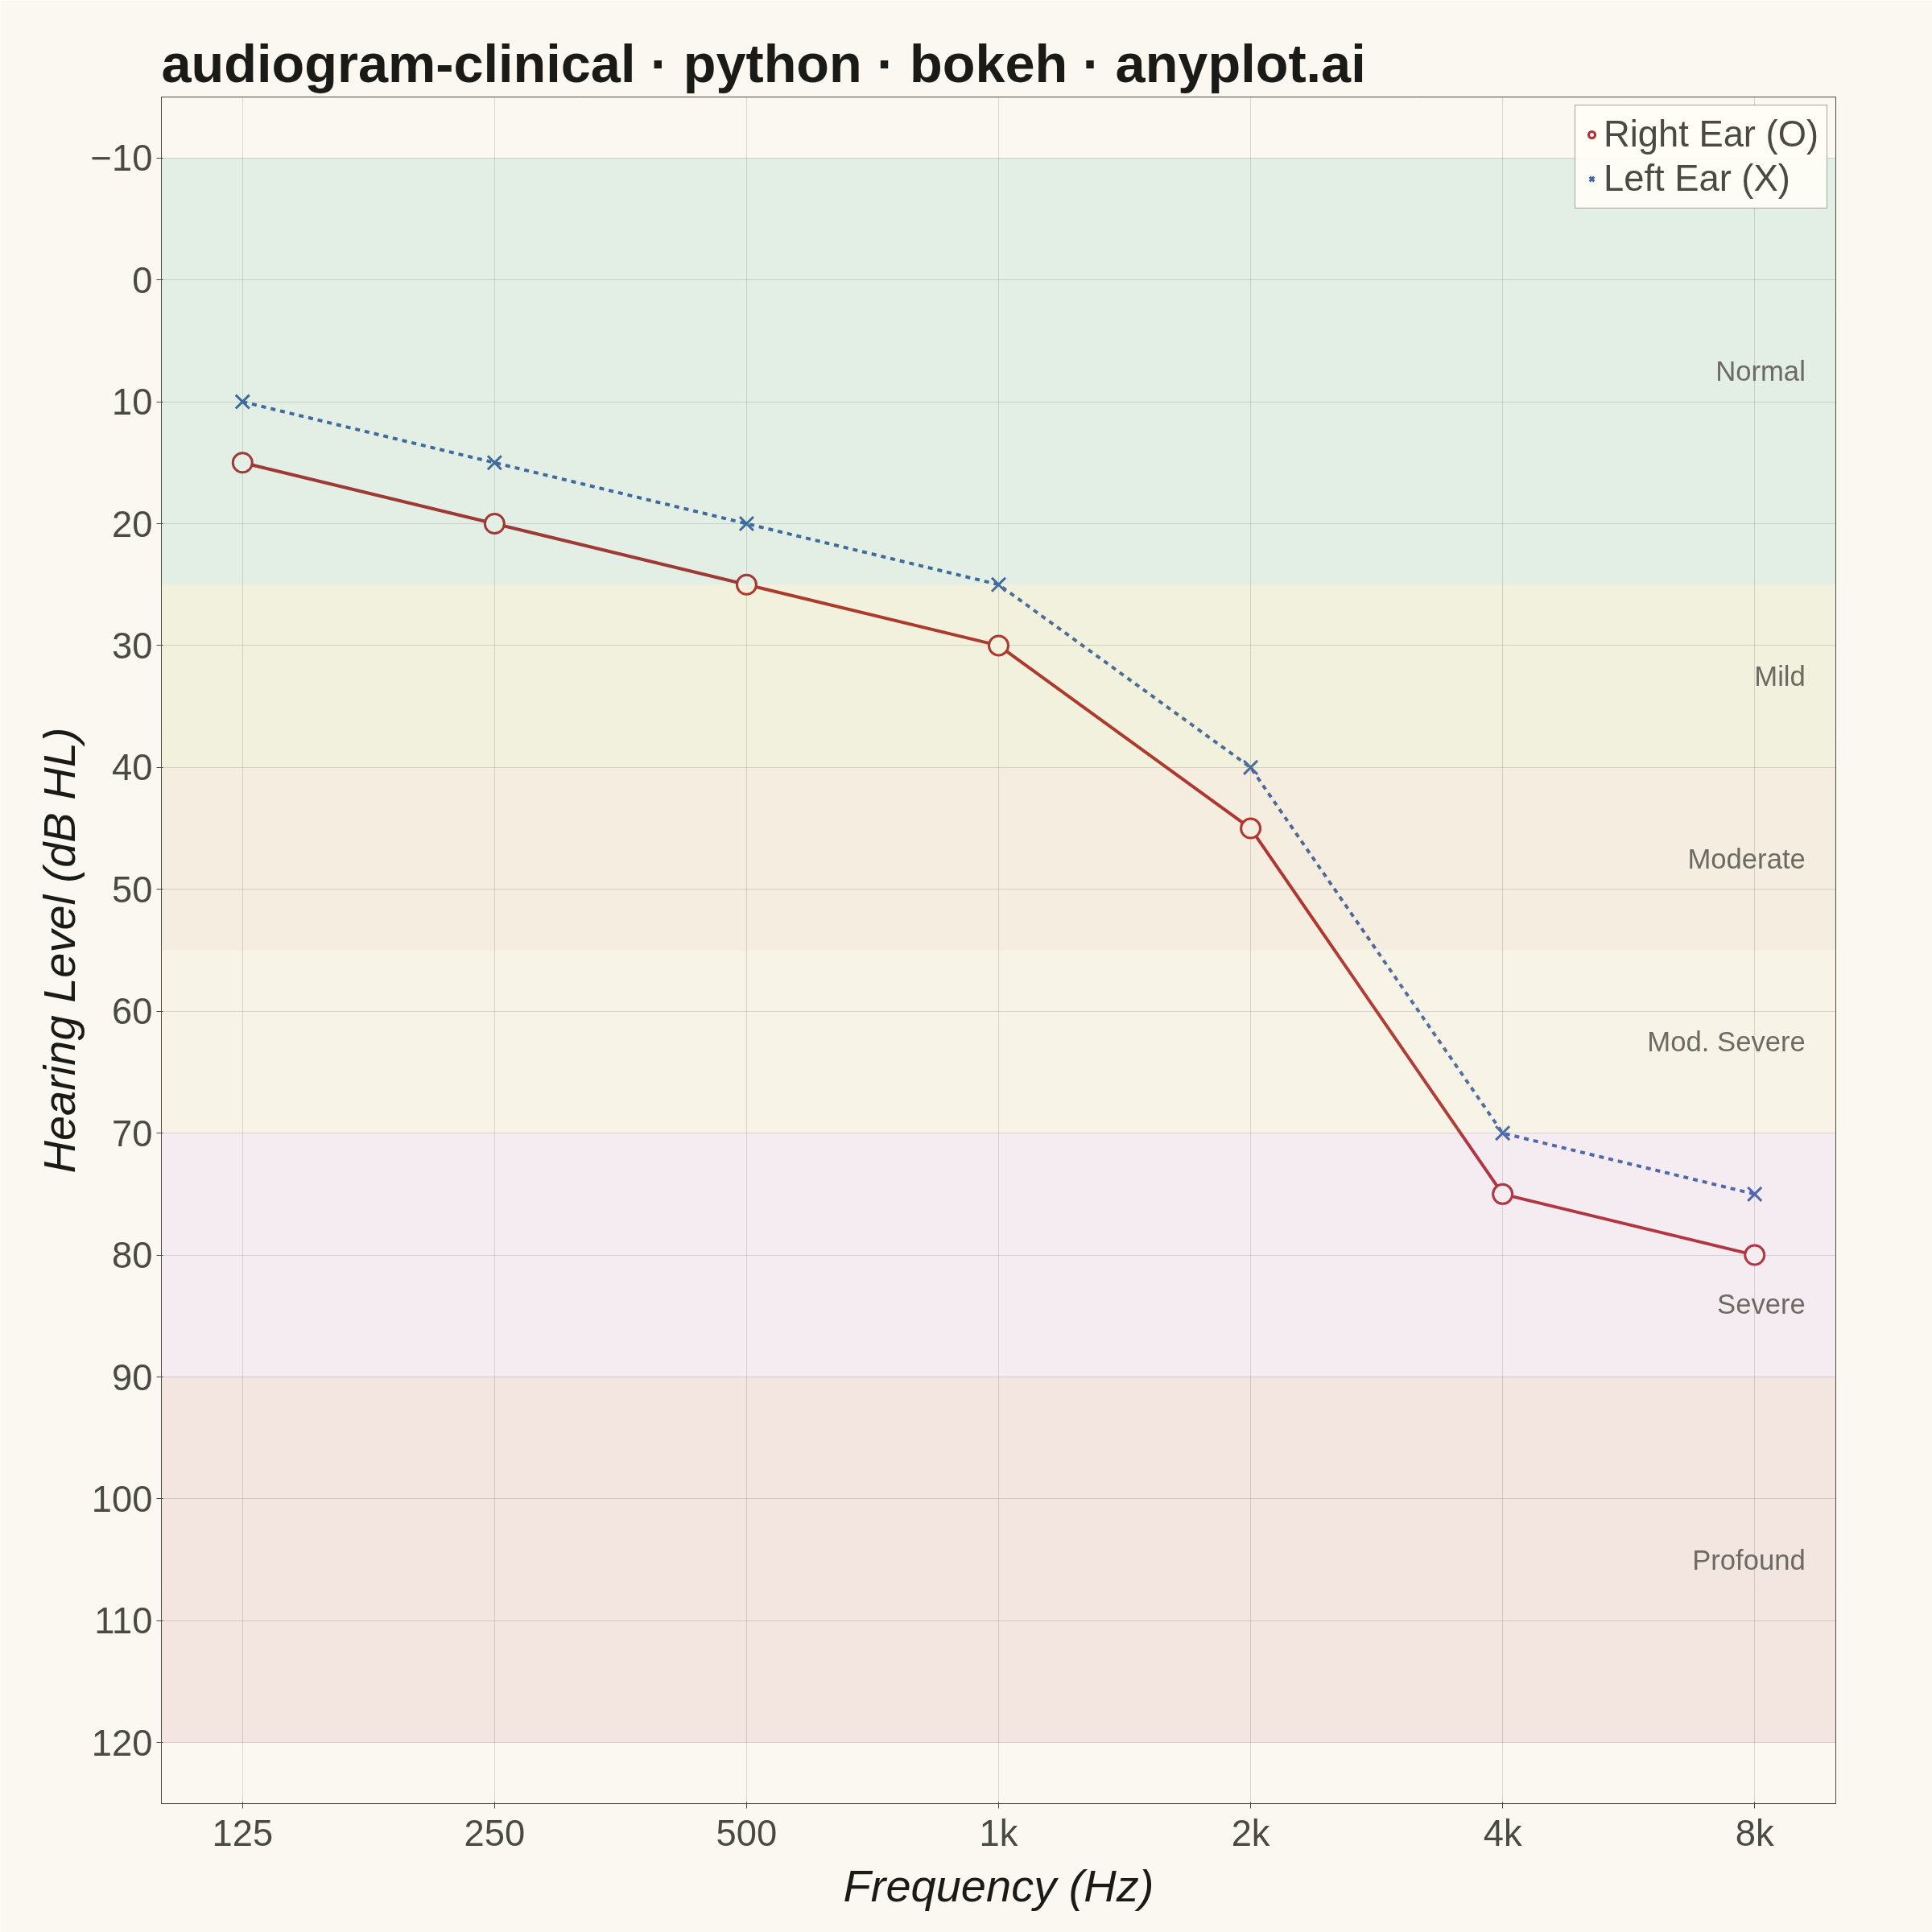
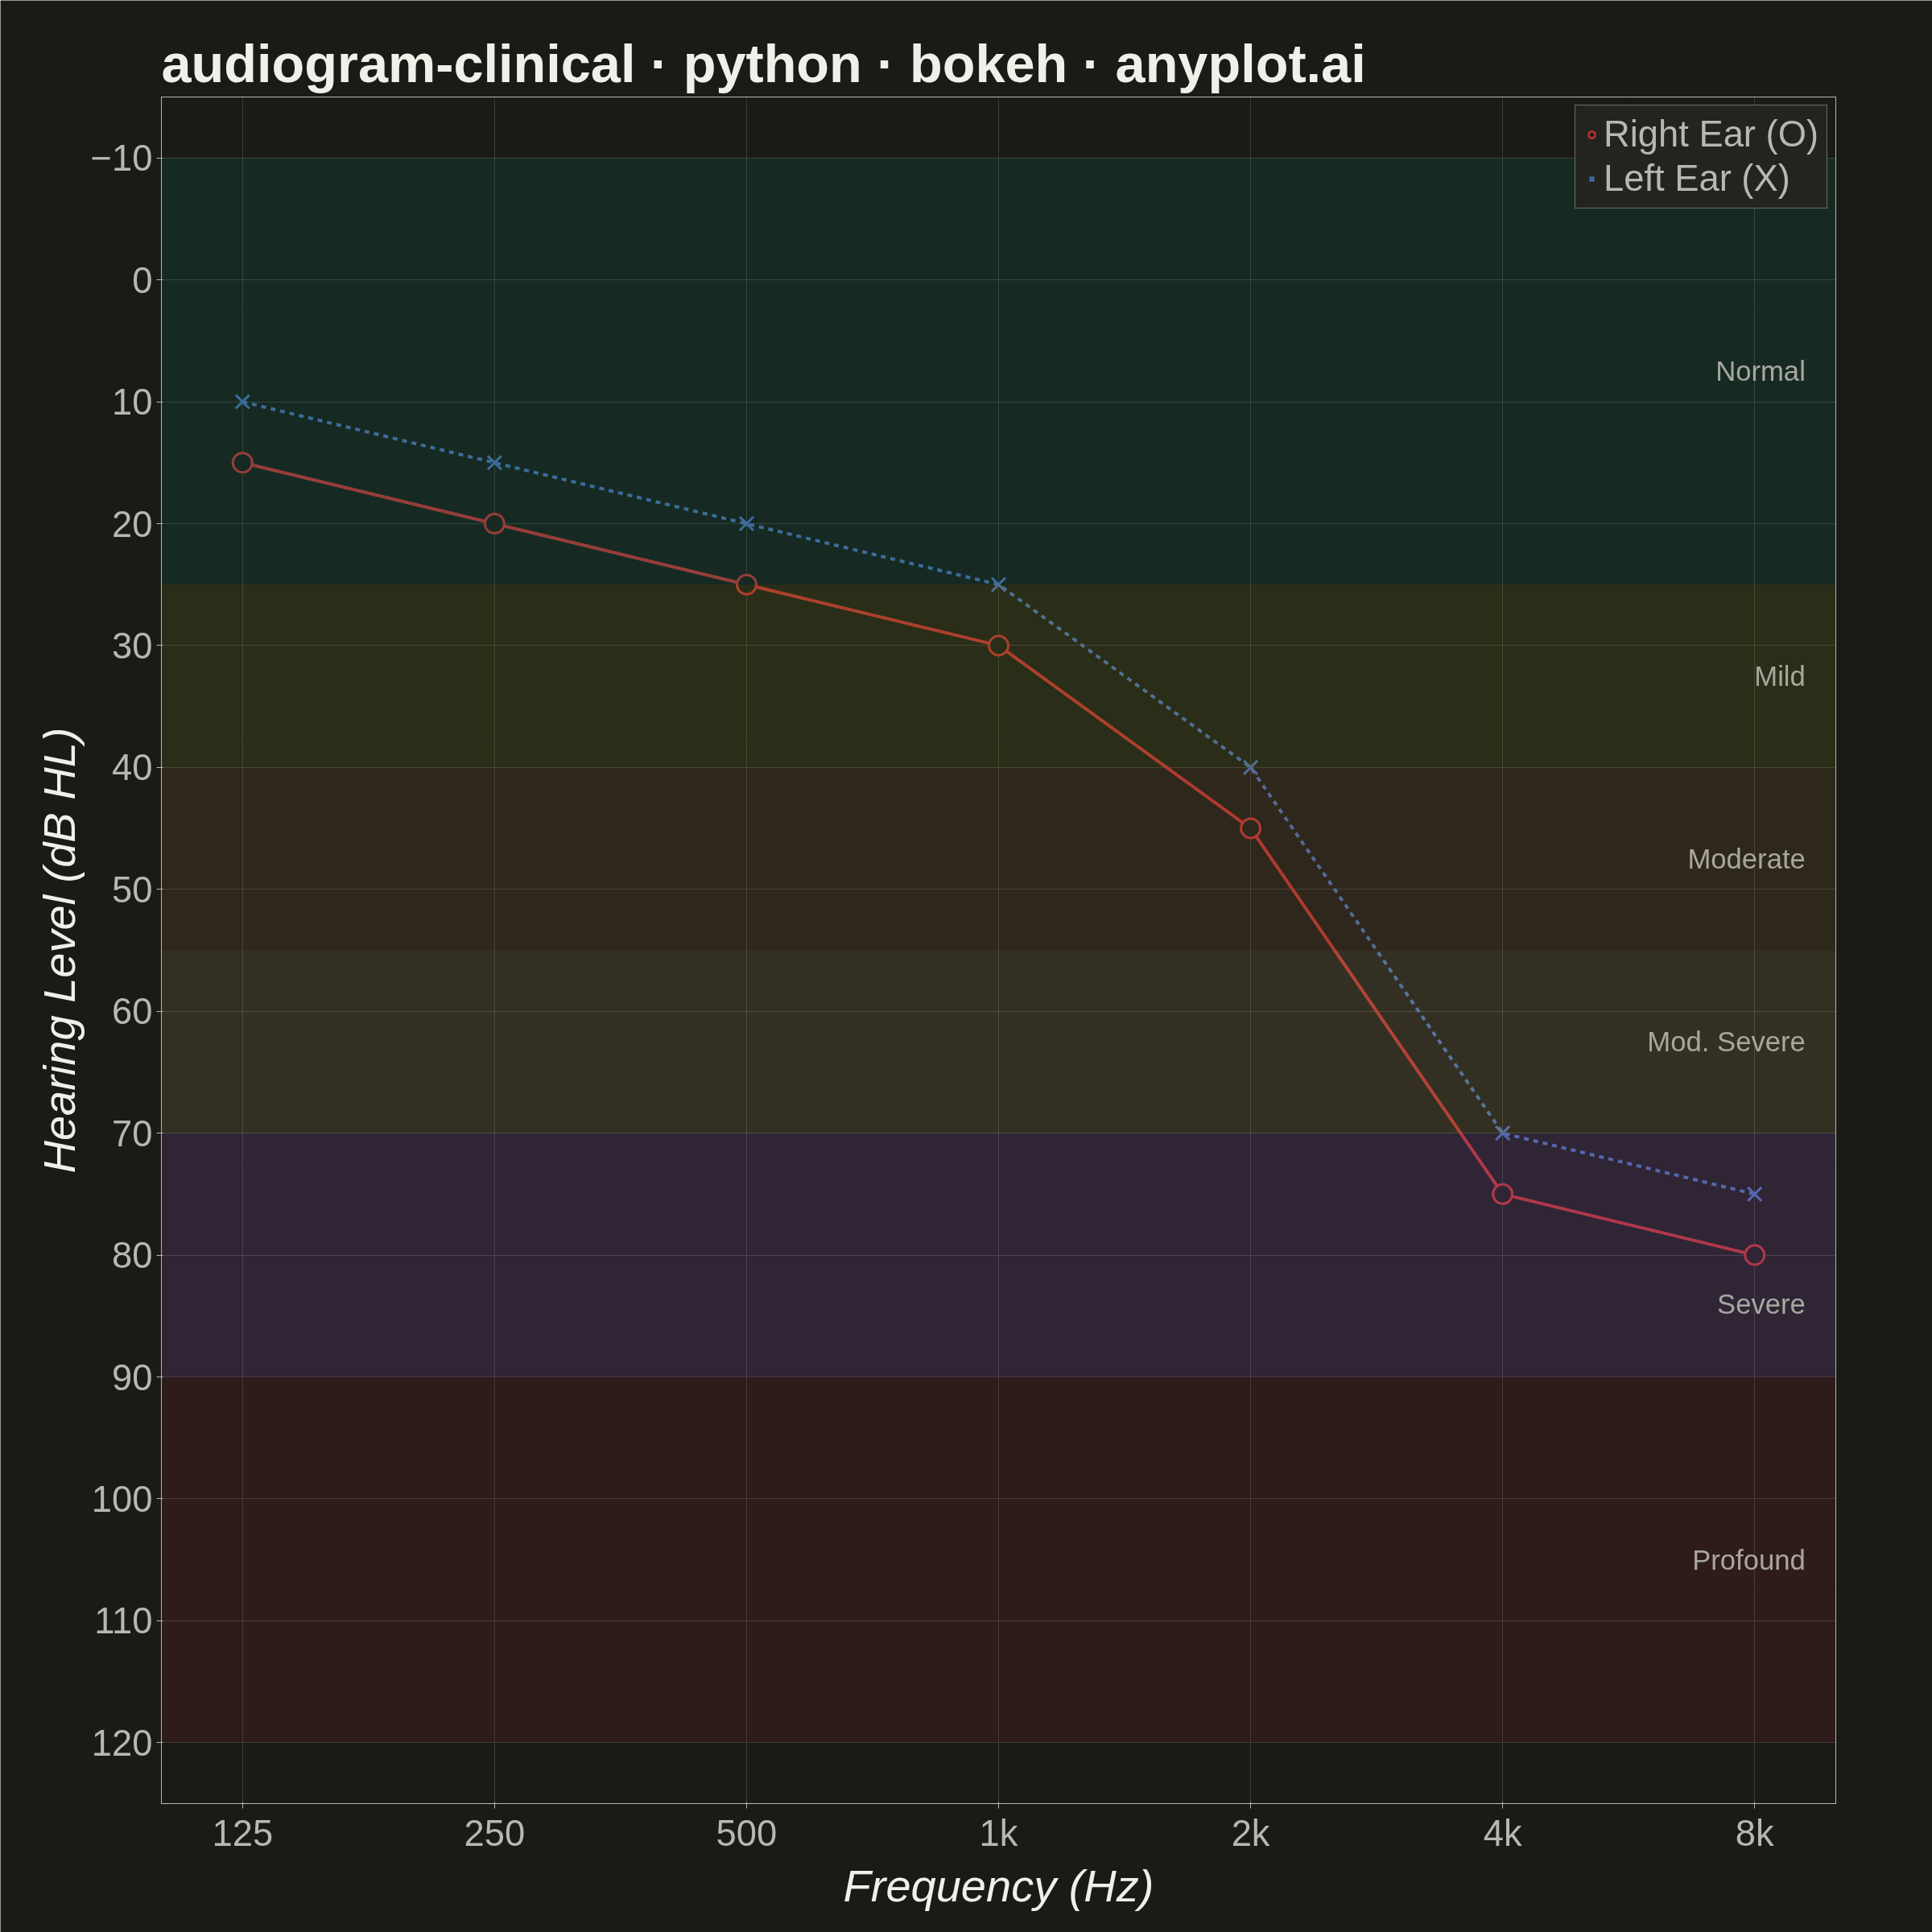
A standardized clinical audiogram that displays hearing test results, plotting hearing threshold (dB HL) against test frequency for each ear. The y-axis is inverted so that 0 dB HL (best hearing) sits at the top and increasing hearing loss extends downward, while the x-axis is logarithmic spanning the standard audiometric frequencies (125 Hz to 8 kHz). Thresholds are marked with the conventional symbols — a circle (O) for the right ear in red and a cross (X) for the left ear in blue — and connected per ear, with shaded horizontal bands indicating severity of hearing loss (normal, mild, moderate, severe, profound).
""" anyplot.ai
audiogram-clinical: Clinical Audiogram
Library: bokeh 3.9.1 | Python 3.13.13
Quality: 87/100 | Updated: 2026-06-15
"""

import io
import os
import sys
import time
from pathlib import Path


# Remove current dir from sys.path so bokeh.py doesn't shadow the bokeh package
sys.path = [p for p in sys.path if p != "" and not (os.path.isfile(os.path.join(p, "bokeh.py")) if p else False)]

import numpy as np
from bokeh.io import output_file, save
from bokeh.models import BoxAnnotation, FixedTicker, Label
from bokeh.plotting import figure
from PIL import Image
from selenium import webdriver
from selenium.webdriver.chrome.options import Options


# Theme tokens
THEME = os.getenv("ANYPLOT_THEME", "light")
PAGE_BG = "#FAF8F1" if THEME == "light" else "#1A1A17"
ELEVATED_BG = "#FFFDF6" if THEME == "light" else "#242420"
INK = "#1A1A17" if THEME == "light" else "#F0EFE8"
INK_SOFT = "#4A4A44" if THEME == "light" else "#B8B7B0"
INK_MUTED = "#6B6A63" if THEME == "light" else "#A8A79F"

# Audiogram semantic colors (clinical convention: red = right, blue = left)
COLOR_RIGHT = "#AE3030"  # Imprint position 5 (matte red) — semantic: right ear
COLOR_LEFT = "#4467A3"  # Imprint position 3 (blue) — semantic: left ear

# Data: high-frequency sensorineural notch (typical noise-induced pattern)
np.random.seed(42)
frequencies = [125, 250, 500, 1000, 2000, 4000, 8000]

# Right ear: mild-to-moderate high-frequency sensorineural loss
threshold_right = [15, 20, 25, 30, 45, 75, 80]

# Left ear: slightly milder, similar sloping pattern
threshold_left = [10, 15, 20, 25, 40, 70, 75]

# Severity bands: (y_start, y_end in dB HL, fill color, label)
# Colors chosen from Imprint palette — severity gradient green→red
severity_bands = [
    (-10, 25, "#009E73", "Normal"),  # green  (Imprint pos 1)
    (25, 40, "#99B314", "Mild"),  # lime   (Imprint pos 8)
    (40, 55, "#BD8233", "Moderate"),  # ochre  (Imprint pos 4)
    (55, 70, "#DDCC77", "Mod. Severe"),  # amber  (semantic anchor)
    (70, 90, "#C475FD", "Severe"),  # lavender (Imprint pos 2)
    (90, 120, "#AE3030", "Profound"),  # red    (Imprint pos 5)
]

# Title — 49 chars < 67 baseline, default '50pt' applies
title = "audiogram-clinical · python · bokeh · anyplot.ai"

# Plot — square canvas suits the symmetric clinical format
p = figure(
    width=2400,
    height=2400,
    title=title,
    x_axis_label="Frequency (Hz)",
    y_axis_label="Hearing Level (dB HL)",
    x_axis_type="log",
    x_range=(100, 10000),
    y_range=(125, -15),  # inverted: 0 dB (best hearing) at top, loss increases down
    toolbar_location=None,
    min_border_bottom=160,
    min_border_left=200,
    min_border_top=120,
    min_border_right=120,
)

# Theme-adaptive band alpha — subtle on light, slightly more visible on dark
BAND_ALPHA = 0.09 if THEME == "light" else 0.13

# Severity band shading
for y_start, y_end, color, _label in severity_bands:
    p.add_layout(BoxAnnotation(bottom=y_start, top=y_end, fill_color=color, fill_alpha=BAND_ALPHA, line_color=None))

# Severity band labels — placed at right side of each band
for y_start, y_end, _color, band_label in severity_bands:
    y_mid = (y_start + y_end) / 2
    if band_label == "Severe":
        y_mid += 4  # offset down to avoid overlap with 8k right-ear marker at 80 dB
    p.add_layout(
        Label(
            x=9200,
            y=y_mid,
            x_units="data",
            y_units="data",
            text=band_label,
            text_font_size="26pt",
            text_color=INK_MUTED,
            text_align="right",
            text_baseline="middle",
        )
    )

# Right ear: open circles (O) + solid connecting line
p.line(frequencies, threshold_right, line_color=COLOR_RIGHT, line_width=4)
p.scatter(
    frequencies,
    threshold_right,
    marker="circle",
    size=24,
    fill_color=PAGE_BG,
    fill_alpha=1.0,
    line_color=COLOR_RIGHT,
    line_width=3,
    legend_label="Right Ear (O)",
)

# Left ear: X markers + dashed connecting line
p.line(frequencies, threshold_left, line_color=COLOR_LEFT, line_width=4, line_dash="dashed")
p.scatter(
    frequencies, threshold_left, marker="x", size=24, line_color=COLOR_LEFT, line_width=3, legend_label="Left Ear (X)"
)

# X-axis: fixed ticks at standard audiometric frequencies with kHz labels
p.xaxis.ticker = FixedTicker(ticks=[125, 250, 500, 1000, 2000, 4000, 8000])
p.xgrid.ticker = FixedTicker(ticks=[125, 250, 500, 1000, 2000, 4000, 8000])
p.xaxis.major_label_overrides = {125: "125", 250: "250", 500: "500", 1000: "1k", 2000: "2k", 4000: "4k", 8000: "8k"}

# Y-axis: gridlines every 10 dB
p.yaxis.ticker = FixedTicker(ticks=list(range(-10, 130, 10)))

# Text sizes (bokeh 'pt' → CSS pt → ~1.333 source-px; '50pt' ≈ 67 source-px)
p.title.text_font_size = "50pt"
p.xaxis.axis_label_text_font_size = "42pt"
p.yaxis.axis_label_text_font_size = "42pt"
p.xaxis.major_label_text_font_size = "34pt"
p.yaxis.major_label_text_font_size = "34pt"
p.legend.label_text_font_size = "34pt"

# Theme-adaptive chrome
p.background_fill_color = PAGE_BG
p.border_fill_color = PAGE_BG
p.outline_line_color = INK_SOFT

p.title.text_color = INK
p.xaxis.axis_label_text_color = INK
p.yaxis.axis_label_text_color = INK
p.xaxis.major_label_text_color = INK_SOFT
p.yaxis.major_label_text_color = INK_SOFT
p.xaxis.axis_line_color = INK_SOFT
p.yaxis.axis_line_color = INK_SOFT
p.xaxis.major_tick_line_color = INK_SOFT
p.yaxis.major_tick_line_color = INK_SOFT

p.xgrid.grid_line_color = INK
p.ygrid.grid_line_color = INK
p.xgrid.grid_line_alpha = 0.15
p.ygrid.grid_line_alpha = 0.15

p.legend.background_fill_color = ELEVATED_BG
p.legend.border_line_color = INK_SOFT
p.legend.label_text_color = INK_SOFT
p.legend.location = "top_right"

# Save interactive HTML
output_file(f"plot-{THEME}.html")
save(p)

# Screenshot via Selenium — window taller than target so browser chrome
# overhead doesn't clip the figure; PIL crops to exact 2400×2400 canvas.
FIG_W, FIG_H = 2400, 2400
WIN_W, WIN_H = FIG_W, FIG_H + 200
opts = Options()
for arg in (
    "--headless=new",
    "--no-sandbox",
    "--disable-dev-shm-usage",
    "--disable-gpu",
    f"--window-size={WIN_W},{WIN_H}",
    "--hide-scrollbars",
):
    opts.add_argument(arg)
driver = webdriver.Chrome(options=opts)
driver.set_window_size(WIN_W, WIN_H)
driver.get(f"file://{Path(f'plot-{THEME}.html').resolve()}")
time.sleep(3)
raw = driver.get_screenshot_as_png()
driver.quit()
Image.open(io.BytesIO(raw)).crop((0, 0, FIG_W, FIG_H)).save(f"plot-{THEME}.png")
Runnable source as JSON, for any HTTP client: https://api.anyplot.ai/specs/audiogram-clinical/bokeh/code. Any spec id and library id listed in llms-full.txt fit the same URL shape; every URL below is complete and callable.
{
  "spec_id": "audiogram-clinical",
  "language": "python",
  "library": "bokeh",
  "page": "https://anyplot.ai/audiogram-clinical/python/bokeh",
  "hub": "https://anyplot.ai/audiogram-clinical",
  "code_json": "https://api.anyplot.ai/specs/audiogram-clinical/bokeh/code",
  "spec_json": "https://api.anyplot.ai/specs/audiogram-clinical",
  "render_light_png": "https://storage.googleapis.com/anyplot-images/plots/audiogram-clinical/python/bokeh/plot-light.png",
  "render_dark_png": "https://storage.googleapis.com/anyplot-images/plots/audiogram-clinical/python/bokeh/plot-dark.png",
  "interactive_light_html": "https://storage.googleapis.com/anyplot-images/plots/audiogram-clinical/python/bokeh/plot-light.html",
  "interactive_dark_html": "https://storage.googleapis.com/anyplot-images/plots/audiogram-clinical/python/bokeh/plot-dark.html",
  "quality_score": 87.0,
  "license": "MIT",
  "guide": "https://anyplot.ai/llms.txt"
}
Part of Clinical Audiogram on anyplot.ai.