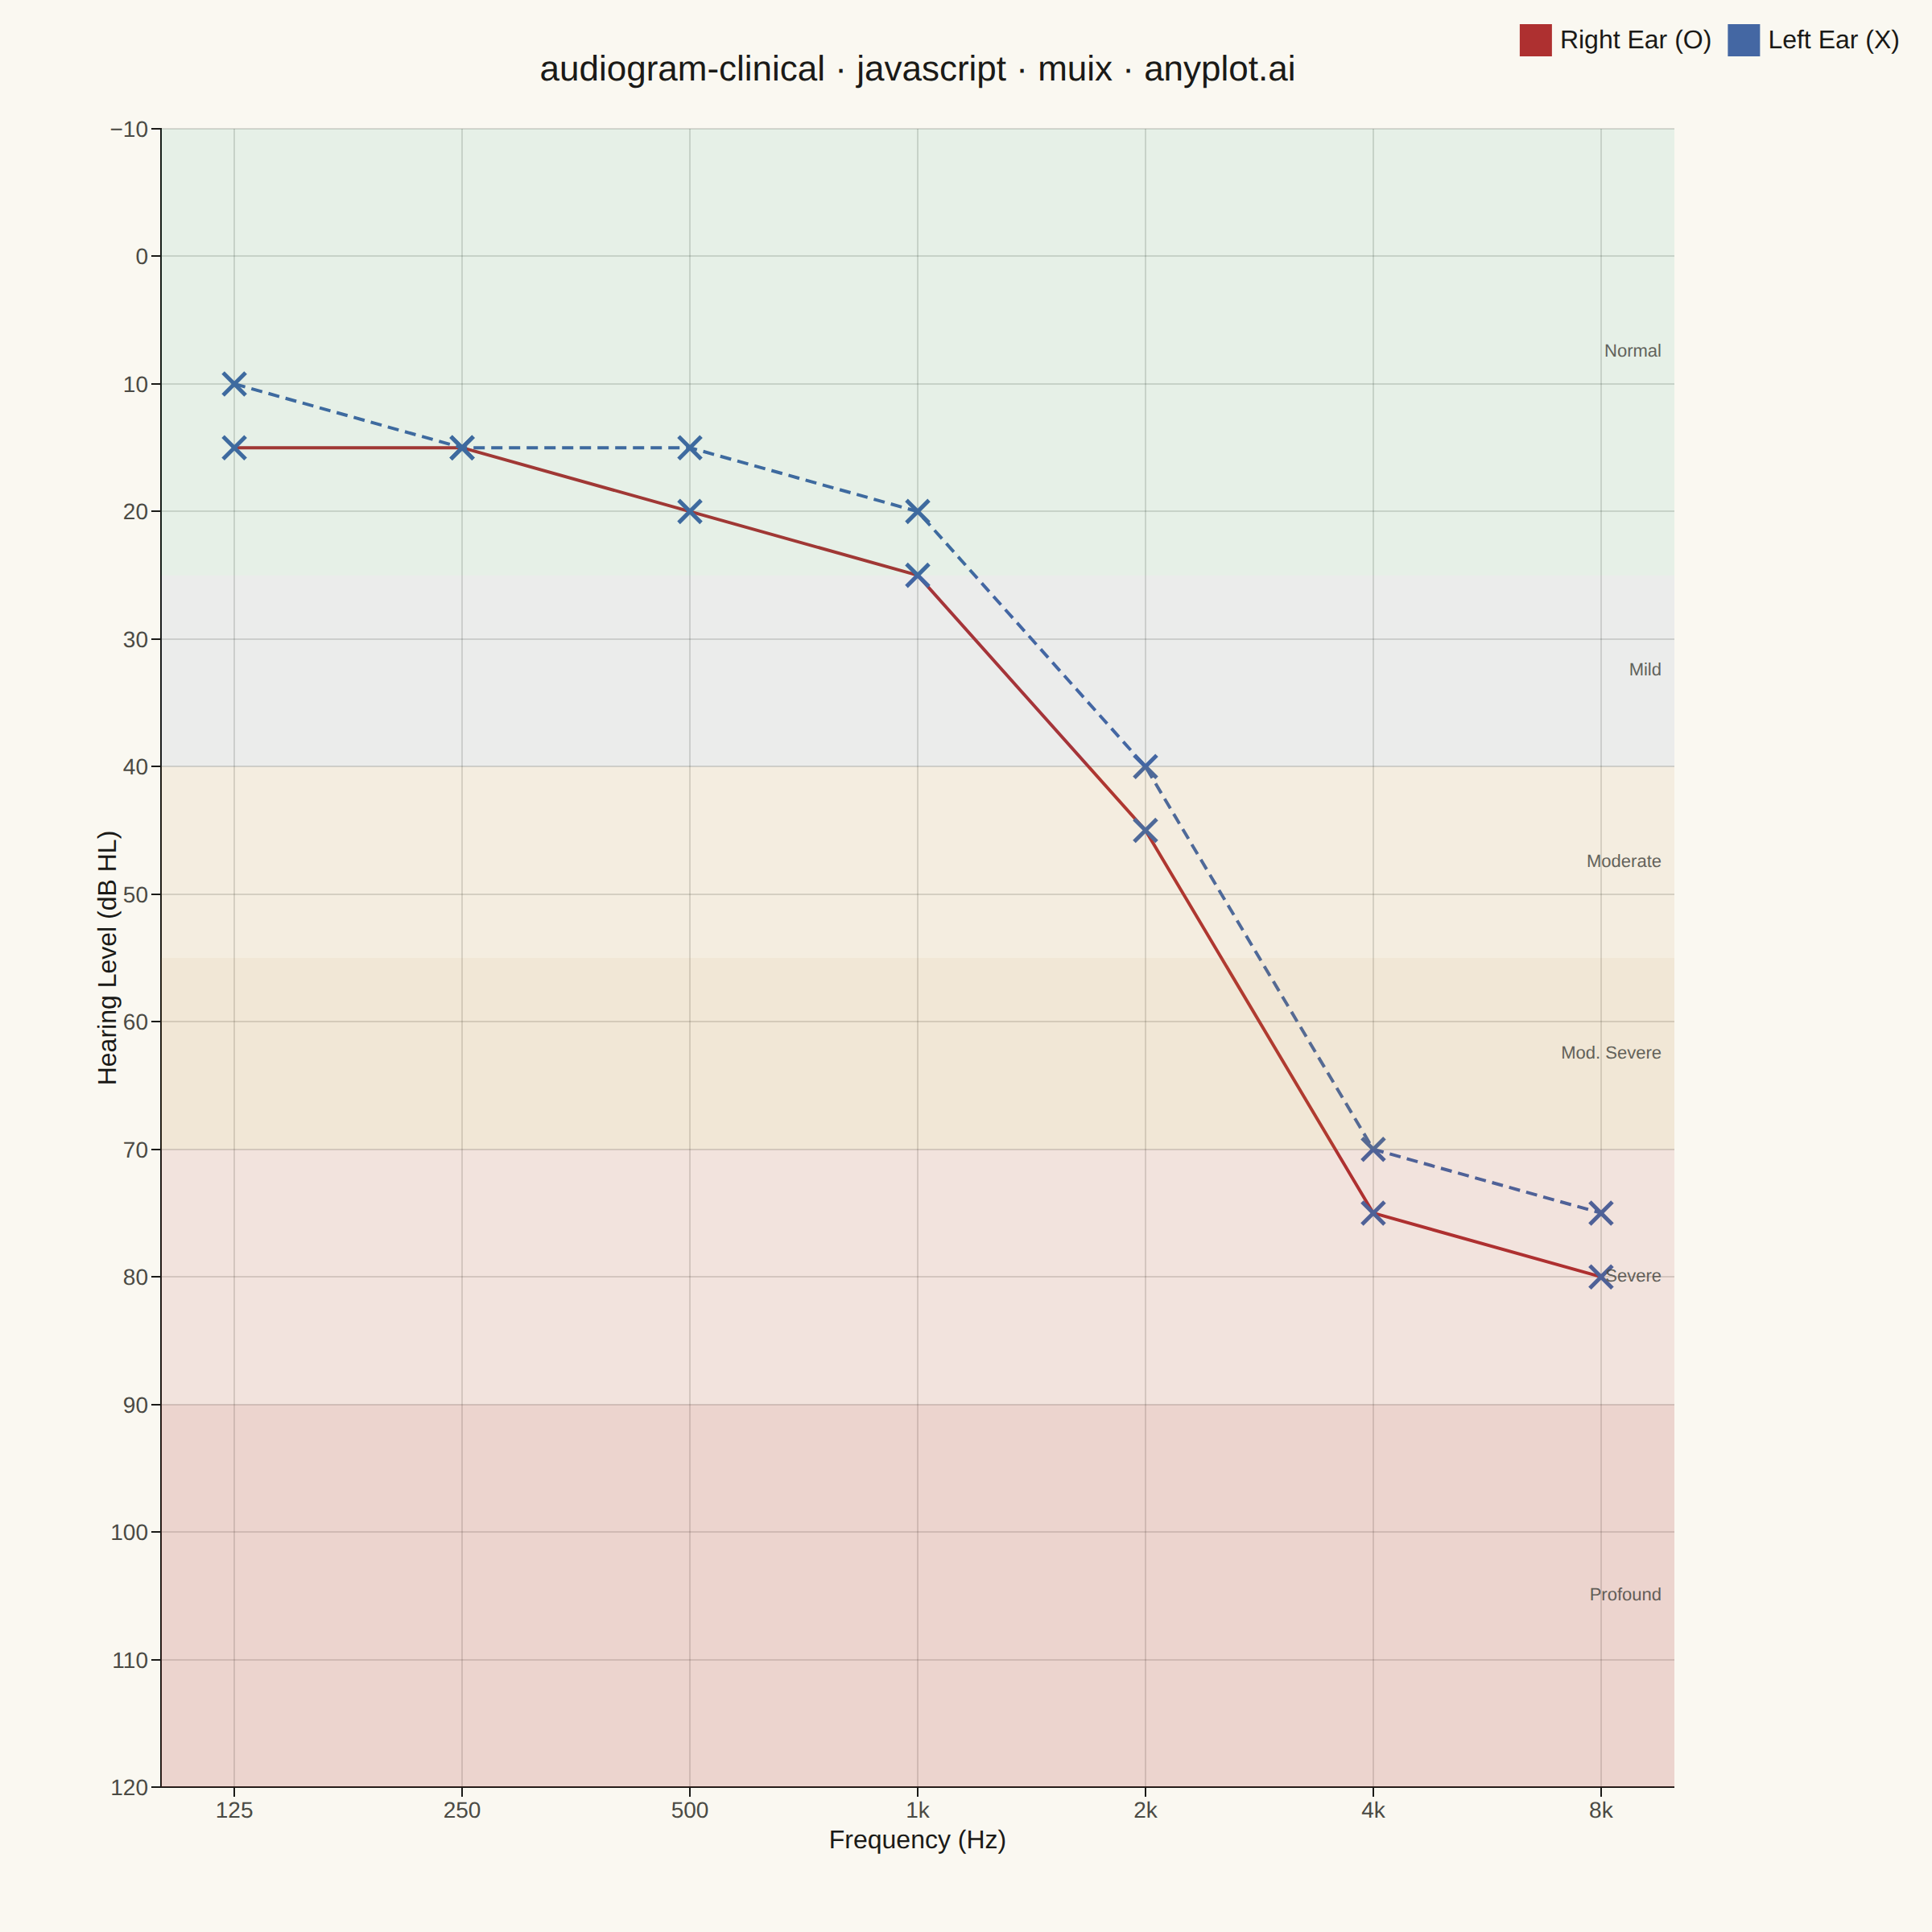
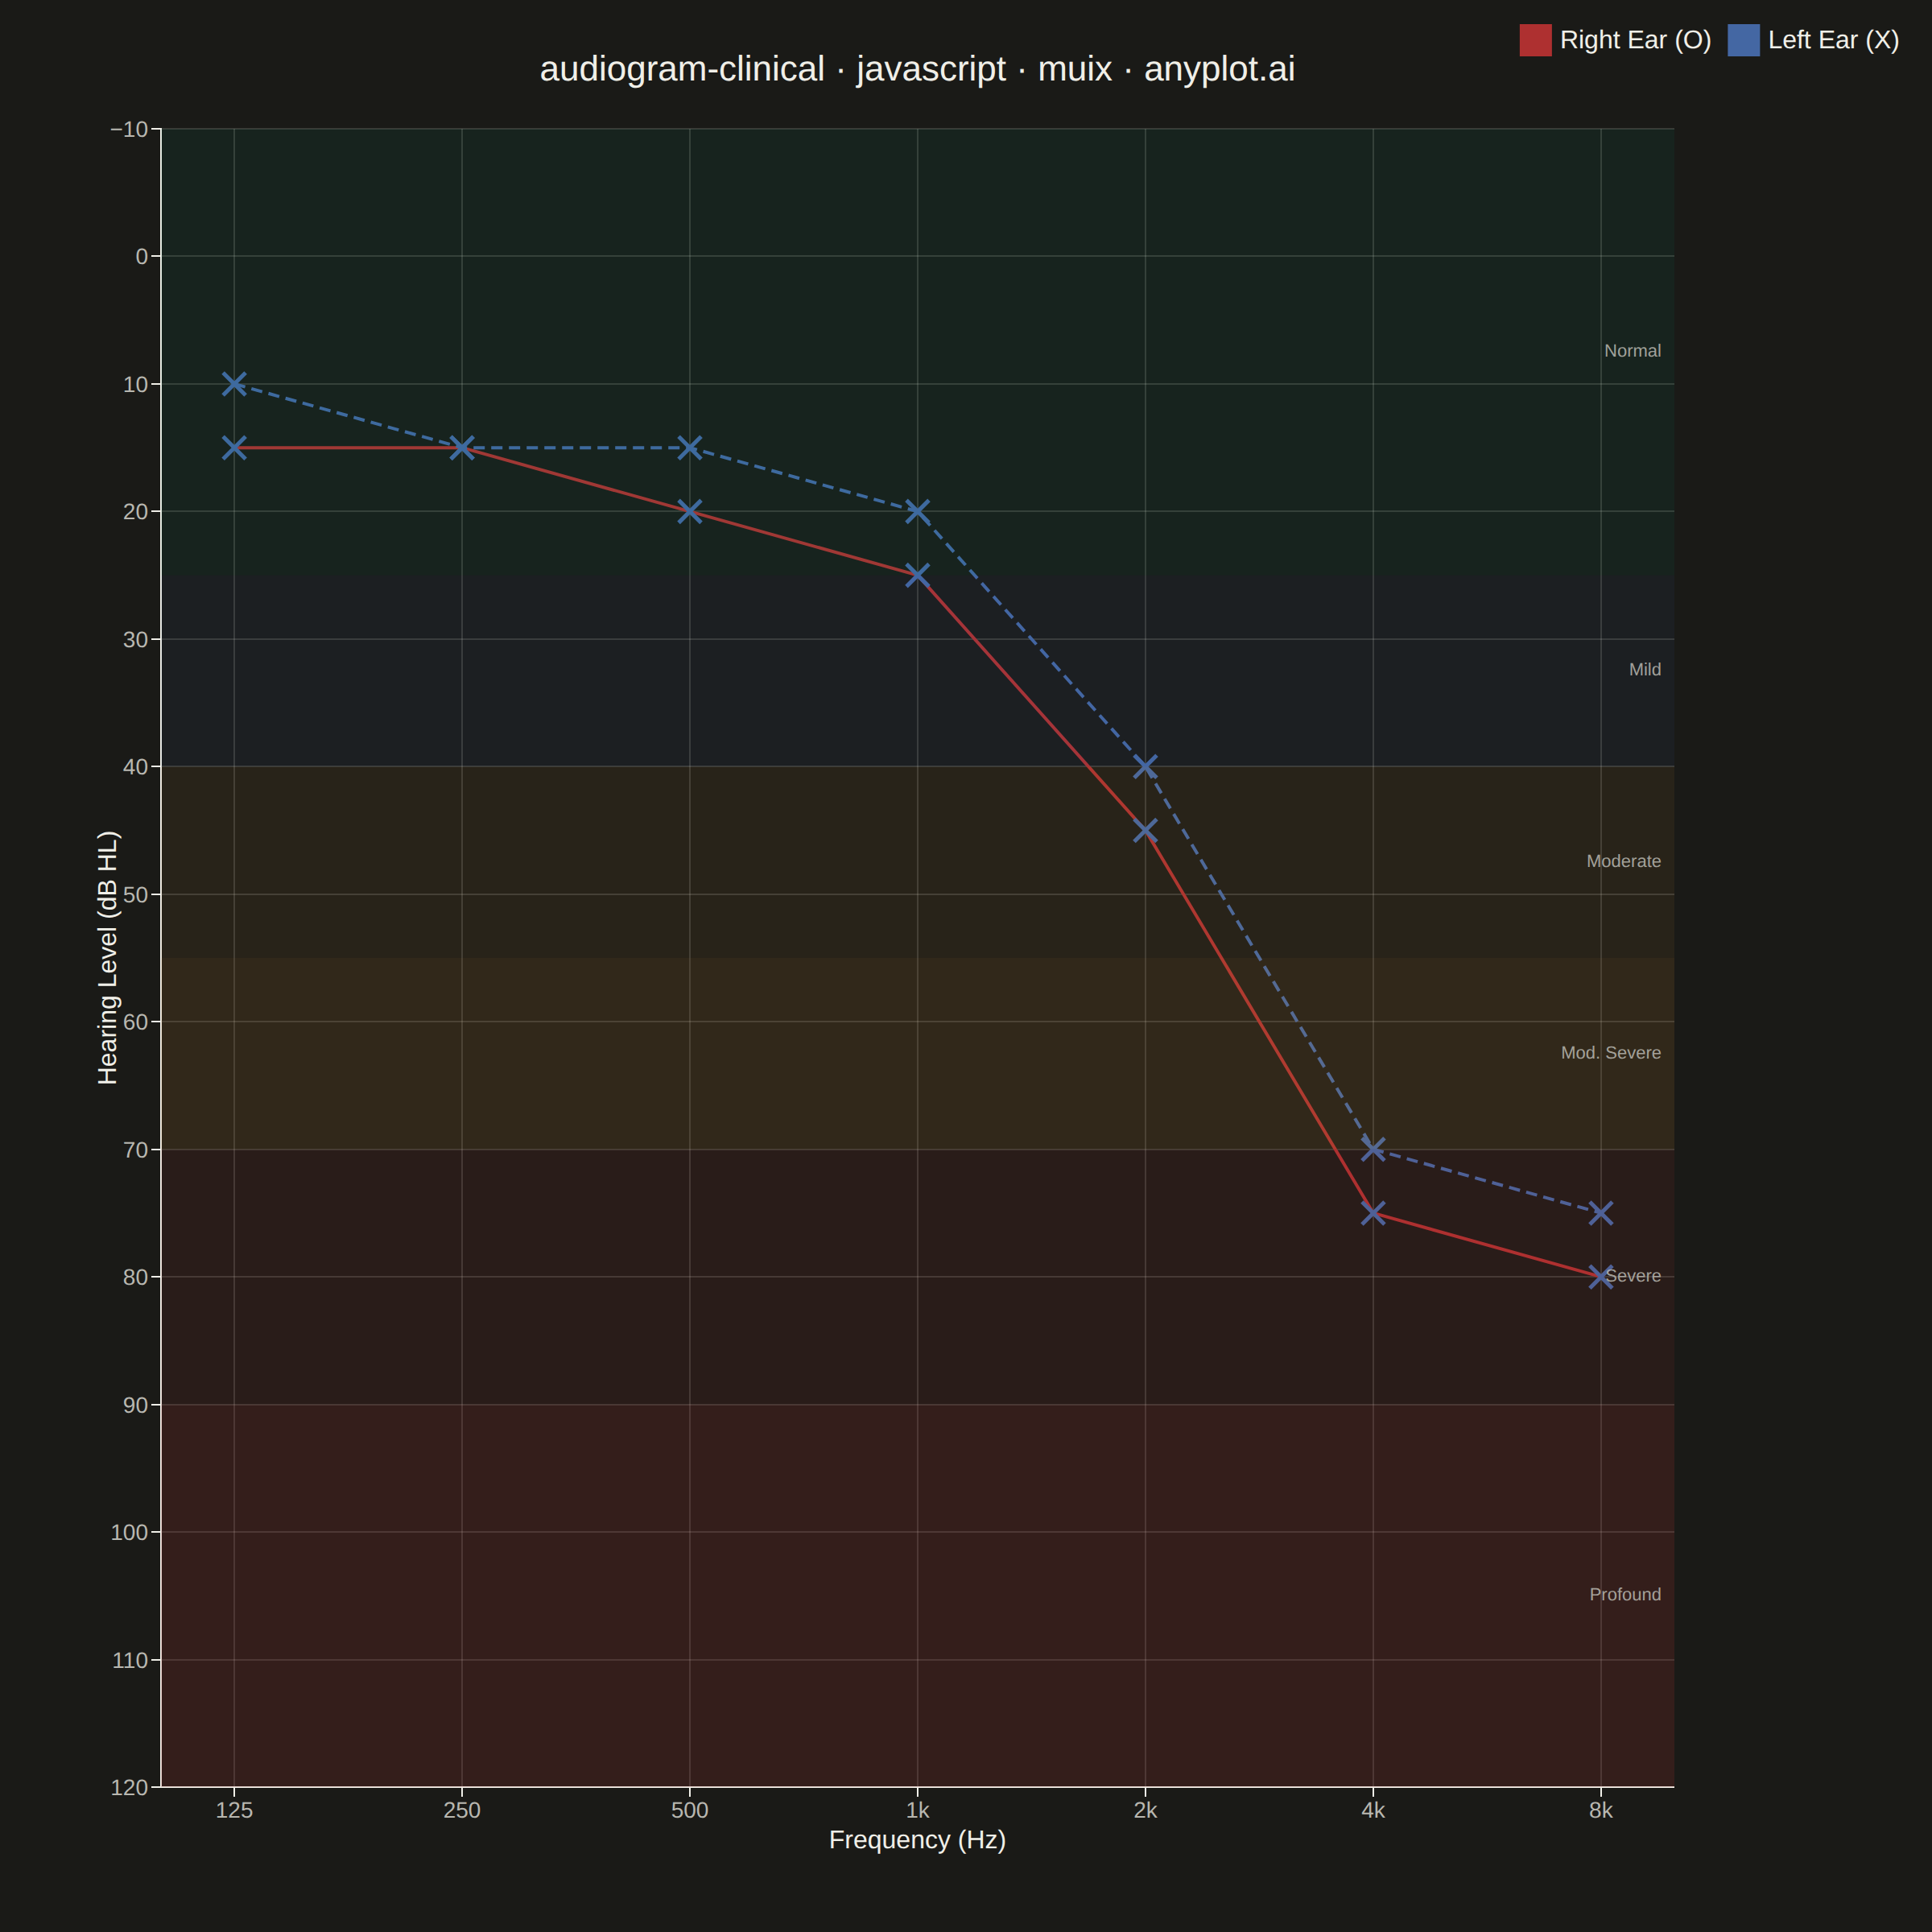
A standardized clinical audiogram that displays hearing test results, plotting hearing threshold (dB HL) against test frequency for each ear. The y-axis is inverted so that 0 dB HL (best hearing) sits at the top and increasing hearing loss extends downward, while the x-axis is logarithmic spanning the standard audiometric frequencies (125 Hz to 8 kHz). Thresholds are marked with the conventional symbols — a circle (O) for the right ear in red and a cross (X) for the left ear in blue — and connected per ear, with shaded horizontal bands indicating severity of hearing loss (normal, mild, moderate, severe, profound).
// anyplot.ai
// audiogram-clinical: Clinical Audiogram
// Library: muix 7.29.1 | JavaScript 22.22.3
// Quality: 91/100 | Created: 2026-06-15
//# anyplot-orientation: square
// anyplot.ai
// audiogram-clinical: Clinical Audiogram
// Library: MUI X Charts | React | Node 22
// License: @mui/x-charts — MIT (community). Pro/Premium are out of scope.
// Quality: pending | Created: 2026-06-15
import * as React from "react";
import { LineChart } from "@mui/x-charts/LineChart";
import { useDrawingArea, useYScale } from "@mui/x-charts/hooks";

const t = window.ANYPLOT_TOKENS;

// Clinical audiogram — occupational health screening, noise-induced high-freq notch
const FREQUENCIES = [125, 250, 500, 1000, 2000, 4000, 8000];
const RIGHT_EAR   = [15, 15, 20, 25, 45, 75, 80];
const LEFT_EAR    = [10, 15, 15, 20, 40, 70, 75];


// Semantic colors: matte red for right (clinical convention), Imprint blue for left
const RIGHT_COLOR = "#AE3030";
const LEFT_COLOR  = "#4467A3";

// ASHA severity bands with Imprint palette fills
const BANDS = [
  { label: "Normal",        yMin: -10, yMax:  25, hex: "#009E73", alpha: 0.08 },
  { label: "Mild",          yMin:  25, yMax:  40, hex: "#4467A3", alpha: 0.08 },
  { label: "Moderate",      yMin:  40, yMax:  55, hex: "#BD8233", alpha: 0.09 },
  { label: "Mod. Severe",   yMin:  55, yMax:  70, hex: "#BD8233", alpha: 0.14 },
  { label: "Severe",        yMin:  70, yMax:  90, hex: "#AE3030", alpha: 0.10 },
  { label: "Profound",      yMin:  90, yMax: 120, hex: "#AE3030", alpha: 0.18 },
];

// Horizontal severity bands drawn behind the data
function SeverityBands() {
  const { left, top, width, height } = useDrawingArea();
  const yScale = useYScale("dBHL") as ((v: number) => number) | undefined;
  if (!yScale) return null;
  return (
    <g>
      {BANDS.map((band) => {
        const y0   = yScale(band.yMin);
        const y1   = yScale(band.yMax);
        const bTop = Math.min(y0, y1);
        const bH   = Math.abs(y1 - y0);
        return (
          <React.Fragment key={band.label}>
            <rect
              x={left} y={bTop}
              width={width} height={Math.max(bH, 1)}
              fill={band.hex} opacity={band.alpha}
            />
            <text
              x={left + width - 8} y={bTop + bH * 0.5}
              textAnchor="end" dominantBaseline="middle"
              fontSize={11} fill={t.inkSoft} opacity={0.85}
            >
              {band.label}
            </text>
          </React.Fragment>
        );
      })}
    </g>
  );
}

// Centered chart title above the drawing area
function ChartTitle() {
  const { left, top, width } = useDrawingArea();
  return (
    <text
      x={left + width / 2} y={top - 30}
      textAnchor="middle"
      fontSize={22} fontWeight="500"
      fill={t.ink}
    >
      {"audiogram-clinical · javascript · muix · anyplot.ai"}
    </text>
  );
}

// O mark — open circle for right ear (clinical convention)
const RightMark = ({ x = 0, y = 0 }: any) => (
  <circle cx={x} cy={y} r={10} fill="none" stroke={RIGHT_COLOR} strokeWidth={2.5} />
);

// X mark — cross for left ear (clinical convention)
const LeftMark = ({ x = 0, y = 0 }: any) => {
  const d = 7;
  return (
    <g>
      <line x1={x - d} y1={y - d} x2={x + d} y2={y + d} stroke={LEFT_COLOR} strokeWidth={2.5} />
      <line x1={x + d} y1={y - d} x2={x - d} y2={y + d} stroke={LEFT_COLOR} strokeWidth={2.5} />
    </g>
  );
};

const MarkDispatcher = (props: any) =>
  props.seriesId === "right" ? <RightMark {...props} /> : <LeftMark {...props} />;

export default function Chart() {
  return (
    <LineChart
      width={window.ANYPLOT_SIZE.width}
      height={window.ANYPLOT_SIZE.height}
      skipAnimation
      xAxis={[{
        id: "freq",
        scaleType: "log",
        data: FREQUENCIES,
        tickInterval: FREQUENCIES,
        valueFormatter: (v: number) => v >= 1000 ? `${v / 1000}k` : `${v}`,
        label: "Frequency (Hz)",
        labelStyle: { fontSize: 16, fill: t.ink },
        tickLabelStyle: { fontSize: 14, fill: t.inkSoft },
      }]}
      yAxis={[{
        id: "dBHL",
        min: -10,
        max: 120,
        reverse: true,
        tickNumber: 14,
        label: "Hearing Level (dB HL)",
        labelStyle: { fontSize: 16, fill: t.ink },
        tickLabelStyle: { fontSize: 14, fill: t.inkSoft },
      }]}
      series={[
        {
          id: "right",
          data: RIGHT_EAR,
          color: RIGHT_COLOR,
          label: "Right Ear (O)",
          showMark: true,
          curve: "linear",
        },
        {
          id: "left",
          data: LEFT_EAR,
          color: LEFT_COLOR,
          label: "Left Ear (X)",
          showMark: true,
          curve: "linear",
        },
      ]}
      slots={{ mark: MarkDispatcher }}
      grid={{ horizontal: true, vertical: true }}
      sx={{
        "& .MuiLineElement-series-left": { strokeDasharray: "7 4" },
        "& .MuiChartsAxis-line": { stroke: t.inkSoft, strokeWidth: 1 },
        "& .MuiChartsAxis-tick": { stroke: t.inkSoft },
        "& .MuiChartsGrid-line": { stroke: t.grid },
      }}
      margin={{ top: 80, bottom: 90, left: 100, right: 160 }}
      legend={{ position: { vertical: "top", horizontal: "right" } }}
    >
      <SeverityBands />
      <ChartTitle />
    </LineChart>
  );
}
Runnable source as JSON, for any HTTP client: https://api.anyplot.ai/specs/audiogram-clinical/muix/code. Any spec id and library id listed in llms-full.txt fit the same URL shape; every URL below is complete and callable.
{
  "spec_id": "audiogram-clinical",
  "language": "javascript",
  "library": "muix",
  "page": "https://anyplot.ai/audiogram-clinical/javascript/muix",
  "hub": "https://anyplot.ai/audiogram-clinical",
  "code_json": "https://api.anyplot.ai/specs/audiogram-clinical/muix/code",
  "spec_json": "https://api.anyplot.ai/specs/audiogram-clinical",
  "render_light_png": "https://storage.googleapis.com/anyplot-images/plots/audiogram-clinical/javascript/muix/plot-light.png",
  "render_dark_png": "https://storage.googleapis.com/anyplot-images/plots/audiogram-clinical/javascript/muix/plot-dark.png",
  "interactive_light_html": "https://storage.googleapis.com/anyplot-images/plots/audiogram-clinical/javascript/muix/plot-light.html",
  "interactive_dark_html": "https://storage.googleapis.com/anyplot-images/plots/audiogram-clinical/javascript/muix/plot-dark.html",
  "quality_score": 91.0,
  "license": "MIT",
  "guide": "https://anyplot.ai/llms.txt"
}
Part of Clinical Audiogram on anyplot.ai.