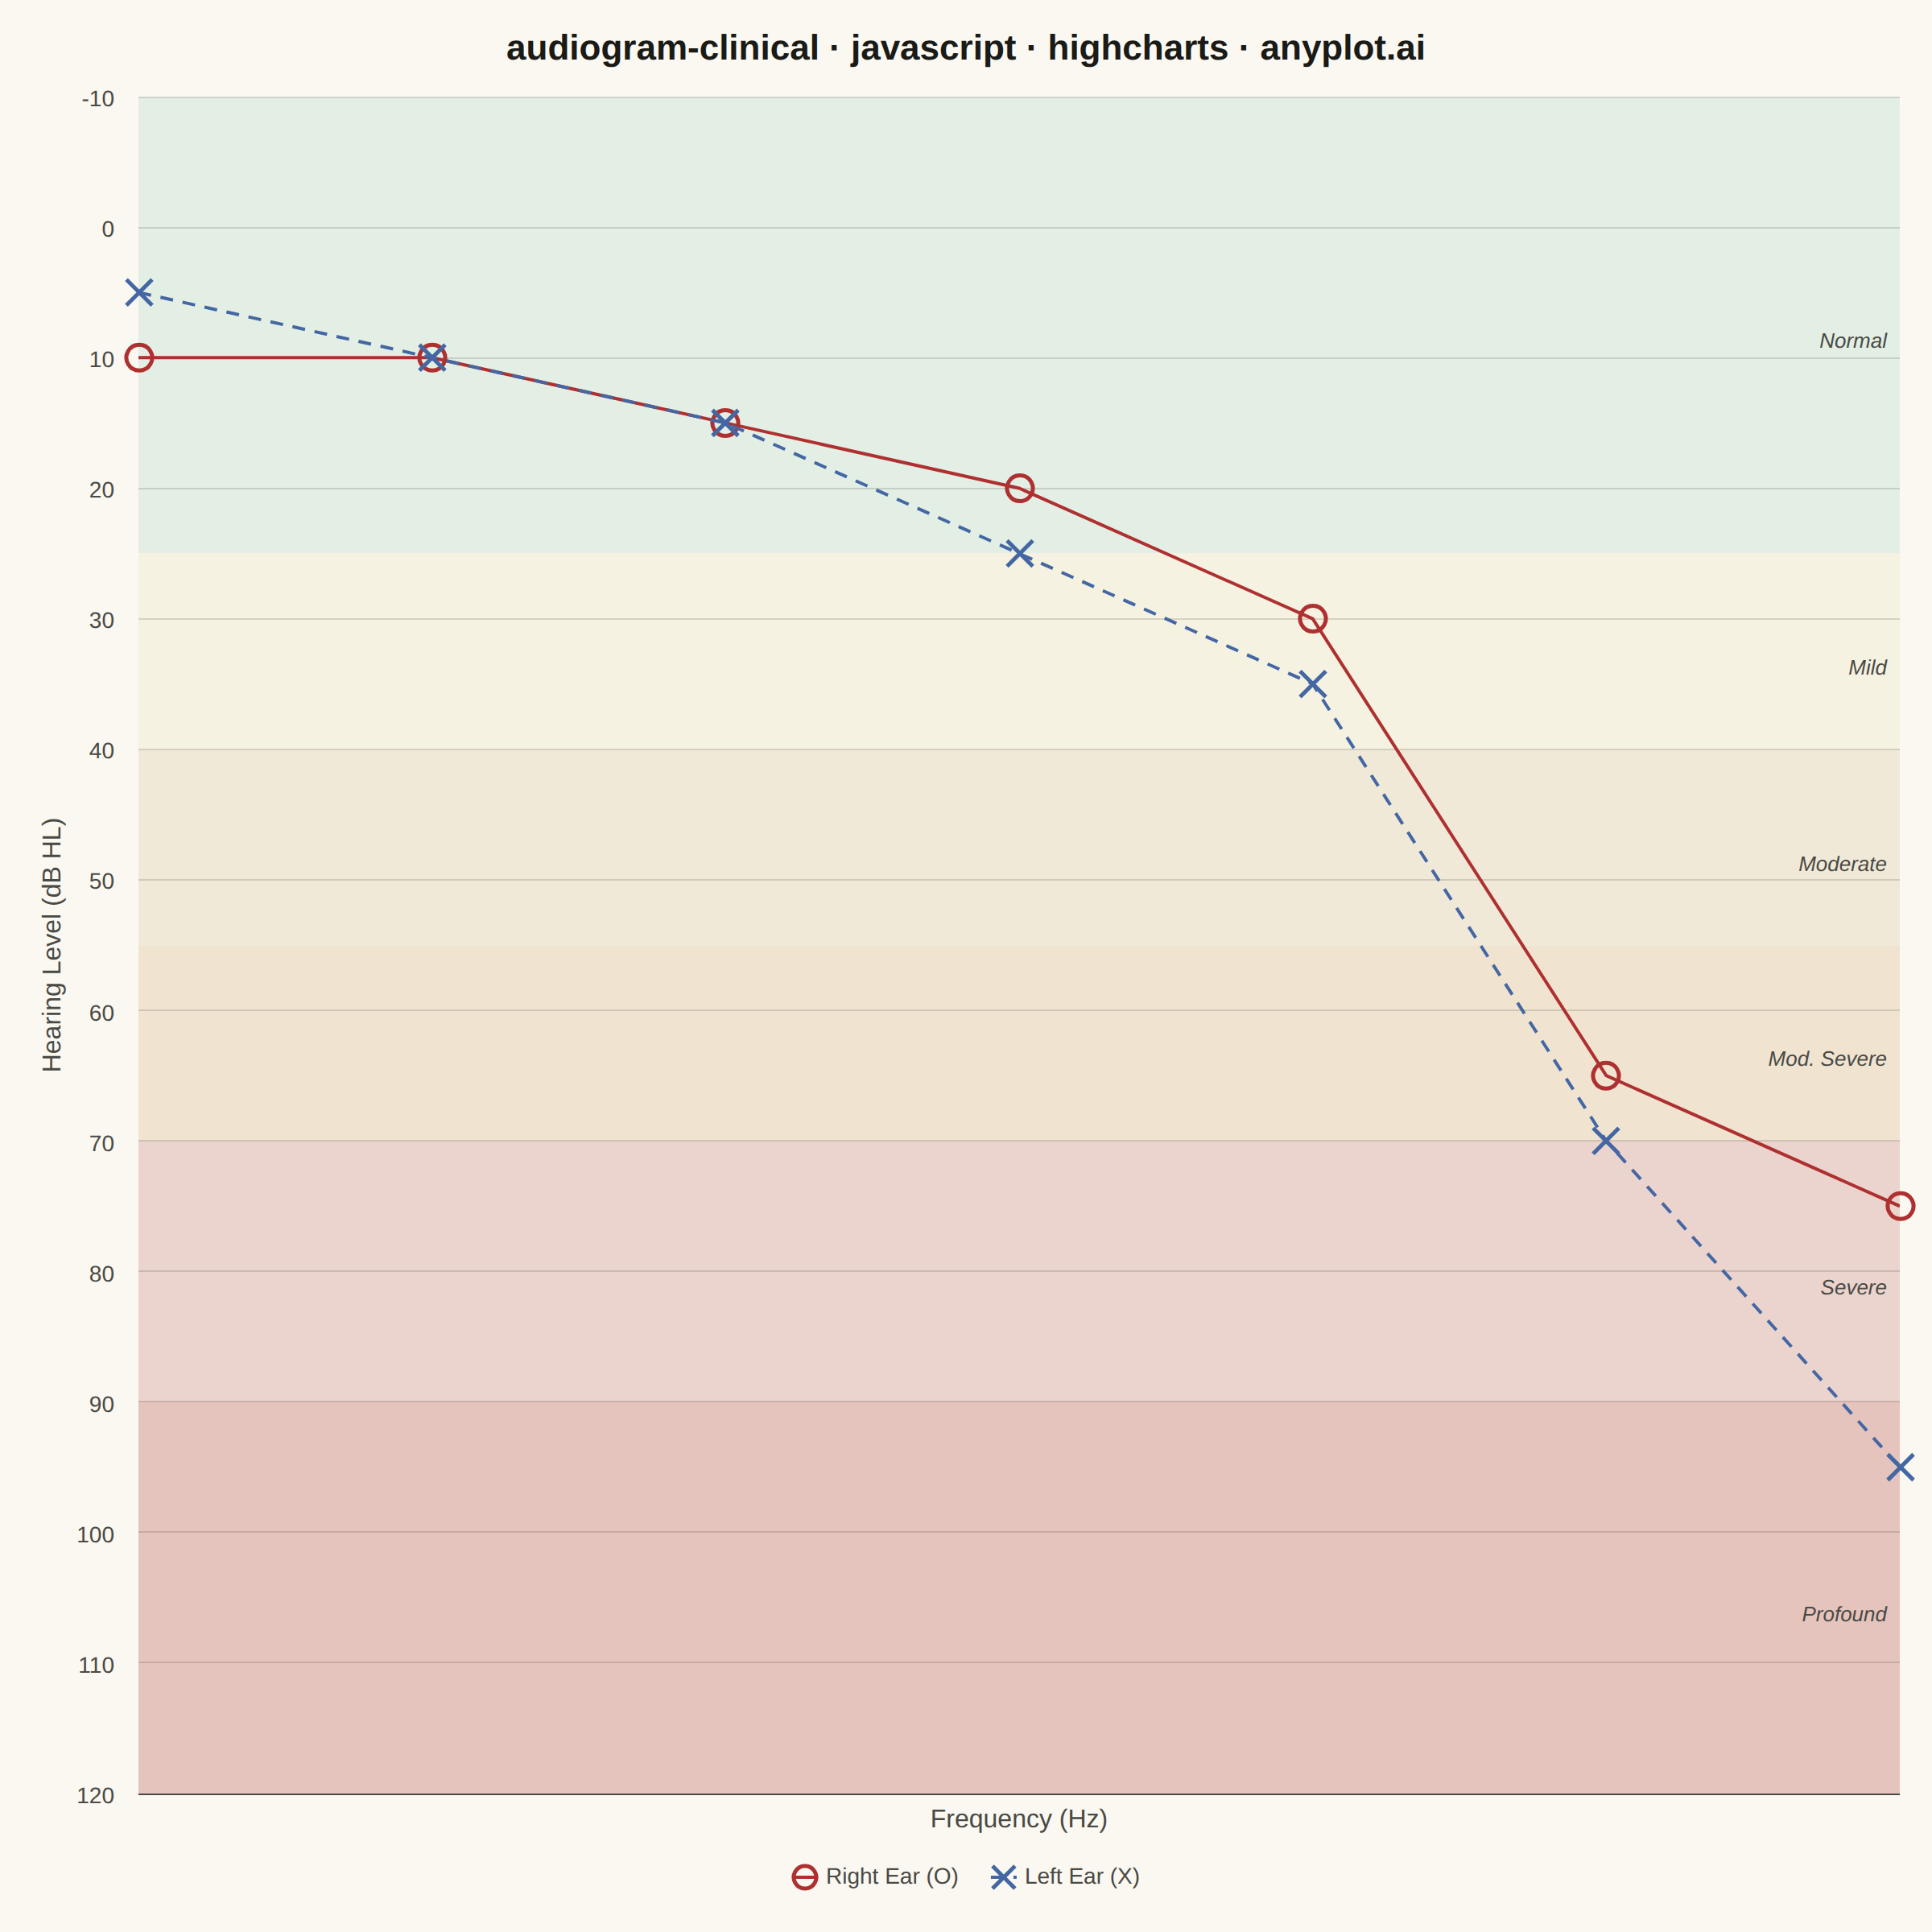
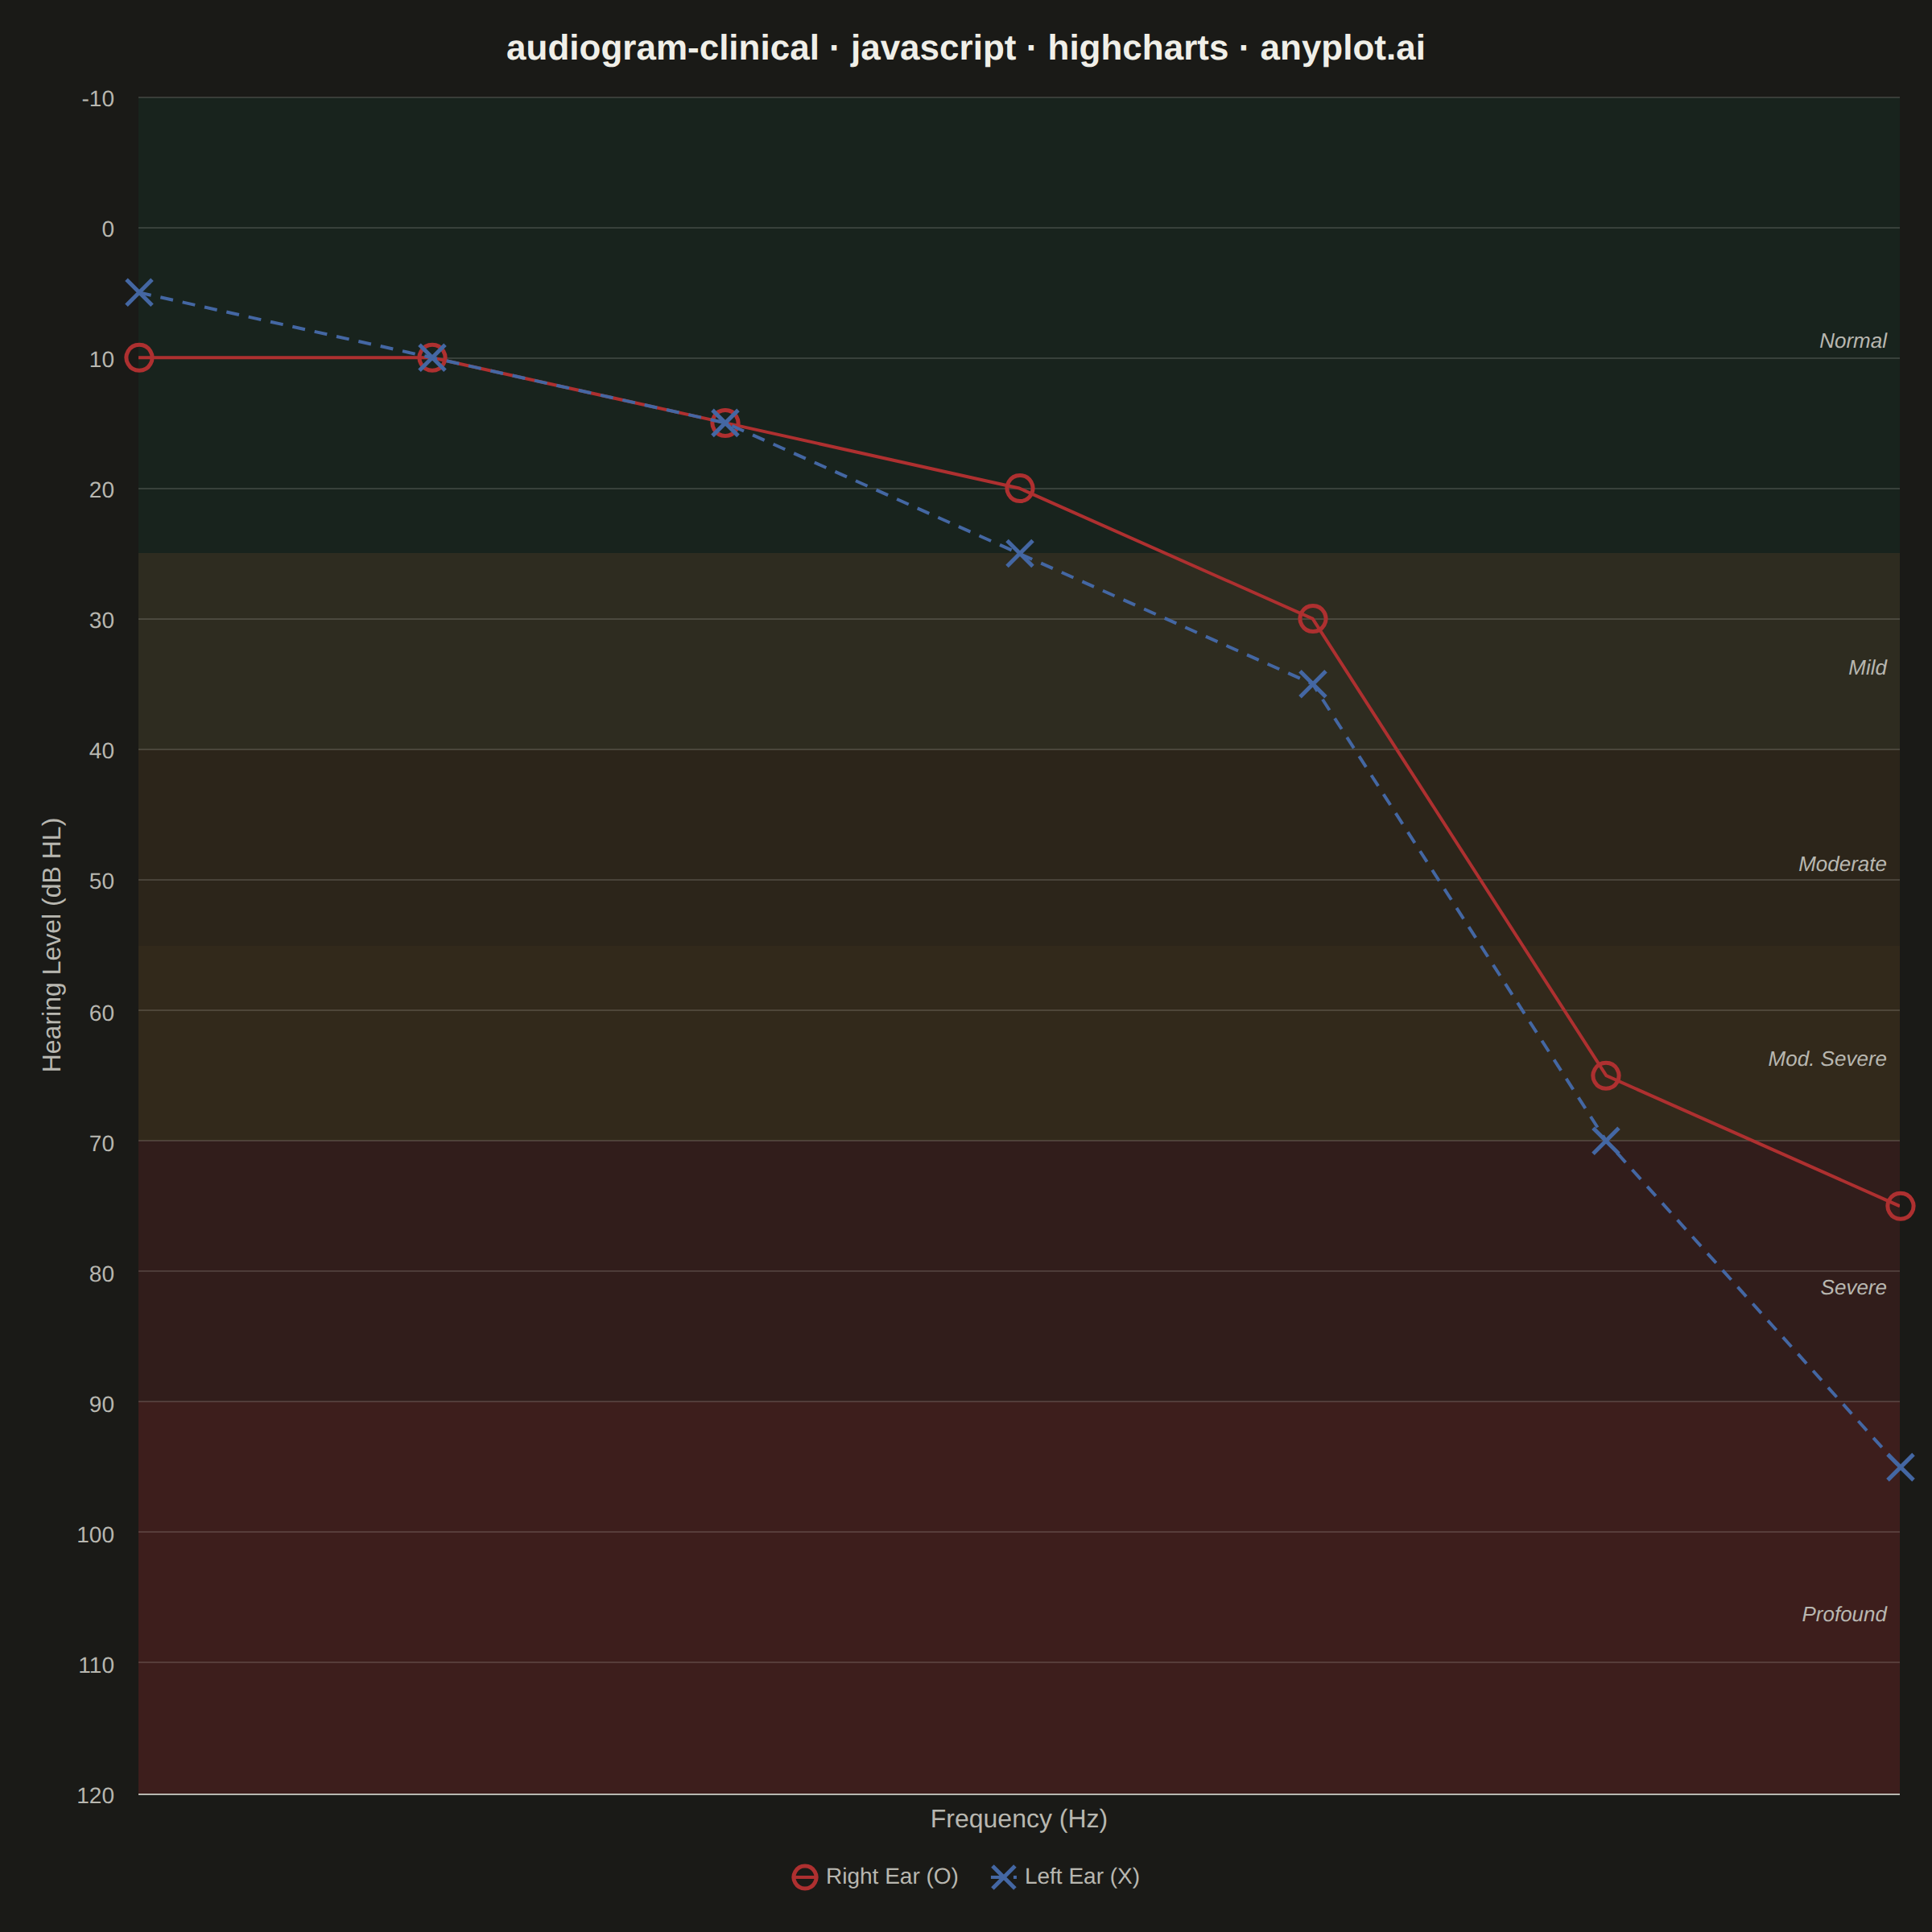
A standardized clinical audiogram that displays hearing test results, plotting hearing threshold (dB HL) against test frequency for each ear. The y-axis is inverted so that 0 dB HL (best hearing) sits at the top and increasing hearing loss extends downward, while the x-axis is logarithmic spanning the standard audiometric frequencies (125 Hz to 8 kHz). Thresholds are marked with the conventional symbols — a circle (O) for the right ear in red and a cross (X) for the left ear in blue — and connected per ear, with shaded horizontal bands indicating severity of hearing loss (normal, mild, moderate, severe, profound).
// anyplot.ai
// audiogram-clinical: Clinical Audiogram
// Library: highcharts 12.6.0 | JavaScript 22.22.3
// Quality: 92/100 | Updated: 2026-06-15
//# anyplot-orientation: square

const t = window.ANYPLOT_TOKENS;

// Semantic color exception: clinical convention — red = right ear, blue = left ear
const RIGHT_COLOR = '#AE3030'; // Imprint slot 5 (matte red)
const LEFT_COLOR  = '#4467A3'; // Imprint slot 3 (blue)

// Custom X-shaped marker symbol for the left ear (two diagonal strokes)
Highcharts.SVGRenderer.prototype.symbols.xcross = function (x, y, w, h) {
    return ['M', x, y, 'L', x + w, y + h, 'M', x + w, y, 'L', x, y + h];
};

// Data: high-frequency sensorineural notch — typical noise-induced hearing loss pattern
const frequencies = [125, 250, 500, 1000, 2000, 4000, 8000];
const rightThresh = [10,  10,  15,  20,   30,   65,   75];  // dB HL, right ear
const leftThresh  = [5,   10,  15,  25,   35,   70,   95];  // dB HL, left ear — 95 dB enters Profound zone

const rightData = frequencies.map((f, i) => [f, rightThresh[i]]);
const leftData  = frequencies.map((f, i) => [f, leftThresh[i]]);

// Severity band fill — lighter on dark theme to avoid heavy banding on near-black bg
const a = window.ANYPLOT_THEME === 'dark' ? 0.07 : 0.09;

Highcharts.chart('container', {
    chart: {
        backgroundColor: 'transparent',
        animation: false,
        style: { fontFamily: 'inherit' },
        spacing: [20, 20, 20, 20],
        plotBorderWidth: 0,
    },
    credits: { enabled: false },
    colors: t.palette,

    title: {
        text: 'audiogram-clinical · javascript · highcharts · anyplot.ai',
        style: { color: t.ink, fontSize: '22px', fontWeight: '600' },
    },

    xAxis: {
        type: 'logarithmic',
        min: 125,
        max: 8000,
        tickPositions: [125, 250, 500, 1000, 2000, 4000, 8000],
        lineColor: t.inkSoft,
        tickColor: t.inkSoft,
        gridLineColor: t.grid,
        gridLineWidth: 1,
        title: {
            text: 'Frequency (Hz)',
            style: { color: t.inkSoft, fontSize: '16px' },
        },
        labels: {
            style: { color: t.inkSoft, fontSize: '14px' },
            formatter() {
                const v = this.value;
                return v >= 1000 ? (v / 1000) + 'k' : String(v);
            },
        },
    },

    yAxis: {
        reversed: true,
        min: -10,
        max: 120,
        tickInterval: 10,
        lineColor: t.inkSoft,
        tickColor: t.inkSoft,
        gridLineColor: t.grid,
        gridLineWidth: 1,
        title: {
            text: 'Hearing Level (dB HL)',
            style: { color: t.inkSoft, fontSize: '16px' },
        },
        labels: {
            style: { color: t.inkSoft, fontSize: '14px' },
            format: '{value}',
        },
        plotBands: [
            {
                from: -10, to: 25,
                color: `rgba(0,158,115,${a})`,
                label: {
                    text: 'Normal', align: 'right', x: -8, y: 14,
                    style: { color: t.inkSoft, fontSize: '13px', fontStyle: 'italic' },
                },
            },
            {
                from: 25, to: 40,
                color: `rgba(221,204,119,${a + 0.03})`,
                label: {
                    text: 'Mild', align: 'right', x: -8, y: 14,
                    style: { color: t.inkSoft, fontSize: '13px', fontStyle: 'italic' },
                },
            },
            {
                from: 40, to: 55,
                color: `rgba(189,130,51,${a + 0.04})`,
                label: {
                    text: 'Moderate', align: 'right', x: -8, y: 14,
                    style: { color: t.inkSoft, fontSize: '13px', fontStyle: 'italic' },
                },
            },
            {
                from: 55, to: 70,
                color: `rgba(189,130,51,${a + 0.08})`,
                label: {
                    text: 'Mod. Severe', align: 'right', x: -8, y: 14,
                    style: { color: t.inkSoft, fontSize: '13px', fontStyle: 'italic' },
                },
            },
            {
                from: 70, to: 90,
                color: `rgba(174,48,48,${a + 0.09})`,
                label: {
                    text: 'Severe', align: 'right', x: -8, y: 14,
                    style: { color: t.inkSoft, fontSize: '13px', fontStyle: 'italic' },
                },
            },
            {
                from: 90, to: 120,
                color: `rgba(174,48,48,${a + 0.17})`,
                label: {
                    text: 'Profound', align: 'right', x: -8, y: 14,
                    style: { color: t.inkSoft, fontSize: '13px', fontStyle: 'italic' },
                },
            },
        ],
    },

    legend: {
        enabled: true,
        itemStyle: { color: t.inkSoft, fontSize: '14px' },
        itemHoverStyle: { color: t.ink },
    },

    tooltip: { enabled: false },

    plotOptions: {
        series: {
            animation: false,
        },
    },

    series: [
        {
            name: 'Right Ear (O)',
            type: 'line',
            data: rightData,
            color: RIGHT_COLOR,
            dashStyle: 'Solid',
            lineWidth: 2,
            marker: {
                enabled: true,
                symbol: 'circle',
                radius: 8,
                lineWidth: 2.5,
                lineColor: RIGHT_COLOR,
                fillColor: 'transparent',
            },
        },
        {
            name: 'Left Ear (X)',
            type: 'line',
            data: leftData,
            color: LEFT_COLOR,
            dashStyle: 'Dash',
            lineWidth: 2,
            marker: {
                enabled: true,
                symbol: 'xcross',
                radius: 8,
                lineWidth: 2.5,
                lineColor: LEFT_COLOR,
                fillColor: 'transparent',
            },
        },
    ],
});
Runnable source as JSON, for any HTTP client: https://api.anyplot.ai/specs/audiogram-clinical/highcharts/code. Any spec id and library id listed in llms-full.txt fit the same URL shape; every URL below is complete and callable.
{
  "spec_id": "audiogram-clinical",
  "language": "javascript",
  "library": "highcharts",
  "page": "https://anyplot.ai/audiogram-clinical/javascript/highcharts",
  "hub": "https://anyplot.ai/audiogram-clinical",
  "code_json": "https://api.anyplot.ai/specs/audiogram-clinical/highcharts/code",
  "spec_json": "https://api.anyplot.ai/specs/audiogram-clinical",
  "render_light_png": "https://storage.googleapis.com/anyplot-images/plots/audiogram-clinical/javascript/highcharts/plot-light.png",
  "render_dark_png": "https://storage.googleapis.com/anyplot-images/plots/audiogram-clinical/javascript/highcharts/plot-dark.png",
  "interactive_light_html": "https://storage.googleapis.com/anyplot-images/plots/audiogram-clinical/javascript/highcharts/plot-light.html",
  "interactive_dark_html": "https://storage.googleapis.com/anyplot-images/plots/audiogram-clinical/javascript/highcharts/plot-dark.html",
  "quality_score": 92.0,
  "license": "MIT",
  "guide": "https://anyplot.ai/llms.txt"
}
Part of Clinical Audiogram on anyplot.ai.