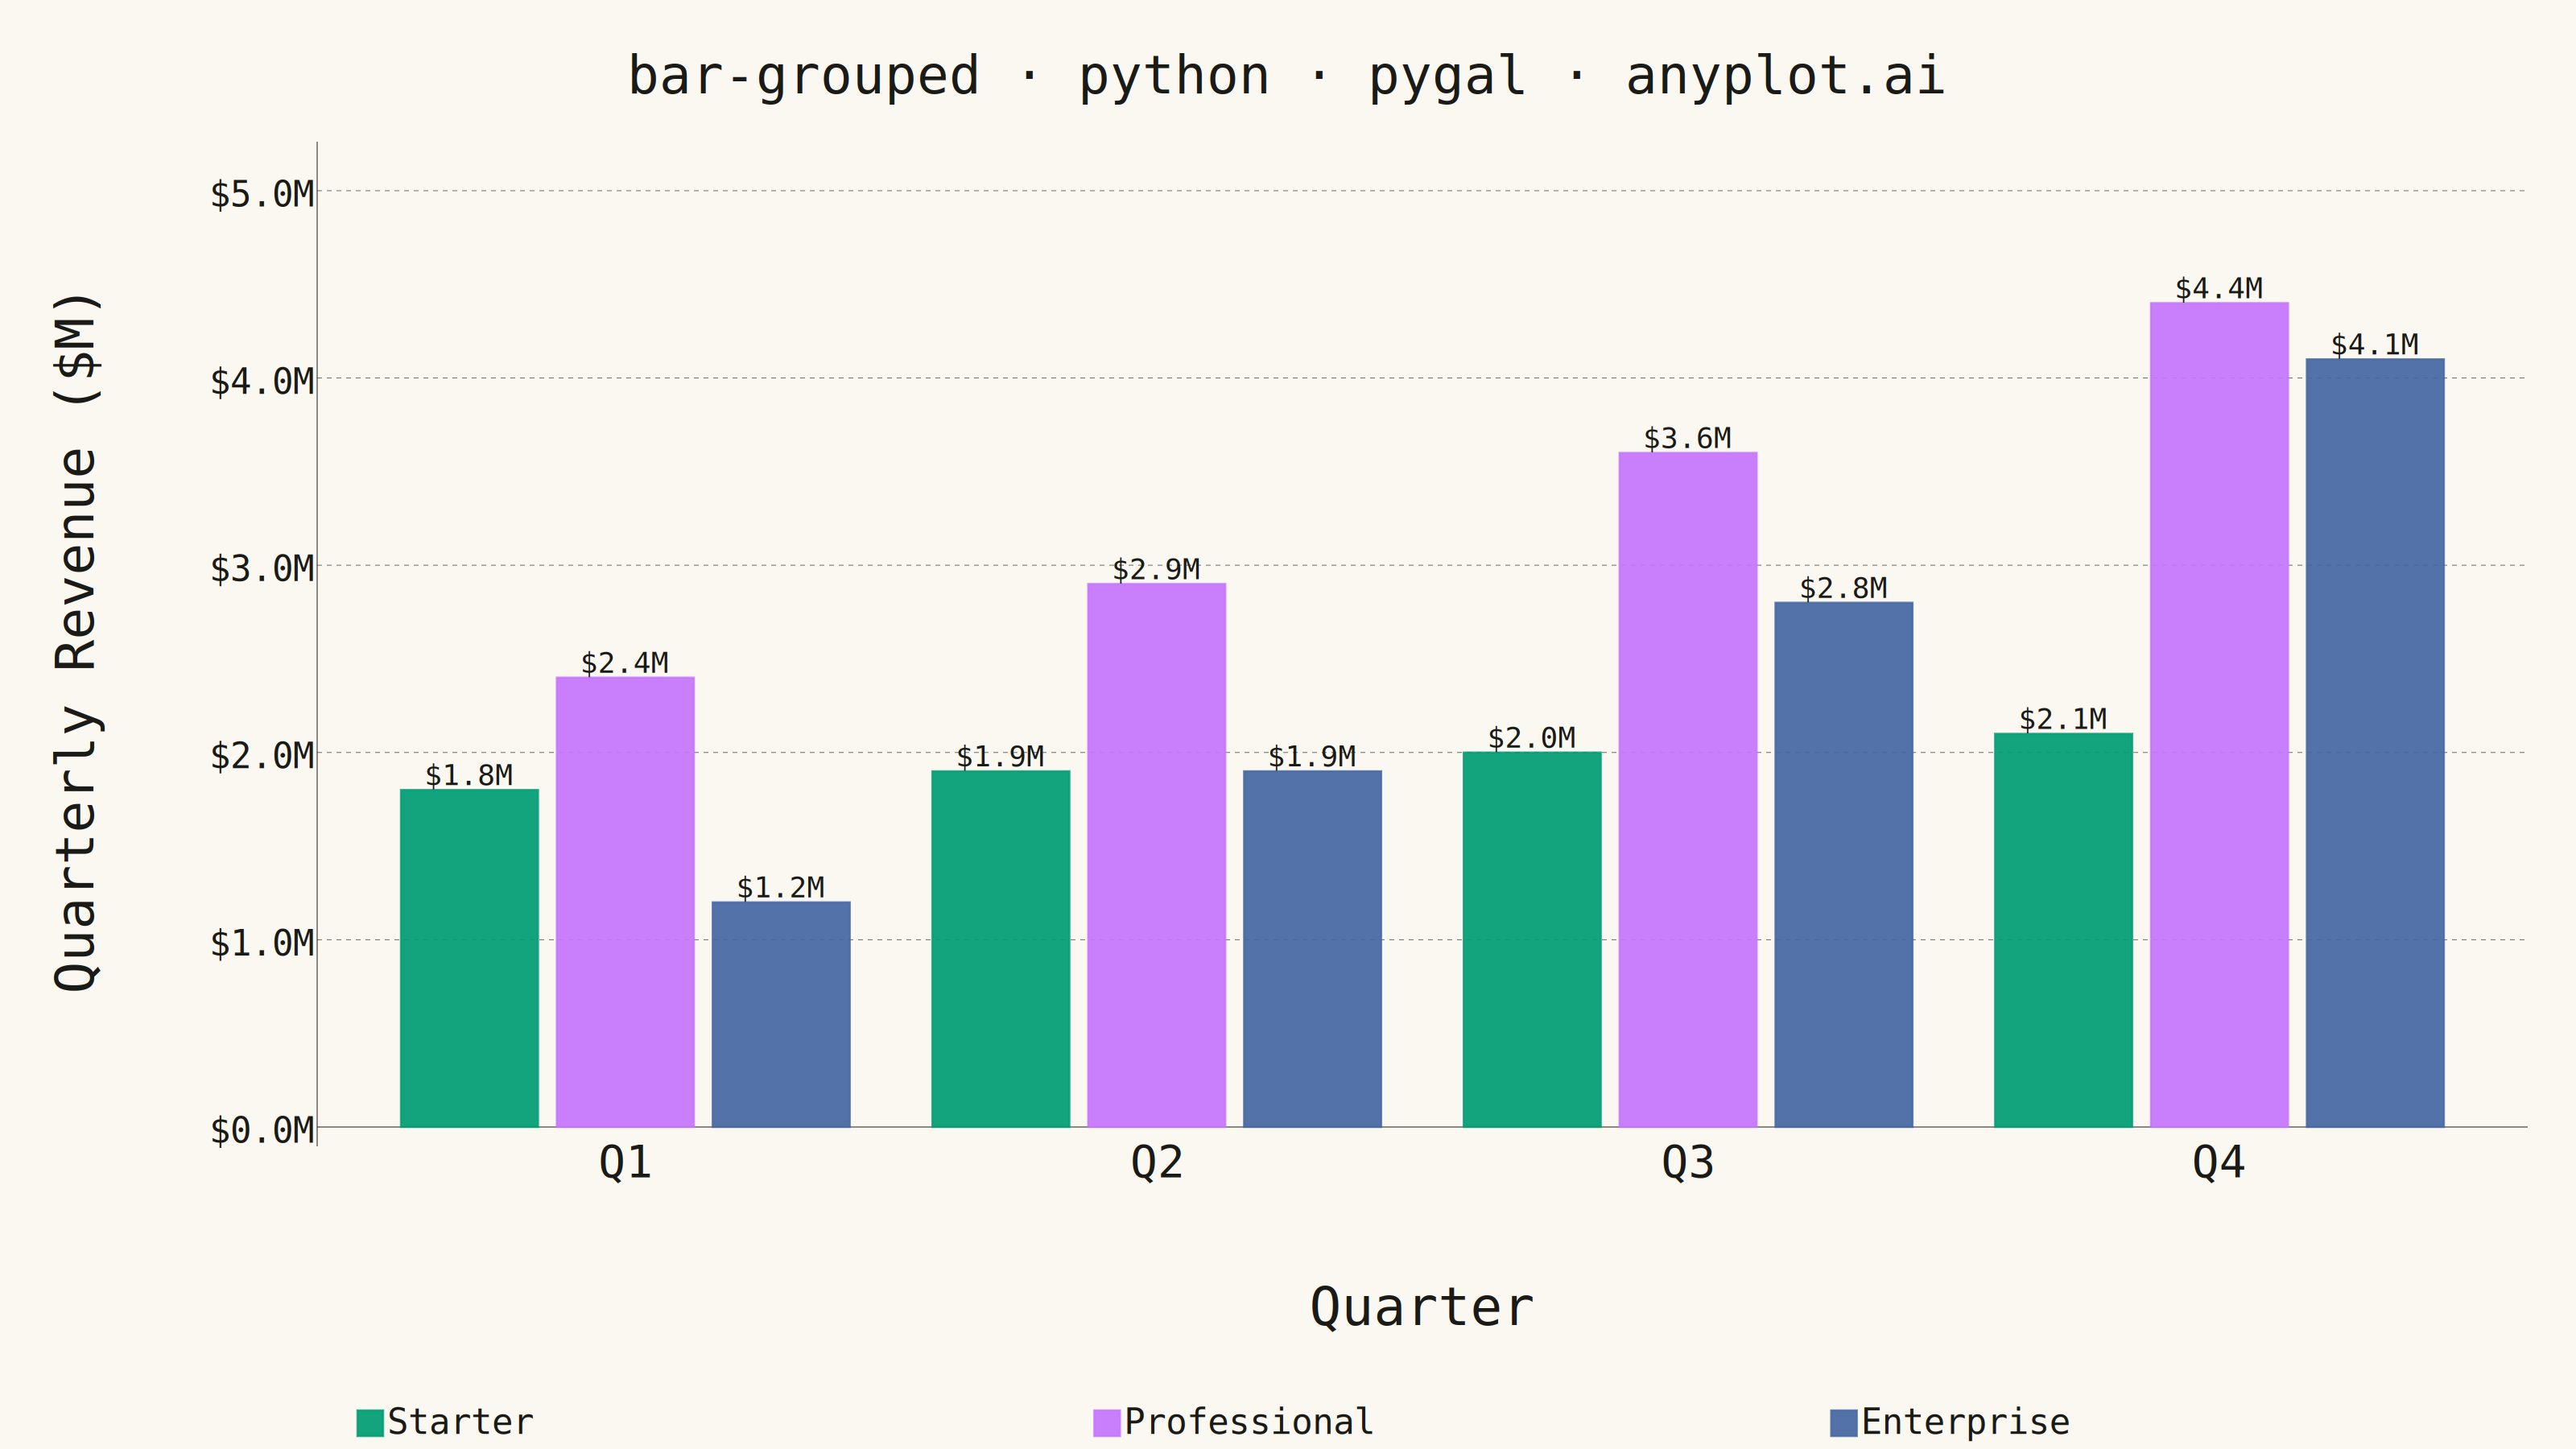
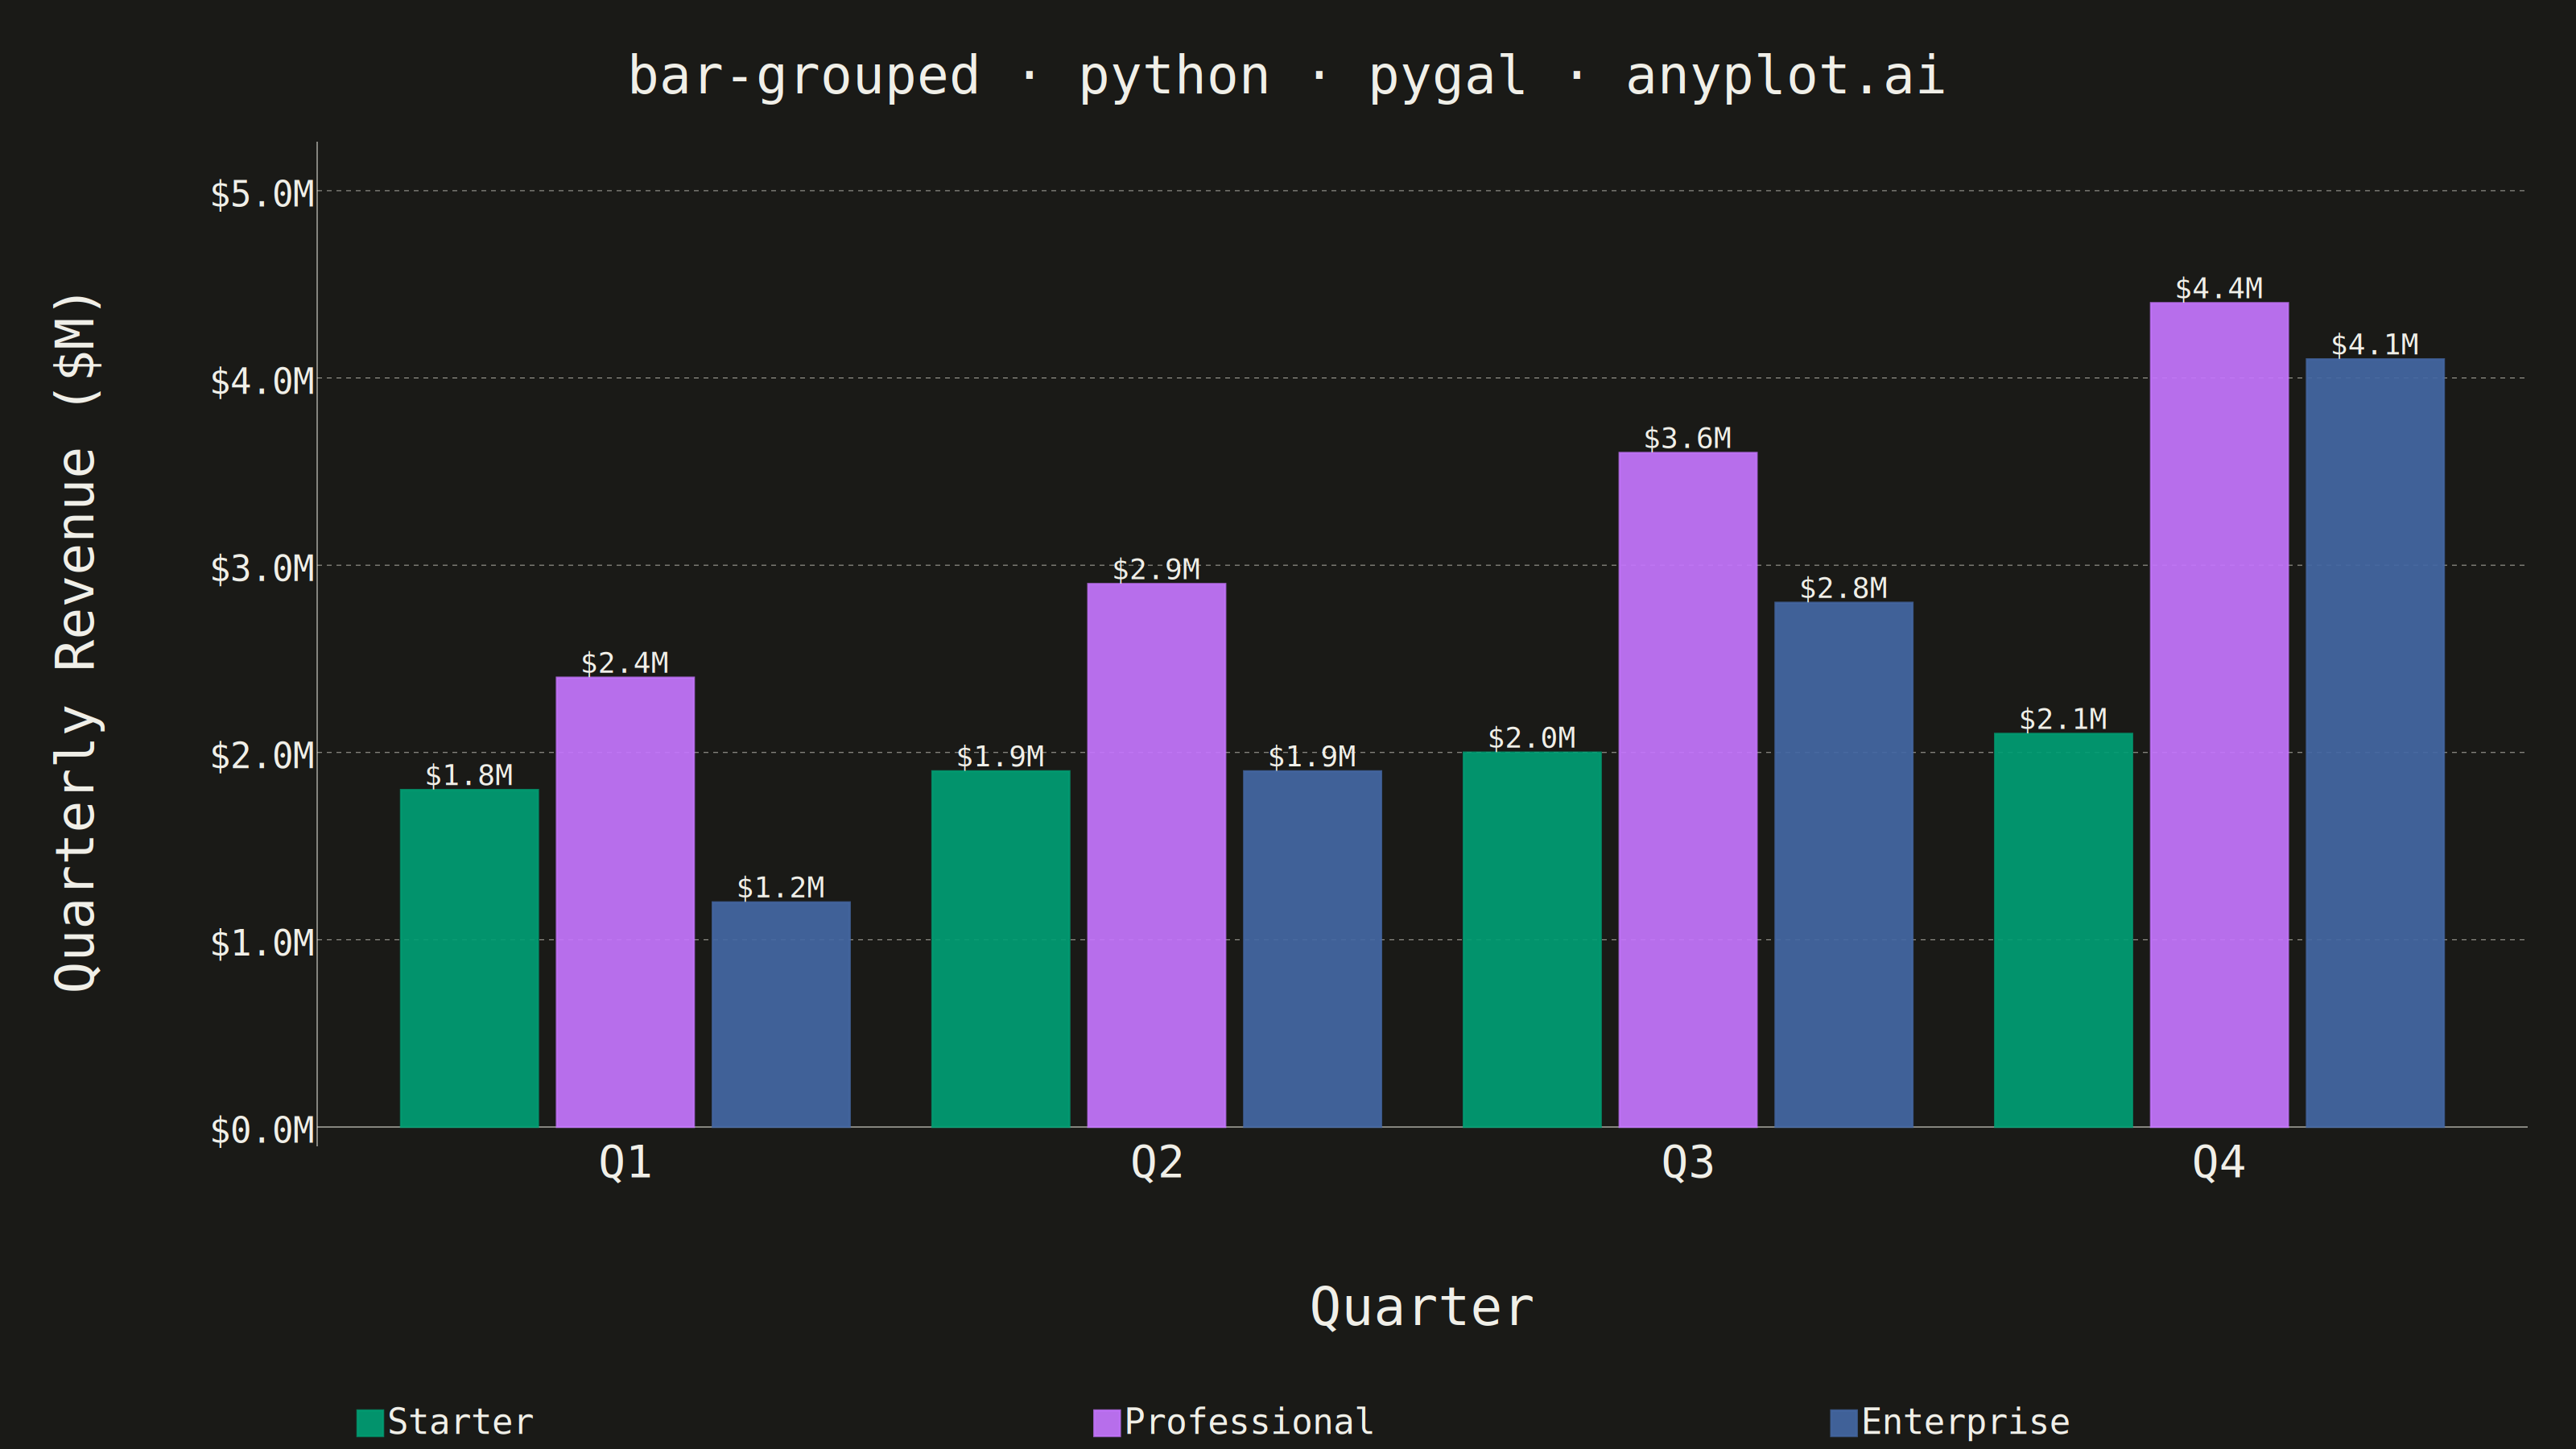
A grouped bar chart that displays multiple bars side-by-side for each category, enabling direct comparison of values across different groups within the same categorical dimension. This visualization excels at showing how different groups perform relative to each other across multiple categories, making patterns and differences immediately apparent. Grouped bar charts are essential for comparative analysis where you need to track multiple series against the same set of categories.
""" anyplot.ai
bar-grouped: Grouped Bar Chart
Library: pygal 3.1.3 | Python 3.13.14
Quality: 91/100 | Updated: 2026-08-05
"""

import os

import pygal
from pygal.style import Style


# Theme tokens (see prompts/default-style-guide.md "Background" + "Theme-adaptive Chrome")
THEME = os.getenv("ANYPLOT_THEME", "light")
PAGE_BG = "#FAF8F1" if THEME == "light" else "#1A1A17"
INK = "#1A1A17" if THEME == "light" else "#F0EFE8"
INK_SOFT = "#4A4A44" if THEME == "light" else "#B8B7B0"
INK_MUTED = "#6B6A63" if THEME == "light" else "#A8A79F"

# Imprint categorical palette — first series is always brand green
IMPRINT_PALETTE = ("#009E73", "#C475FD", "#4467A3", "#BD8233", "#AE3030", "#2ABCCD", "#954477", "#99B314")

# Data: Quarterly recurring revenue by subscription tier ($M) — Enterprise
# growth outpaces the other tiers, telling a clear adoption story through the
# data itself rather than through added annotations.
quarters = ["Q1", "Q2", "Q3", "Q4"]
tiers = {"Starter": [1.8, 1.9, 2.0, 2.1], "Professional": [2.4, 2.9, 3.6, 4.4], "Enterprise": [1.2, 1.9, 2.8, 4.1]}

# Style — theme-adaptive chrome, Imprint palette, sizing tuned for 3200x1800
custom_style = Style(
    background=PAGE_BG,
    plot_background=PAGE_BG,
    foreground=INK,
    foreground_strong=INK,
    foreground_subtle=INK_MUTED,
    colors=IMPRINT_PALETTE,
    # pygal auto-picks black/white per-bar for print_values based on bar
    # fill lightness, ignoring the theme — force the theme ink color so
    # value labels (drawn above the bar, on the page background) stay
    # legible on both surfaces.
    value_colors=(INK,) * len(tiers),
    # pygal's graph.css ships guide_stroke_color="black" and layers it over
    # style.css's foreground_subtle rule for the same selector, so gridlines
    # render pure black regardless of theme unless overridden here — nearly
    # invisible against the near-black dark-theme background.
    guide_stroke_color=INK_MUTED,
    major_guide_stroke_color=INK_MUTED,
    title_font_size=66,
    label_font_size=56,
    major_label_font_size=44,
    legend_font_size=44,
    value_font_size=36,
    stroke_width=2.5,
    opacity=0.92,
    opacity_hover=1.0,
)

# Chart — grouped bars, y-axis grid only, bottom legend to keep the plot area
# uncluttered. Explicit y_labels (with all of them forced major via
# y_labels_major_count) give the axis a real scale — pygal's auto-picked
# major labels can otherwise collapse to just "$0.0M" at the origin.
chart = pygal.Bar(
    width=3200,
    height=1800,
    style=custom_style,
    title="bar-grouped · python · pygal · anyplot.ai",
    x_title="Quarter",
    y_title="Quarterly Revenue ($M)",
    show_x_guides=False,
    show_y_guides=True,
    y_labels=[0, 1, 2, 3, 4, 5],
    y_labels_major_count=6,
    legend_at_bottom=True,
    legend_at_bottom_columns=3,
    legend_box_size=32,
    margin=60,
    spacing=50,
    print_values=True,
    print_values_position="top",
    value_formatter=lambda x: f"${x:.1f}M",
    tooltip_border_radius=10,
)
chart.x_labels = quarters

for tier, revenue in tiers.items():
    chart.add(tier, revenue)

# Save
chart.render_to_png(f"plot-{THEME}.png")
with open(f"plot-{THEME}.html", "wb") as f:
    f.write(chart.render())
Runnable source as JSON, for any HTTP client: https://api.anyplot.ai/specs/bar-grouped/pygal/code. Any spec id and library id listed in llms-full.txt fit the same URL shape; every URL below is complete and callable.
{
  "spec_id": "bar-grouped",
  "language": "python",
  "library": "pygal",
  "page": "https://anyplot.ai/bar-grouped/python/pygal",
  "hub": "https://anyplot.ai/bar-grouped",
  "code_json": "https://api.anyplot.ai/specs/bar-grouped/pygal/code",
  "spec_json": "https://api.anyplot.ai/specs/bar-grouped",
  "render_light_png": "https://storage.googleapis.com/anyplot-images/plots/bar-grouped/python/pygal/plot-light.png",
  "render_dark_png": "https://storage.googleapis.com/anyplot-images/plots/bar-grouped/python/pygal/plot-dark.png",
  "interactive_light_html": "https://storage.googleapis.com/anyplot-images/plots/bar-grouped/python/pygal/plot-light.html",
  "interactive_dark_html": "https://storage.googleapis.com/anyplot-images/plots/bar-grouped/python/pygal/plot-dark.html",
  "quality_score": 91.0,
  "license": "MIT",
  "guide": "https://anyplot.ai/llms.txt"
}
Part of Grouped Bar Chart on anyplot.ai.