Source code in 15 libraries — Python: Altair, Bokeh, lets-plot, Matplotlib, Plotly, plotnine, Pygal, Seaborn; R: ggplot2; Julia: Makie.jl; JavaScript: Chart.js, D3.js, Apache ECharts, Highcharts, MUI X Charts.
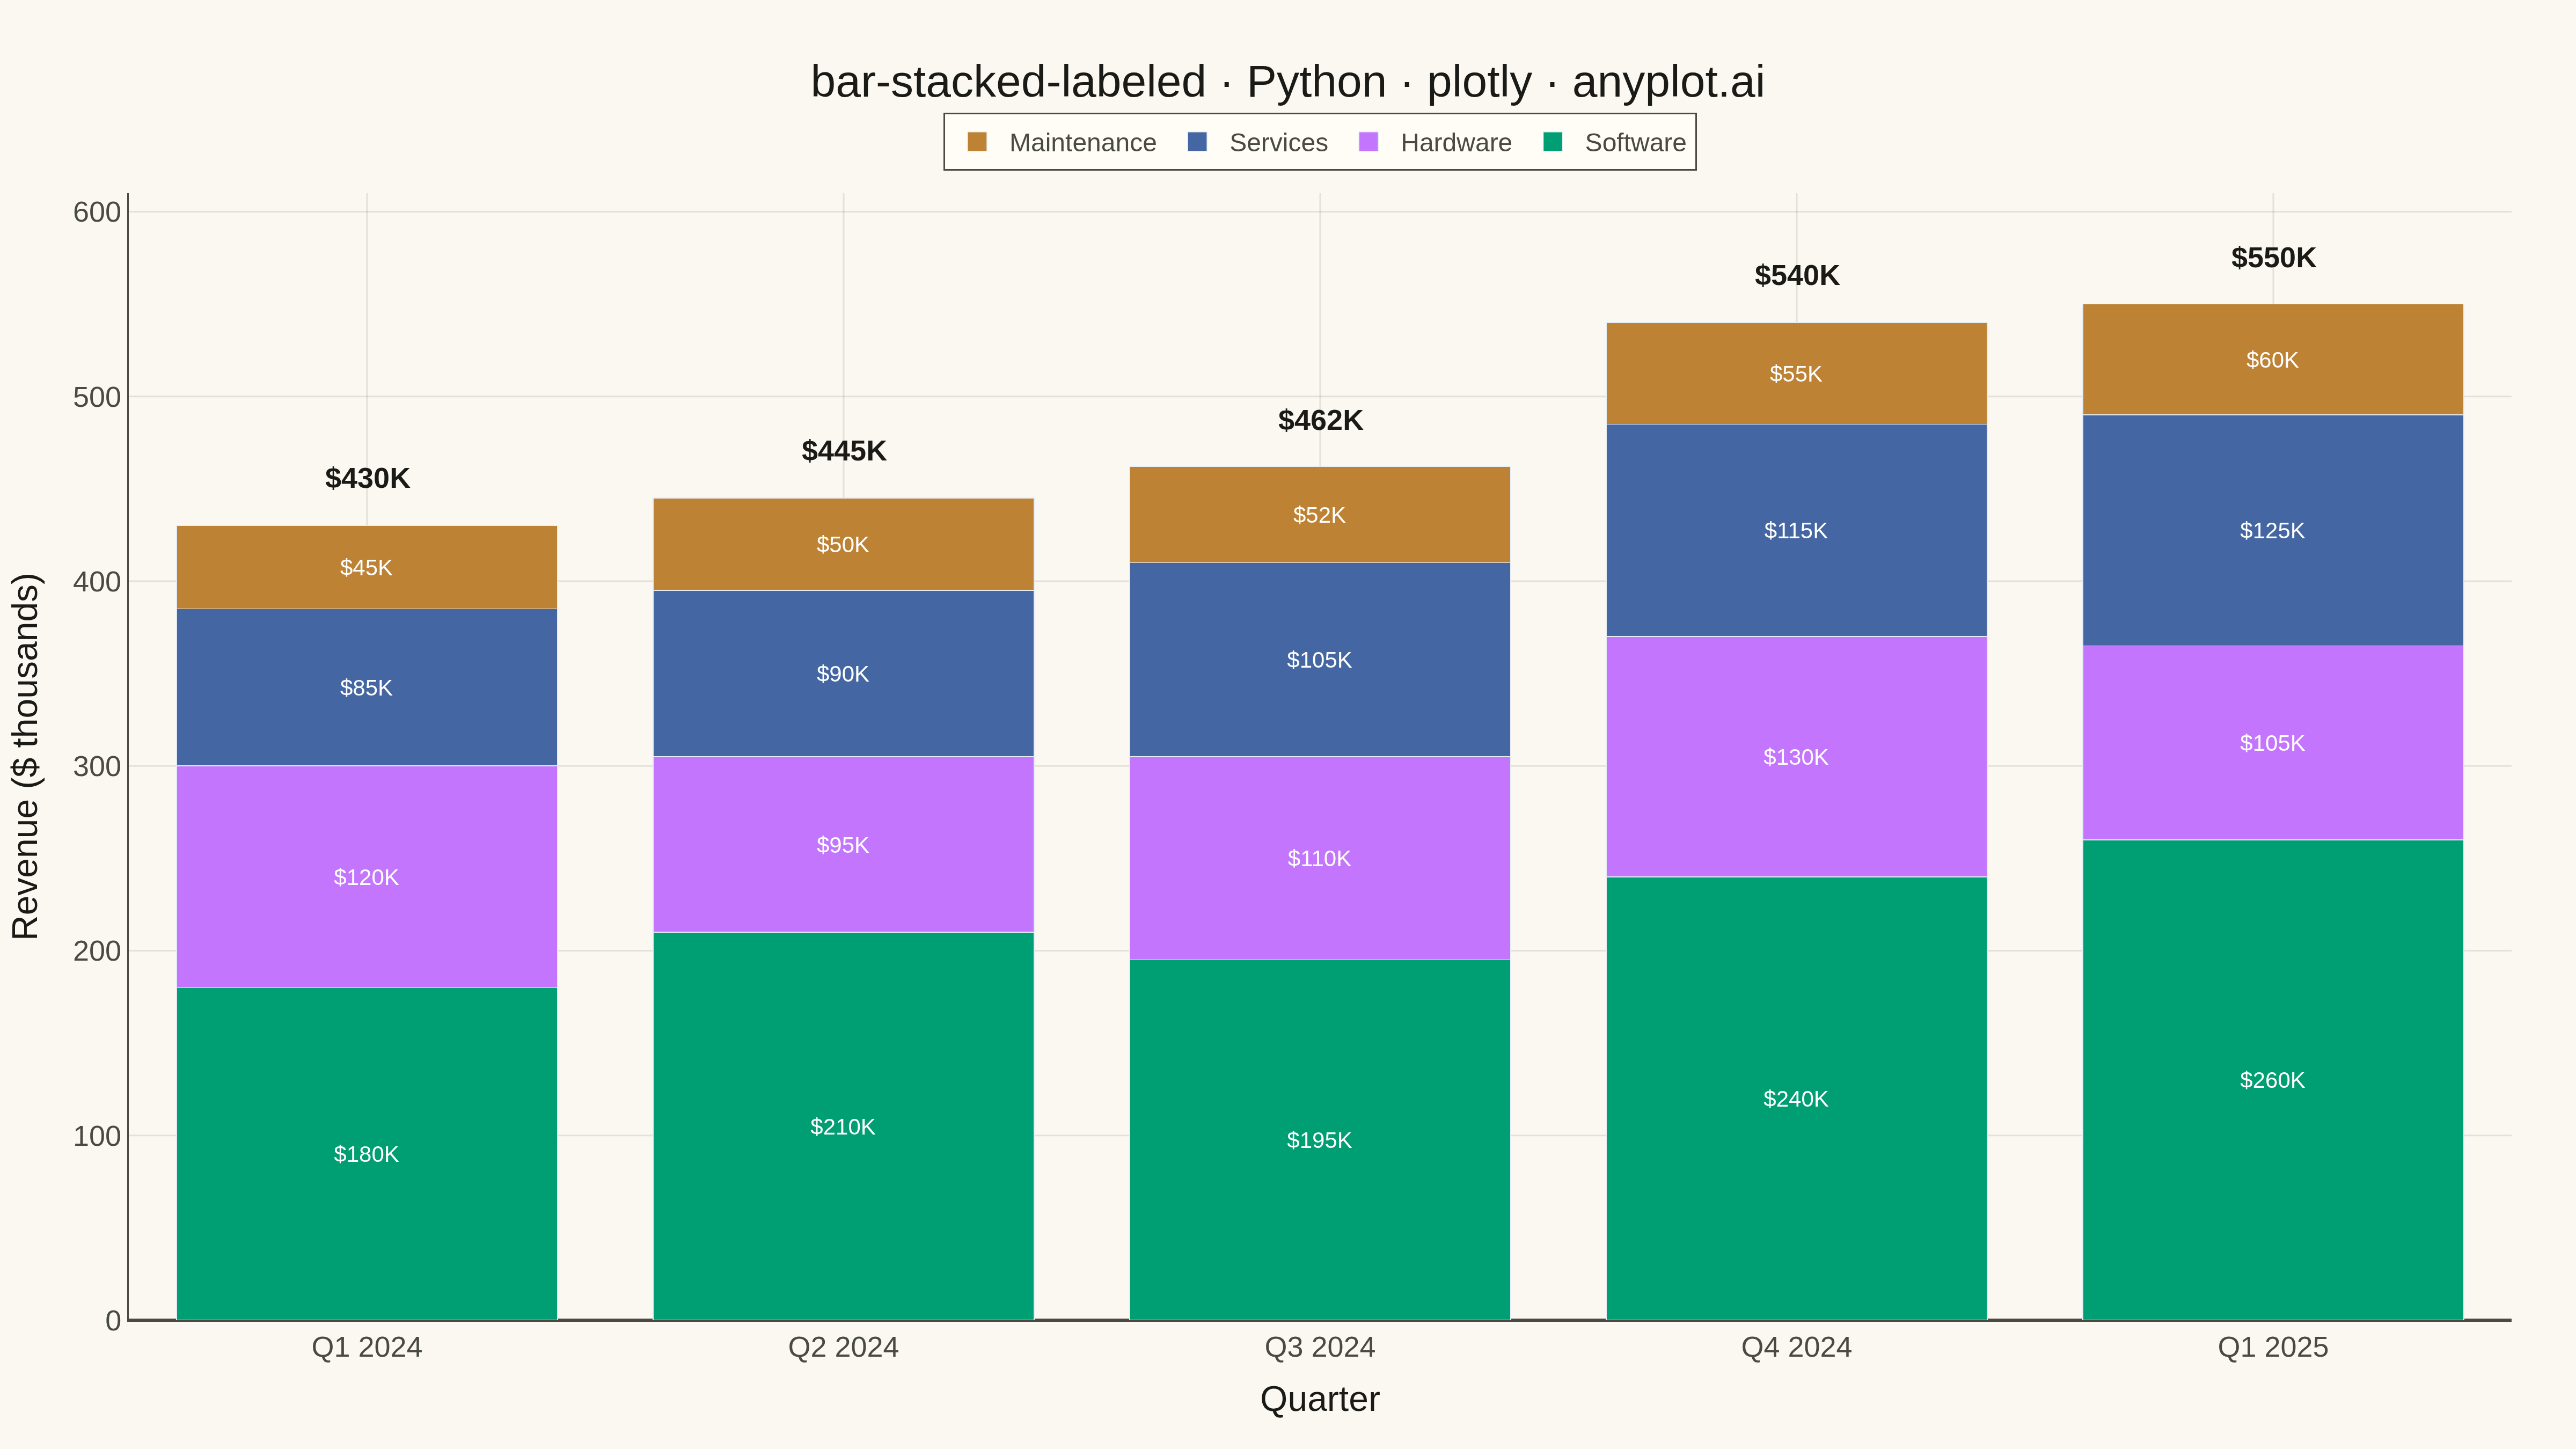
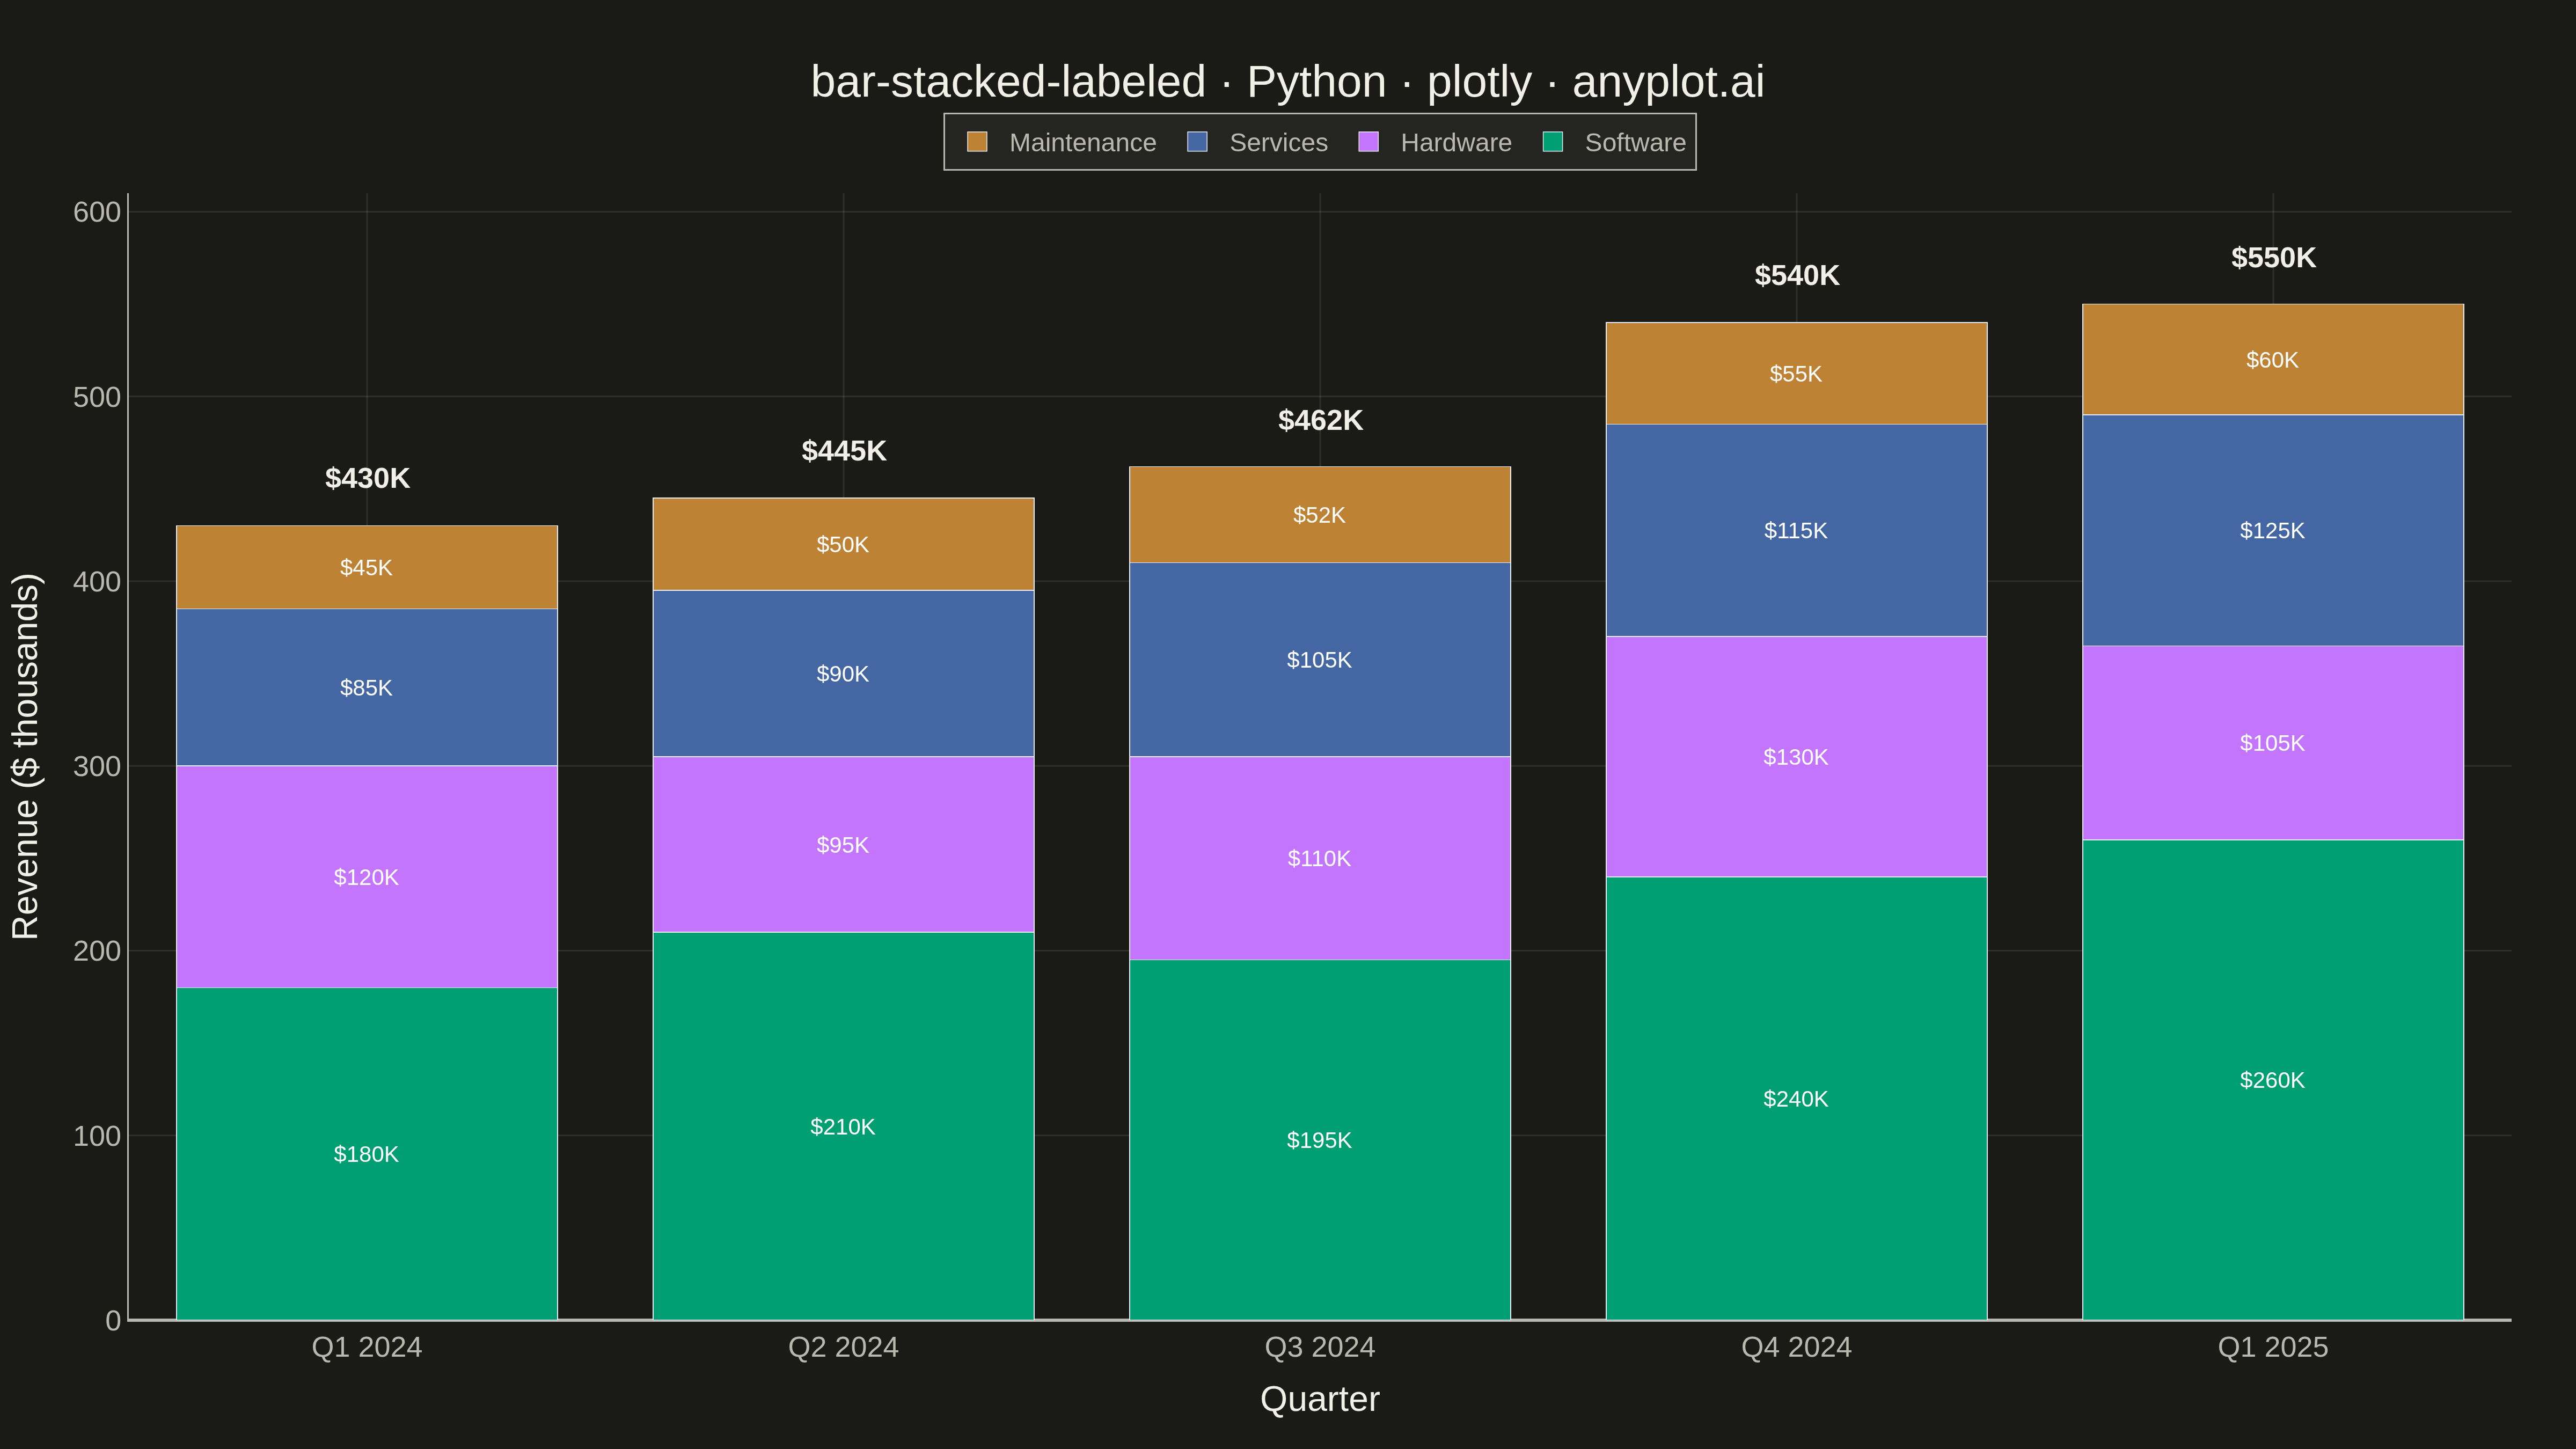
A stacked bar chart that displays multiple data series stacked on top of each other with total value labels prominently shown above each bar stack. This variant combines part-to-whole visualization with explicit numerical annotations, making it easy to read both individual segment contributions and cumulative totals at a glance. The total labels eliminate the need for mental arithmetic when comparing overall values across categories.
Preview render from the Plotly implementation.