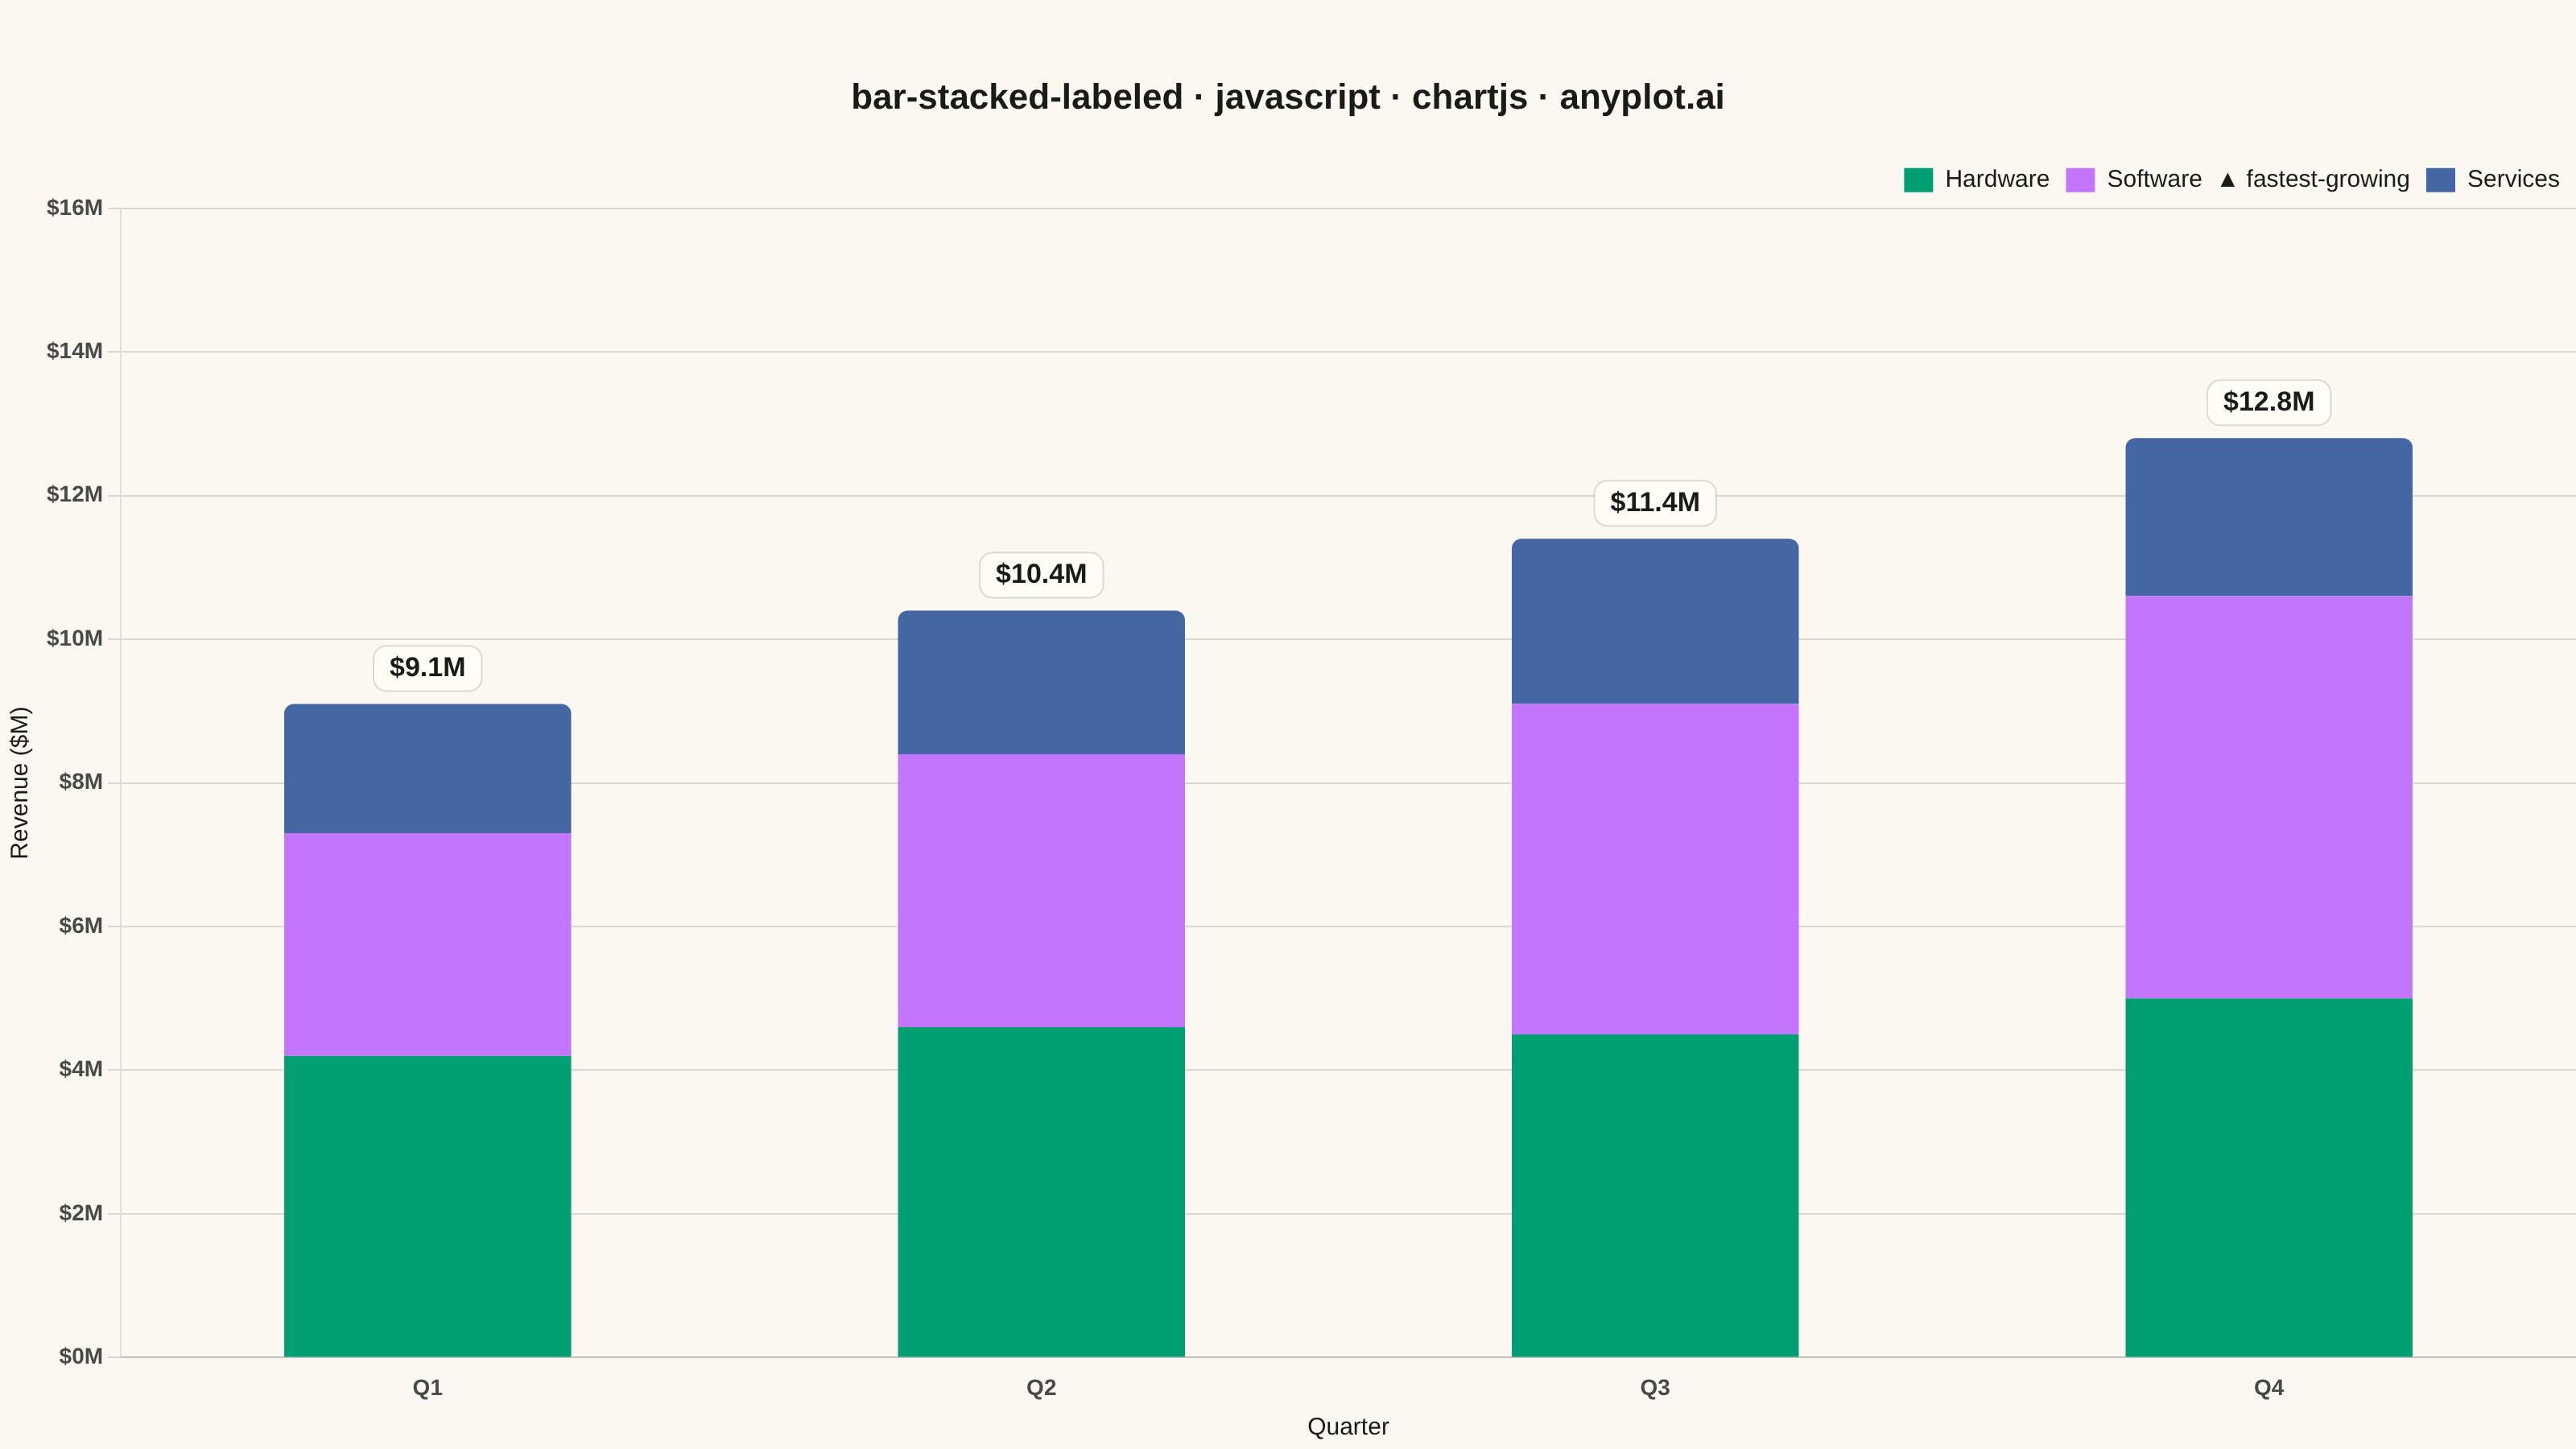
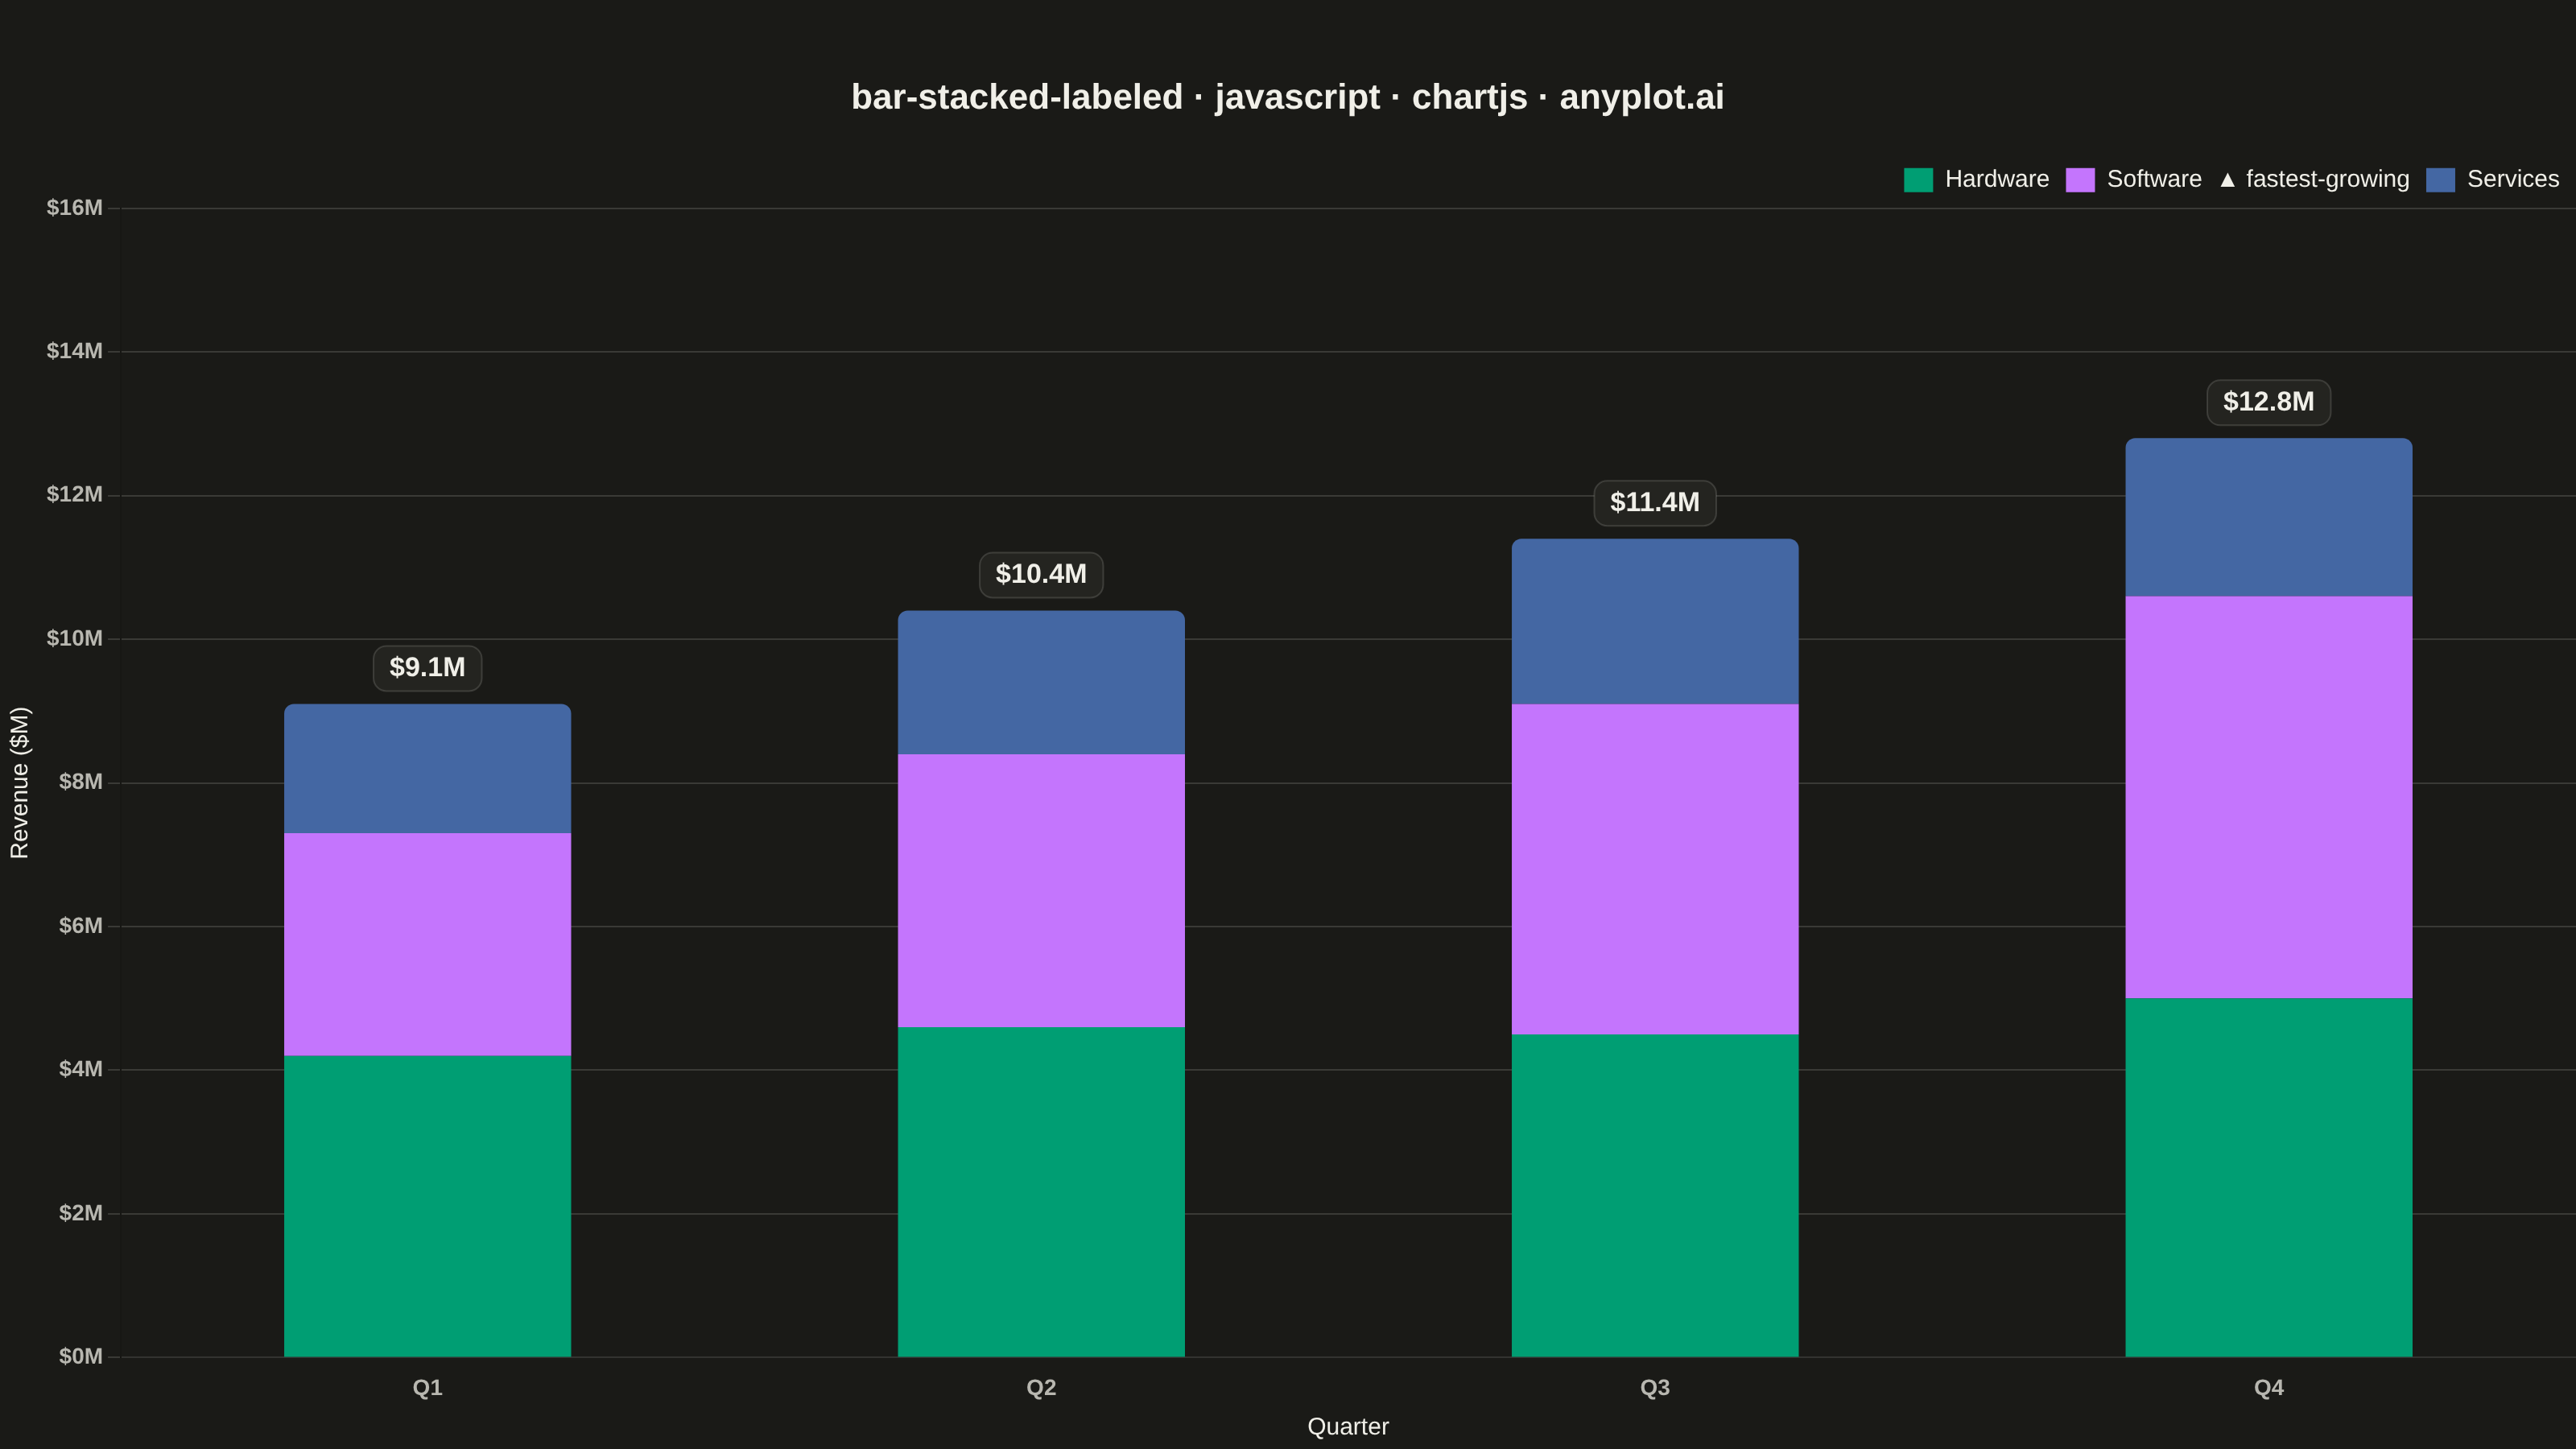
The same plot in 14 other libraries — JavaScript: D3.js, Apache ECharts, Highcharts, MUI X Charts; Python: Altair, Bokeh, lets-plot, Matplotlib, Plotly, plotnine, Pygal, Seaborn; R: ggplot2; Julia: Makie.jl. Compare all 15 side by side: Stacked Bar Chart with Total Labels in Python, R, Julia and JavaScript.
A stacked bar chart that displays multiple data series stacked on top of each other with total value labels prominently shown above each bar stack. This variant combines part-to-whole visualization with explicit numerical annotations, making it easy to read both individual segment contributions and cumulative totals at a glance. The total labels eliminate the need for mental arithmetic when comparing overall values across categories.
// anyplot.ai
// bar-stacked-labeled: Stacked Bar Chart with Total Labels
// Library: chartjs 4.4.7 | JavaScript 22.23.2
// Quality: 93/100 | Created: 2026-08-26

const t = window.ANYPLOT_TOKENS;
const FONT_STACK = "-apple-system, BlinkMacSystemFont, 'Segoe UI', sans-serif";

// --- Data (in-memory, deterministic) ---------------------------------------
// Quarterly revenue by product line, in $M. Segments deliberately diverge
// instead of growing in lockstep: Hardware dips in Q3, Services plateaus in
// Q4, and Software accelerates — giving the chart a real point of view.
const quarters = ["Q1", "Q2", "Q3", "Q4"];
const productLines = ["Hardware", "Software", "Services"];
const revenueByProduct = [
  [4.2, 4.6, 4.5, 5.0], // Hardware - dips in Q3
  [3.1, 3.8, 4.6, 5.6], // Software - accelerates, fastest-growing overall
  [1.8, 2.0, 2.3, 2.2], // Services - plateaus/dips in Q4
];
const totals = quarters.map((_, i) => revenueByProduct.reduce((sum, series) => sum + series[i], 0));

// Identify the fastest-growing segment (Q1 -> Q4) for a subtle legend cue.
const growthRates = revenueByProduct.map((series) => (series[series.length - 1] - series[0]) / series[0]);
const fastestGrowingIndex = growthRates.indexOf(Math.max(...growthRates));

// --- Mount -------------------------------------------------------------------
const canvas = document.createElement("canvas");
document.getElementById("container").appendChild(canvas);

function drawRoundedRect(ctx, x, y, w, h, r) {
  ctx.beginPath();
  ctx.moveTo(x + r, y);
  ctx.arcTo(x + w, y, x + w, y + h, r);
  ctx.arcTo(x + w, y + h, x, y + h, r);
  ctx.arcTo(x, y + h, x, y, r);
  ctx.arcTo(x, y, x + w, y, r);
  ctx.closePath();
}

// --- Total-label plugin ------------------------------------------------------
// Core Chart.js has no built-in data-label rendering; drawing text in an
// `afterDatasetsDraw` hook is the idiomatic Chart.js way to annotate bars
// (documented pattern, not a third-party plugin). A softly-elevated pill
// behind each total lifts it above library-default text-only labels.
const totalLabelsPlugin = {
  id: "totalLabels",
  afterDatasetsDraw(chart) {
    const { ctx, scales } = chart;
    const meta = chart.getDatasetMeta(chart.data.datasets.length - 1);
    ctx.save();
    ctx.font = `700 17px ${FONT_STACK}`;
    ctx.textAlign = "center";
    ctx.textBaseline = "middle";
    meta.data.forEach((bar, i) => {
      const label = `$${totals[i].toFixed(1)}M`;
      const textWidth = ctx.measureText(label).width;
      const cx = bar.x;
      const cy = scales.y.getPixelForValue(totals[i]) - 22;
      const paddingX = 10;
      const paddingY = 6;
      ctx.fillStyle = t.elevatedBg;
      ctx.strokeStyle = t.grid;
      ctx.lineWidth = 1;
      drawRoundedRect(ctx, cx - textWidth / 2 - paddingX, cy - paddingY - 8, textWidth + paddingX * 2, paddingY * 2 + 16, 8);
      ctx.fill();
      ctx.stroke();
      ctx.fillStyle = t.ink;
      ctx.fillText(label, cx, cy);
    });
    ctx.restore();
  },
};

// --- Chart ---------------------------------------------------------------
new Chart(canvas, {
  type: "bar",
  data: {
    labels: quarters,
    datasets: productLines.map((name, i) => {
      const isTopSegment = i === productLines.length - 1;
      return {
        label: name,
        data: revenueByProduct[i],
        backgroundColor: t.palette[i],
        borderWidth: 0,
        // Default borderSkipped ("start" = bottom) keeps only the exposed
        // top of the stack rounded, so the seam with the segment below stays flush.
        borderRadius: isTopSegment ? 6 : 0,
        hoverBorderWidth: 2,
        hoverBorderColor: t.ink,
        stack: "revenue",
      };
    }),
  },
  plugins: [totalLabelsPlugin],
  options: {
    responsive: true,
    maintainAspectRatio: false,
    animation: false,
    interaction: { mode: "index", intersect: false },
    layout: {
      padding: { top: 48 },
    },
    datasets: {
      bar: { categoryPercentage: 0.55, barPercentage: 0.85 },
    },
    plugins: {
      title: {
        display: true,
        text: "bar-stacked-labeled · javascript · chartjs · anyplot.ai",
        color: t.ink,
        font: { size: 22, weight: 700, family: FONT_STACK },
        padding: { bottom: 20 },
      },
      legend: {
        position: "top",
        align: "end",
        labels: {
          color: t.ink,
          font: { size: 15, weight: 500, family: FONT_STACK },
          boxWidth: 18,
          generateLabels(chart) {
            const items = Chart.defaults.plugins.legend.labels.generateLabels(chart);
            const fastest = items[fastestGrowingIndex];
            if (fastest) fastest.text = `${fastest.text}  ▲ fastest-growing`;
            return items;
          },
        },
      },
      tooltip: {
        callbacks: {
          label: (ctx) => `${ctx.dataset.label}: $${ctx.parsed.y.toFixed(1)}M`,
        },
      },
    },
    scales: {
      x: {
        stacked: true,
        ticks: { color: t.inkSoft, font: { size: 14, weight: 600, family: FONT_STACK } },
        grid: { display: false },
        title: { display: true, text: "Quarter", color: t.ink, font: { size: 15, weight: 500, family: FONT_STACK } },
      },
      y: {
        stacked: true,
        beginAtZero: true,
        suggestedMax: Math.max(...totals) * 1.2,
        ticks: {
          color: t.inkSoft,
          font: { size: 14, weight: 600, family: FONT_STACK },
          callback: (value) => `$${value}M`,
        },
        grid: { color: t.grid, lineWidth: 1, borderDash: [3, 4] },
        title: { display: true, text: "Revenue ($M)", color: t.ink, font: { size: 15, weight: 500, family: FONT_STACK } },
      },
    },
  },
});
Runnable source as JSON, for any HTTP client: https://api.anyplot.ai/specs/bar-stacked-labeled/chartjs/code. Any spec id and library id listed in llms-full.txt fit the same URL shape; every URL below is complete and callable.
{
  "spec_id": "bar-stacked-labeled",
  "language": "javascript",
  "library": "chartjs",
  "page": "https://anyplot.ai/bar-stacked-labeled/javascript/chartjs",
  "hub": "https://anyplot.ai/bar-stacked-labeled",
  "code_json": "https://api.anyplot.ai/specs/bar-stacked-labeled/chartjs/code",
  "spec_json": "https://api.anyplot.ai/specs/bar-stacked-labeled",
  "render_light_png": "https://storage.googleapis.com/anyplot-images/plots/bar-stacked-labeled/javascript/chartjs/plot-light.png",
  "render_dark_png": "https://storage.googleapis.com/anyplot-images/plots/bar-stacked-labeled/javascript/chartjs/plot-dark.png",
  "interactive_light_html": "https://storage.googleapis.com/anyplot-images/plots/bar-stacked-labeled/javascript/chartjs/plot-light.html",
  "interactive_dark_html": "https://storage.googleapis.com/anyplot-images/plots/bar-stacked-labeled/javascript/chartjs/plot-dark.html",
  "quality_score": 93.0,
  "license": "MIT",
  "guide": "https://anyplot.ai/llms.txt"
}
Part of Stacked Bar Chart with Total Labels on anyplot.ai.