The same plot in 14 other libraries — JavaScript: Chart.js, D3.js, Apache ECharts, Highcharts; Python: Altair, Bokeh, lets-plot, Matplotlib, Plotly, plotnine, Pygal, Seaborn; R: ggplot2; Julia: Makie.jl. Compare all 15 side by side: Stacked Bar Chart with Total Labels in Python, R, Julia and JavaScript.
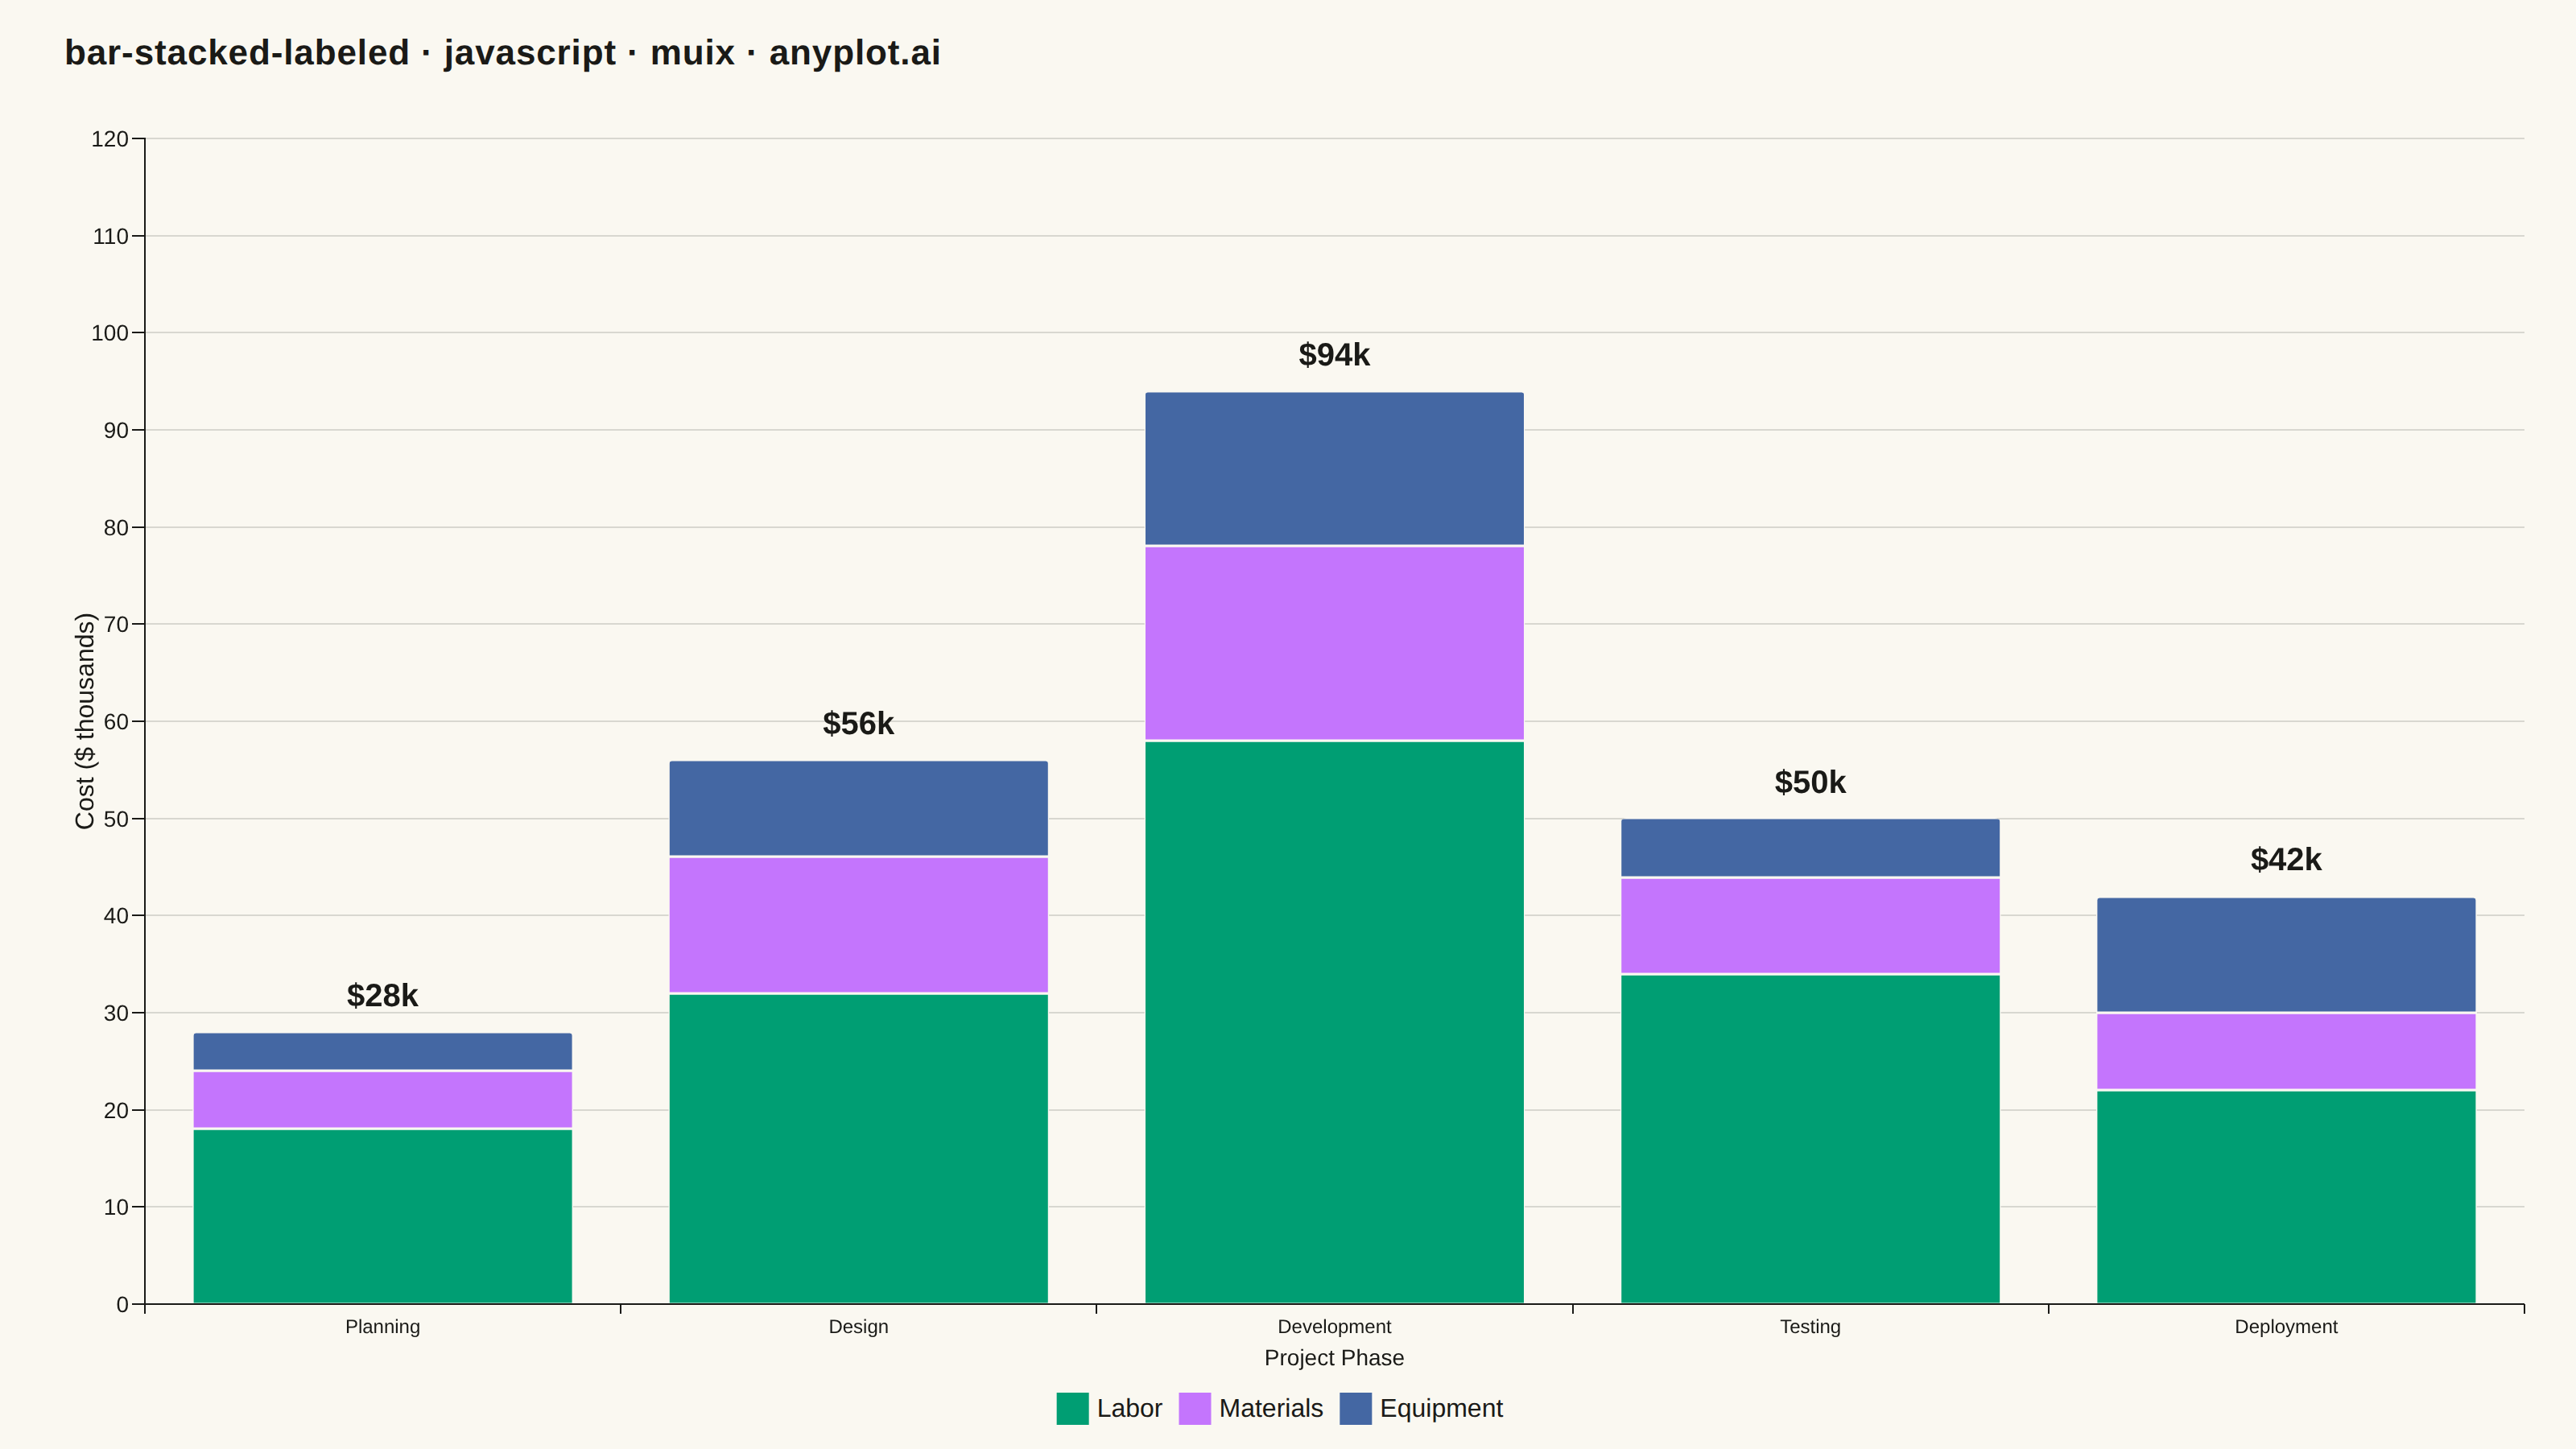
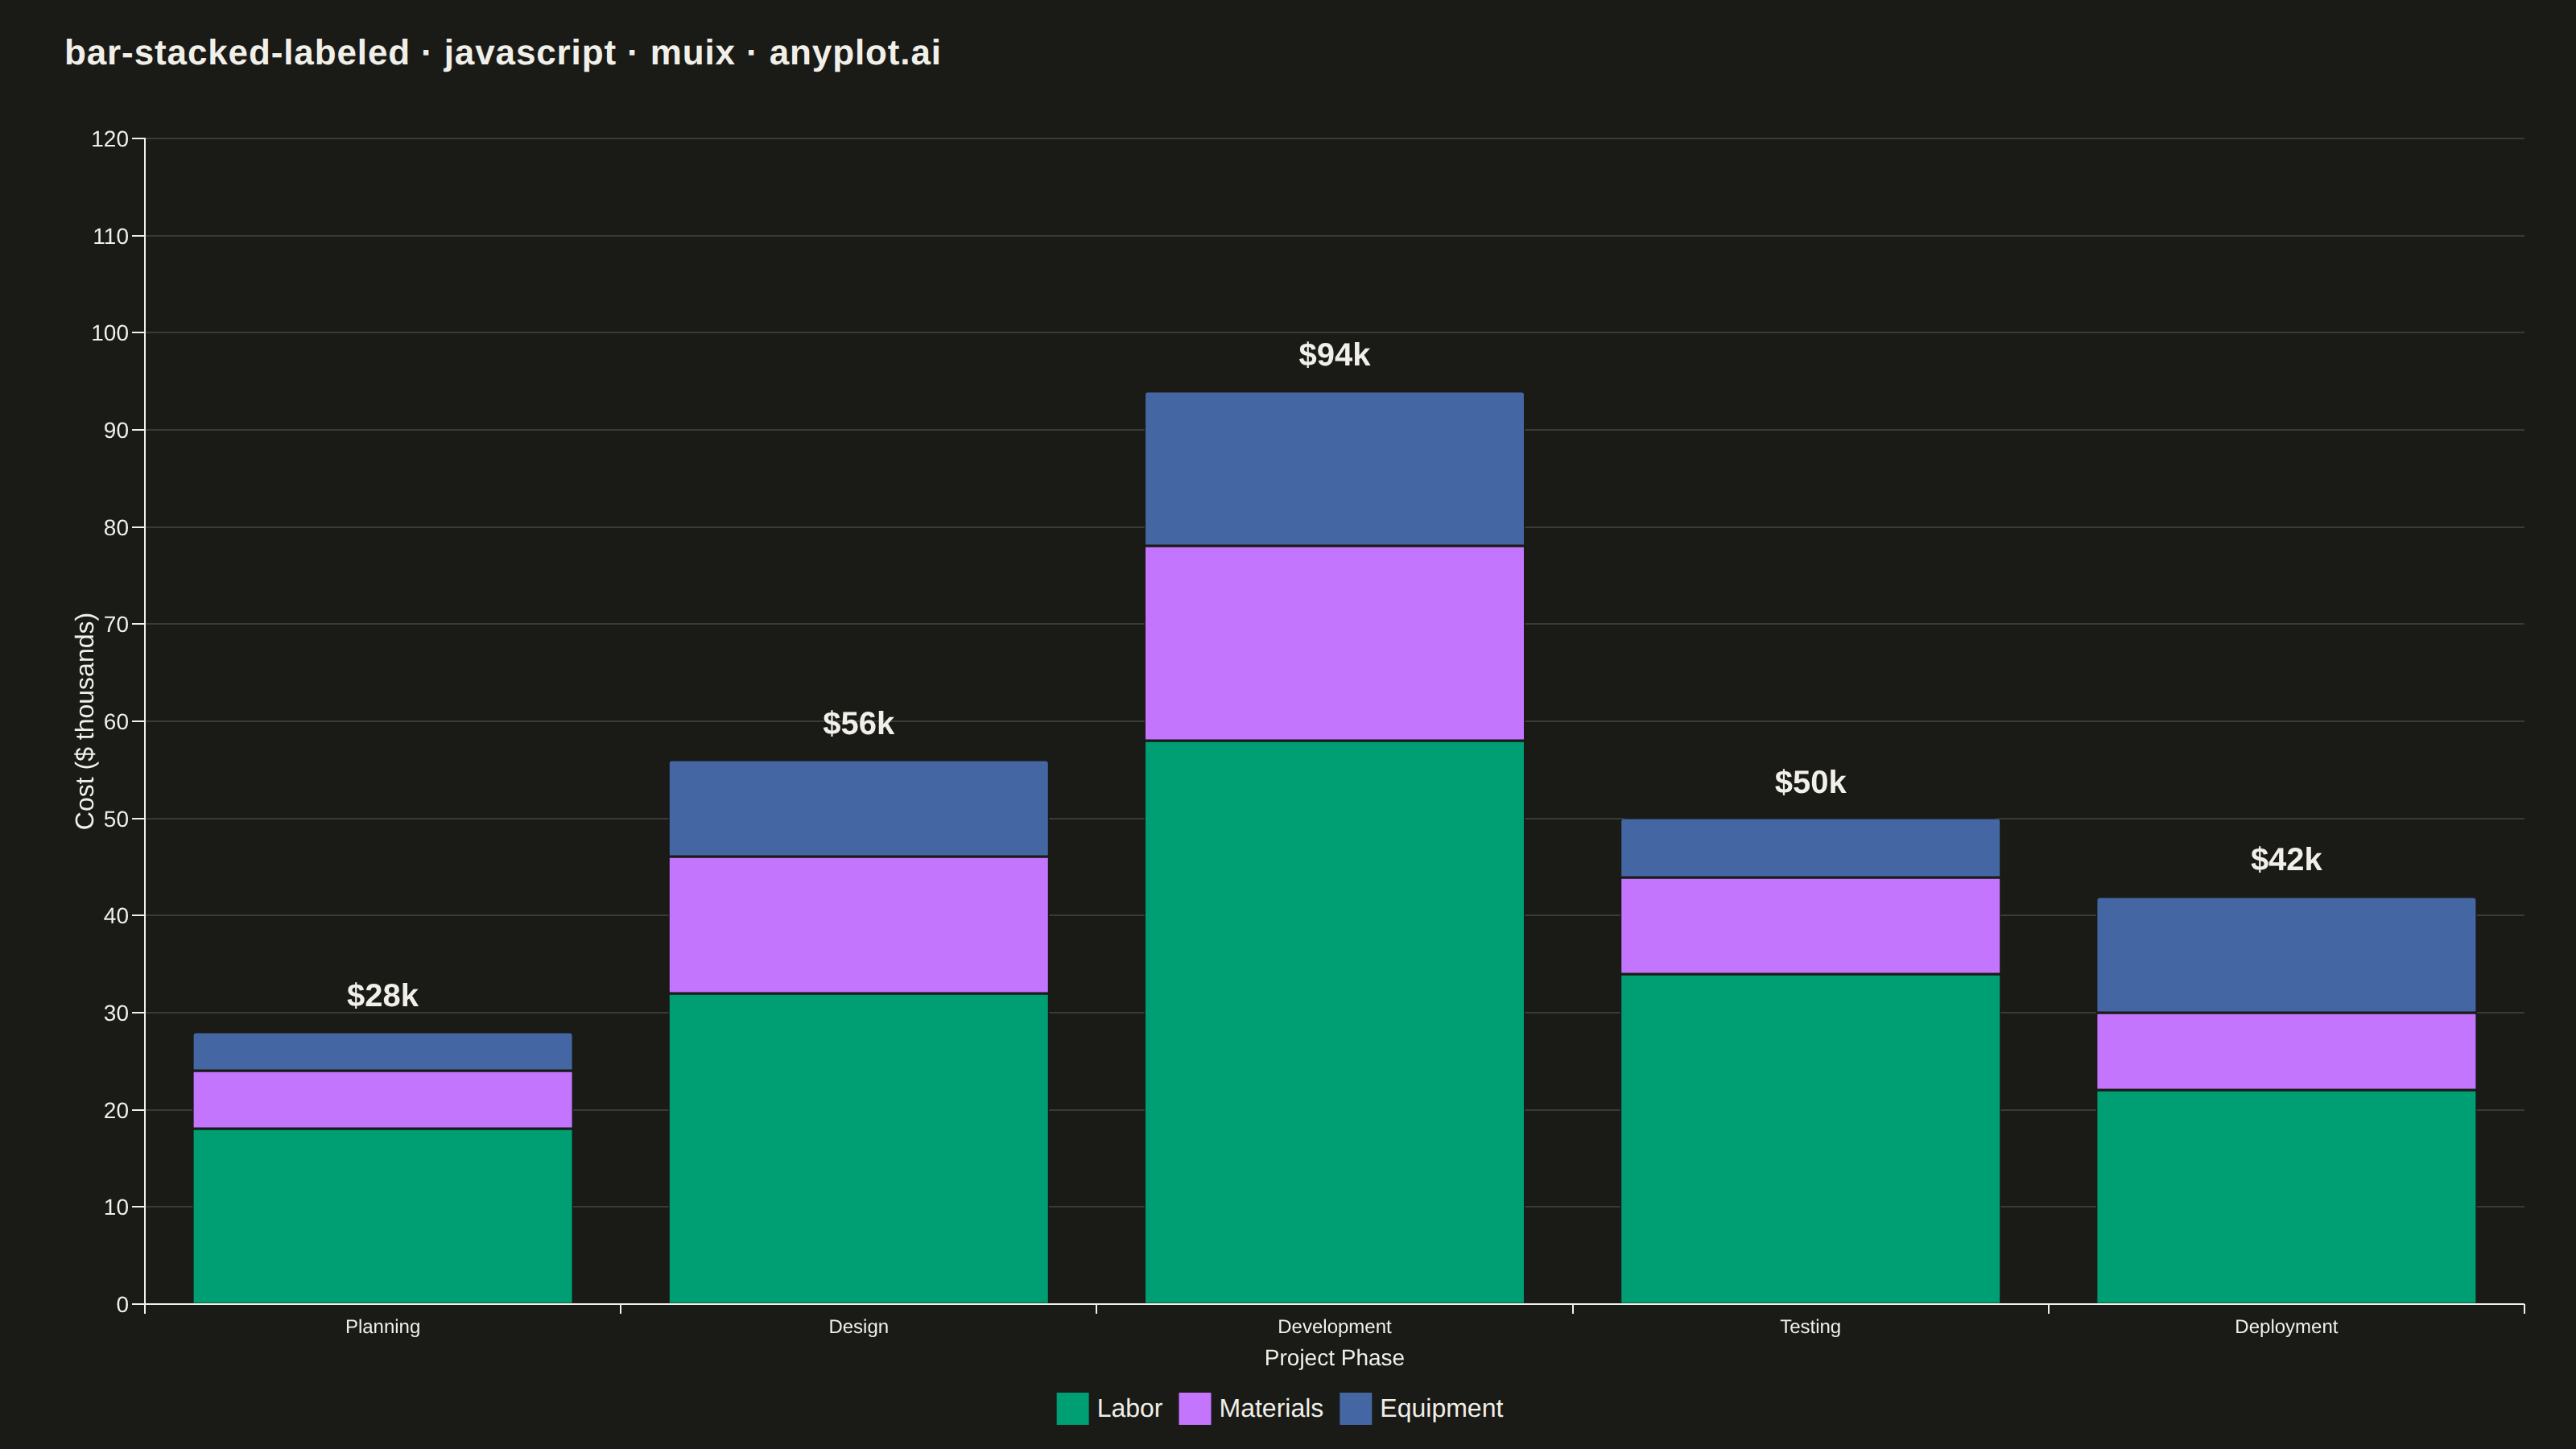
A stacked bar chart that displays multiple data series stacked on top of each other with total value labels prominently shown above each bar stack. This variant combines part-to-whole visualization with explicit numerical annotations, making it easy to read both individual segment contributions and cumulative totals at a glance. The total labels eliminate the need for mental arithmetic when comparing overall values across categories.
// anyplot.ai
// bar-stacked-labeled: Stacked Bar Chart with Total Labels
// Library: muix 7.29.1 | JavaScript 22.23.2
// Quality: 88/100 | Created: 2026-08-26
import { BarChart } from "@mui/x-charts/BarChart";
import { useXScale, useYScale } from "@mui/x-charts/hooks";
import Box from "@mui/material/Box";
import Typography from "@mui/material/Typography";

const t = window.ANYPLOT_TOKENS;

// --- Data (in-memory, deterministic) ----------------------------------------
// Project budget breakdown by phase, three stacked cost types (Imprint palette 1-3).
const phases = ["Planning", "Design", "Development", "Testing", "Deployment"];
const costTypes = ["Labor", "Materials", "Equipment"];
const labor = [18, 32, 58, 34, 22];
const materials = [6, 14, 20, 10, 8];
const equipment = [4, 10, 16, 6, 12];
const totals = phases.map((_, i) => labor[i] + materials[i] + equipment[i]);
const maxTotal = Math.max(...totals);

const TITLE = "bar-stacked-labeled · javascript · muix · anyplot.ai";
const TITLE_H = 56;

// --- Total labels (custom overlay, positioned via chart scales) -------------
function TotalLabels() {
  const xScale = useXScale();
  const yScale = useYScale();
  return (
    <g>
      {phases.map((phase, i) => (
        <text
          key={phase}
          x={xScale(phase) + xScale.bandwidth() / 2}
          y={yScale(totals[i]) - 16}
          textAnchor="middle"
          fontSize={20}
          fontWeight={700}
          fill={t.ink}
        >
          {`$${totals[i]}k`}
        </text>
      ))}
    </g>
  );
}

// --- Chart (default-exported component — the harness mounts it) -------------
export default function Chart() {
  const { width, height } = window.ANYPLOT_SIZE;

  return (
    <Box
      sx={{
        width,
        height,
        bgcolor: t.pageBg,
        display: "flex",
        flexDirection: "column",
      }}
    >
      <Box
        sx={{
          height: TITLE_H,
          display: "flex",
          alignItems: "center",
          px: "40px",
          pt: "10px",
        }}
      >
        <Typography
          sx={{
            color: t.ink,
            fontSize: "22px",
            fontWeight: 600,
            letterSpacing: "0.02em",
            lineHeight: 1,
          }}
        >
          {TITLE}
        </Typography>
      </Box>

      <BarChart
        width={width}
        height={height - TITLE_H}
        colors={t.palette}
        skipAnimation
        borderRadius={4}
        grid={{ horizontal: true }}
        xAxis={[
          {
            scaleType: "band",
            data: phases,
            label: "Project Phase",
          },
        ]}
        yAxis={[
          {
            label: "Cost ($ thousands)",
            max: Math.ceil((maxTotal * 1.18) / 10) * 10,
            tickFontSize: 14,
            labelFontSize: 16,
            tickSize: 8,
          },
        ]}
        series={[
          { data: labor, label: costTypes[0], stack: "total" },
          { data: materials, label: costTypes[1], stack: "total" },
          { data: equipment, label: costTypes[2], stack: "total" },
        ]}
        margin={{ top: 30, right: 32, bottom: 90, left: 90 }}
        sx={{
          "& .MuiChartsAxis-tickLabel": { fontSize: "14px" },
          "& .MuiChartsAxis-label": { fontSize: "16px", fontWeight: 600 },
          "& .MuiChartsLegend-label": { fontSize: "15px" },
          "& .MuiChartsGrid-line": { stroke: t.grid, strokeWidth: 1 },
          "& .MuiBarElement-root": { stroke: t.pageBg, strokeWidth: 1.5 },
        }}
        slotProps={{
          legend: { position: { vertical: "bottom", horizontal: "middle" } },
        }}
      >
        <TotalLabels />
      </BarChart>
    </Box>
  );
}
Runnable source as JSON, for any HTTP client: https://api.anyplot.ai/specs/bar-stacked-labeled/muix/code. Any spec id and library id listed in llms-full.txt fit the same URL shape; every URL below is complete and callable.
{
  "spec_id": "bar-stacked-labeled",
  "language": "javascript",
  "library": "muix",
  "page": "https://anyplot.ai/bar-stacked-labeled/javascript/muix",
  "hub": "https://anyplot.ai/bar-stacked-labeled",
  "code_json": "https://api.anyplot.ai/specs/bar-stacked-labeled/muix/code",
  "spec_json": "https://api.anyplot.ai/specs/bar-stacked-labeled",
  "render_light_png": "https://storage.googleapis.com/anyplot-images/plots/bar-stacked-labeled/javascript/muix/plot-light.png",
  "render_dark_png": "https://storage.googleapis.com/anyplot-images/plots/bar-stacked-labeled/javascript/muix/plot-dark.png",
  "interactive_light_html": "https://storage.googleapis.com/anyplot-images/plots/bar-stacked-labeled/javascript/muix/plot-light.html",
  "interactive_dark_html": "https://storage.googleapis.com/anyplot-images/plots/bar-stacked-labeled/javascript/muix/plot-dark.html",
  "quality_score": 88.0,
  "license": "MIT",
  "guide": "https://anyplot.ai/llms.txt"
}
Part of Stacked Bar Chart with Total Labels on anyplot.ai.