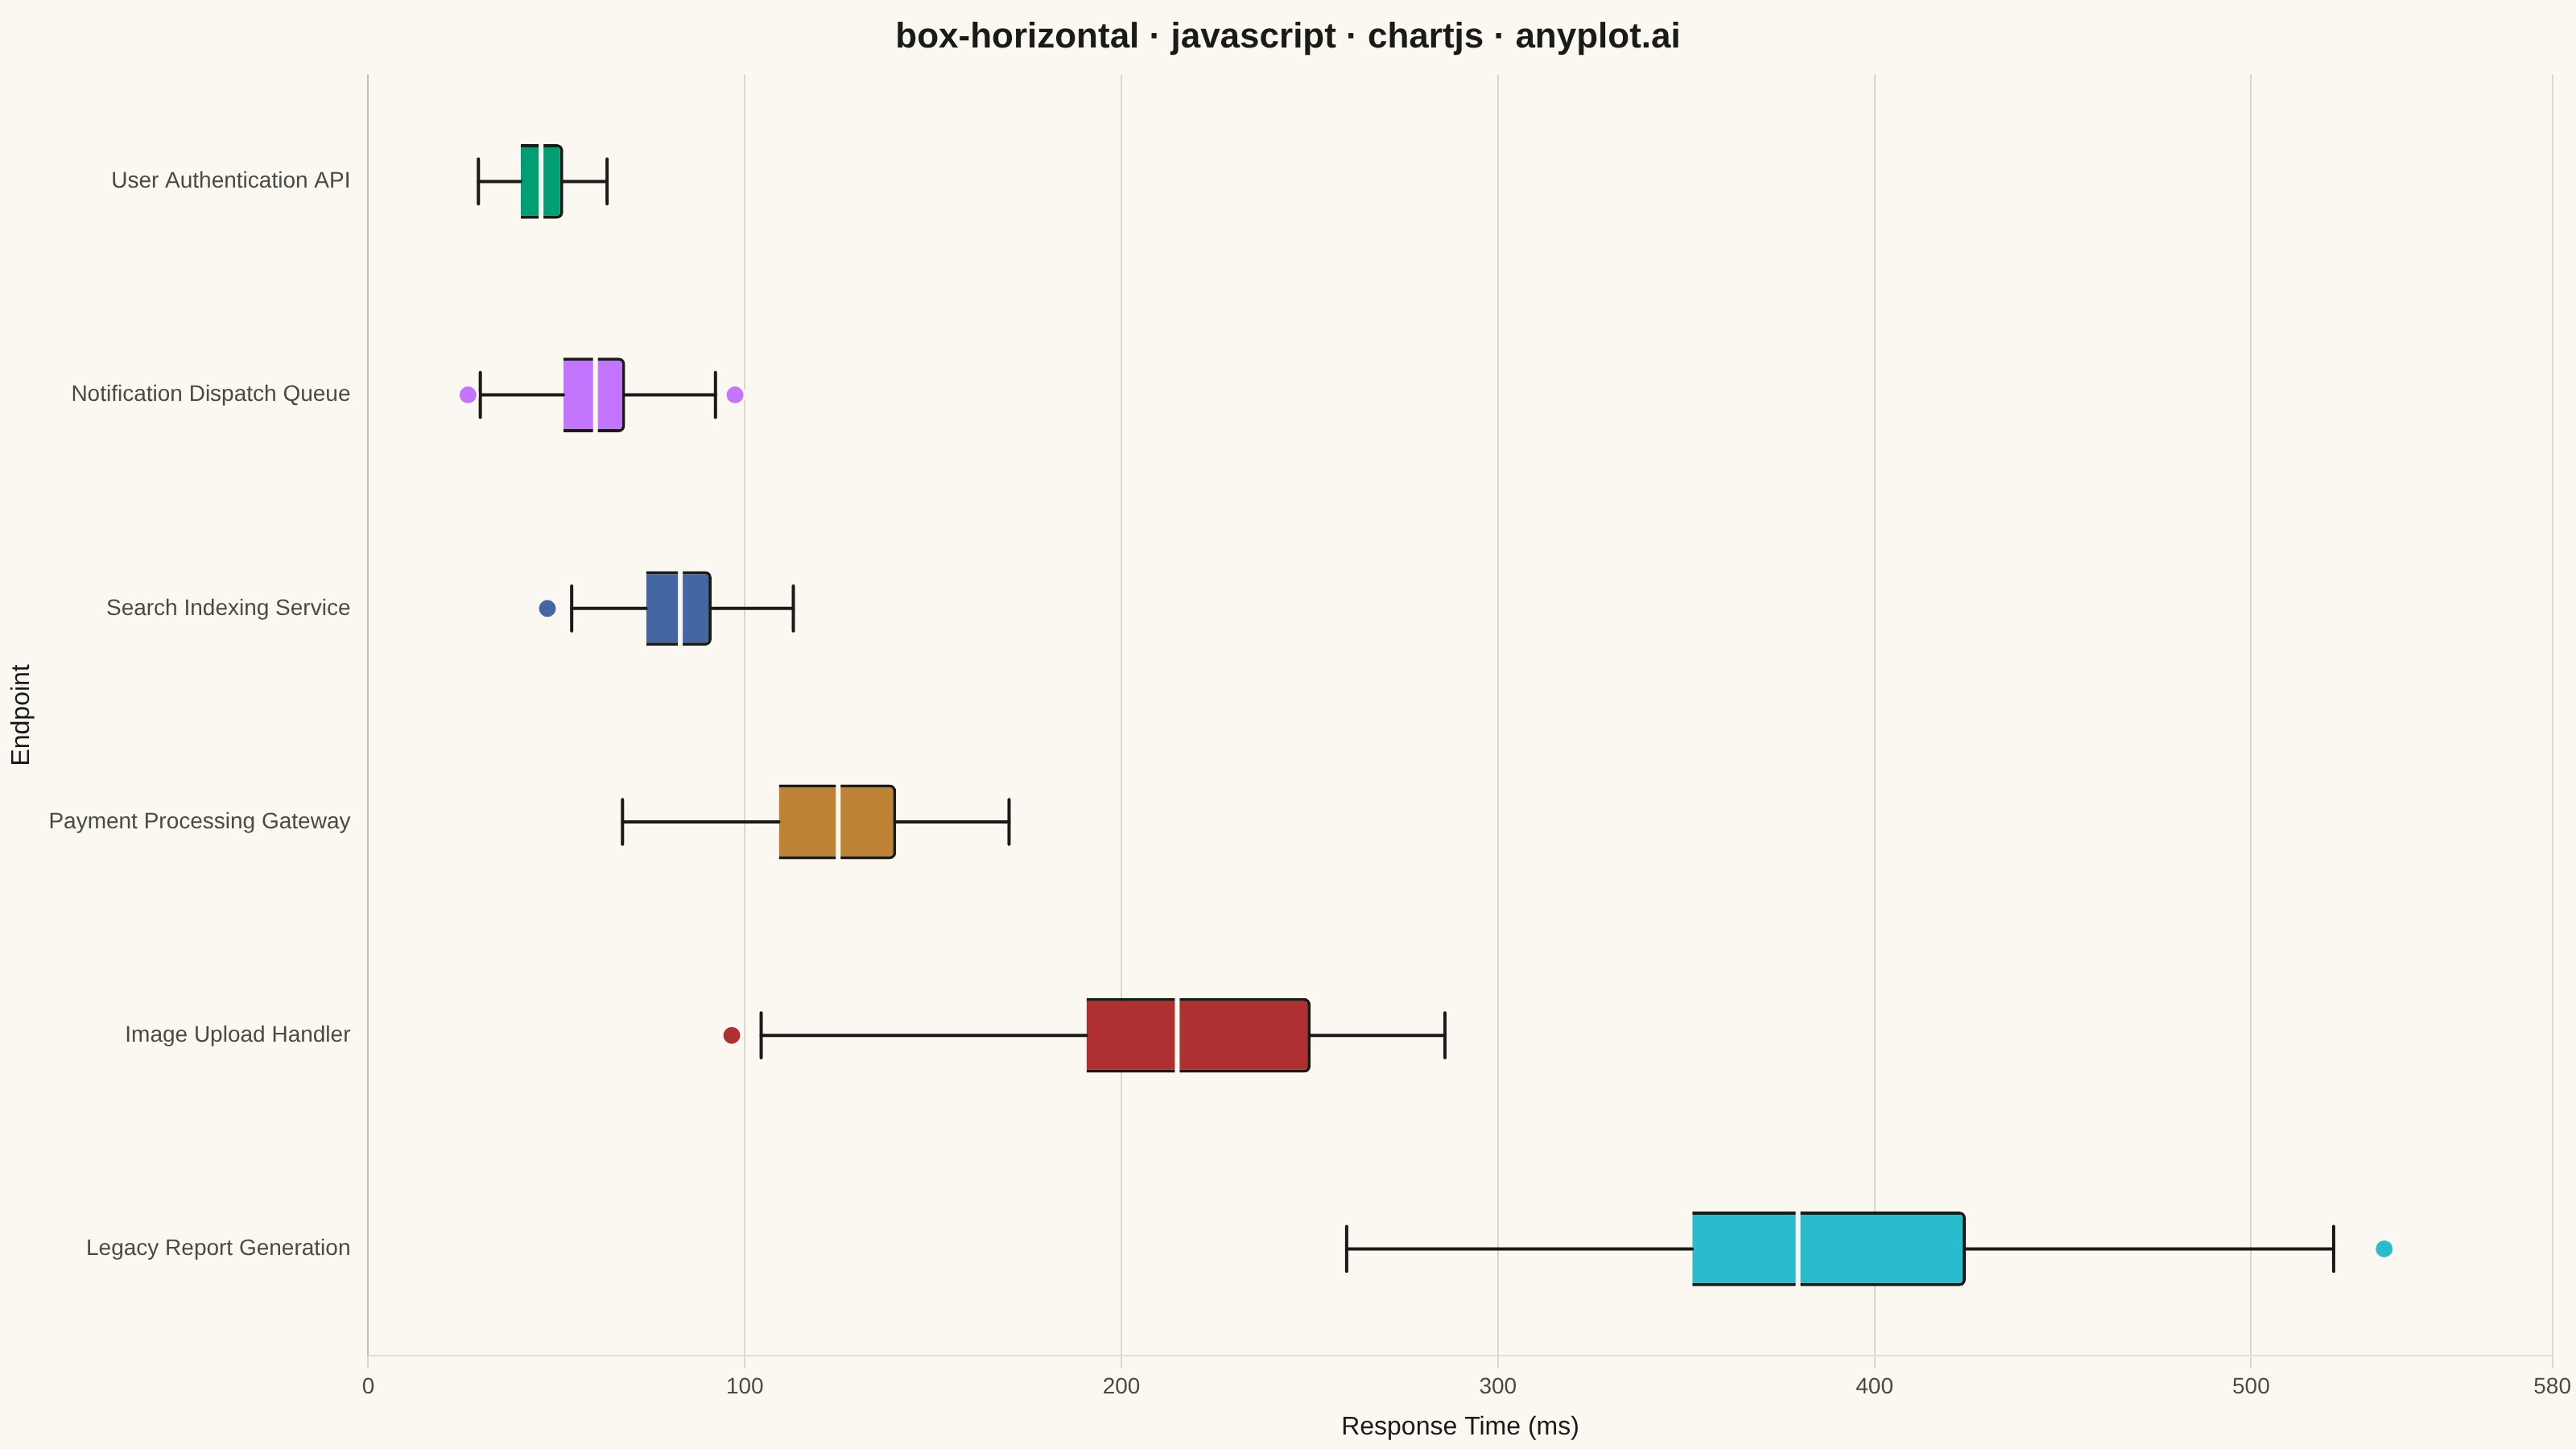
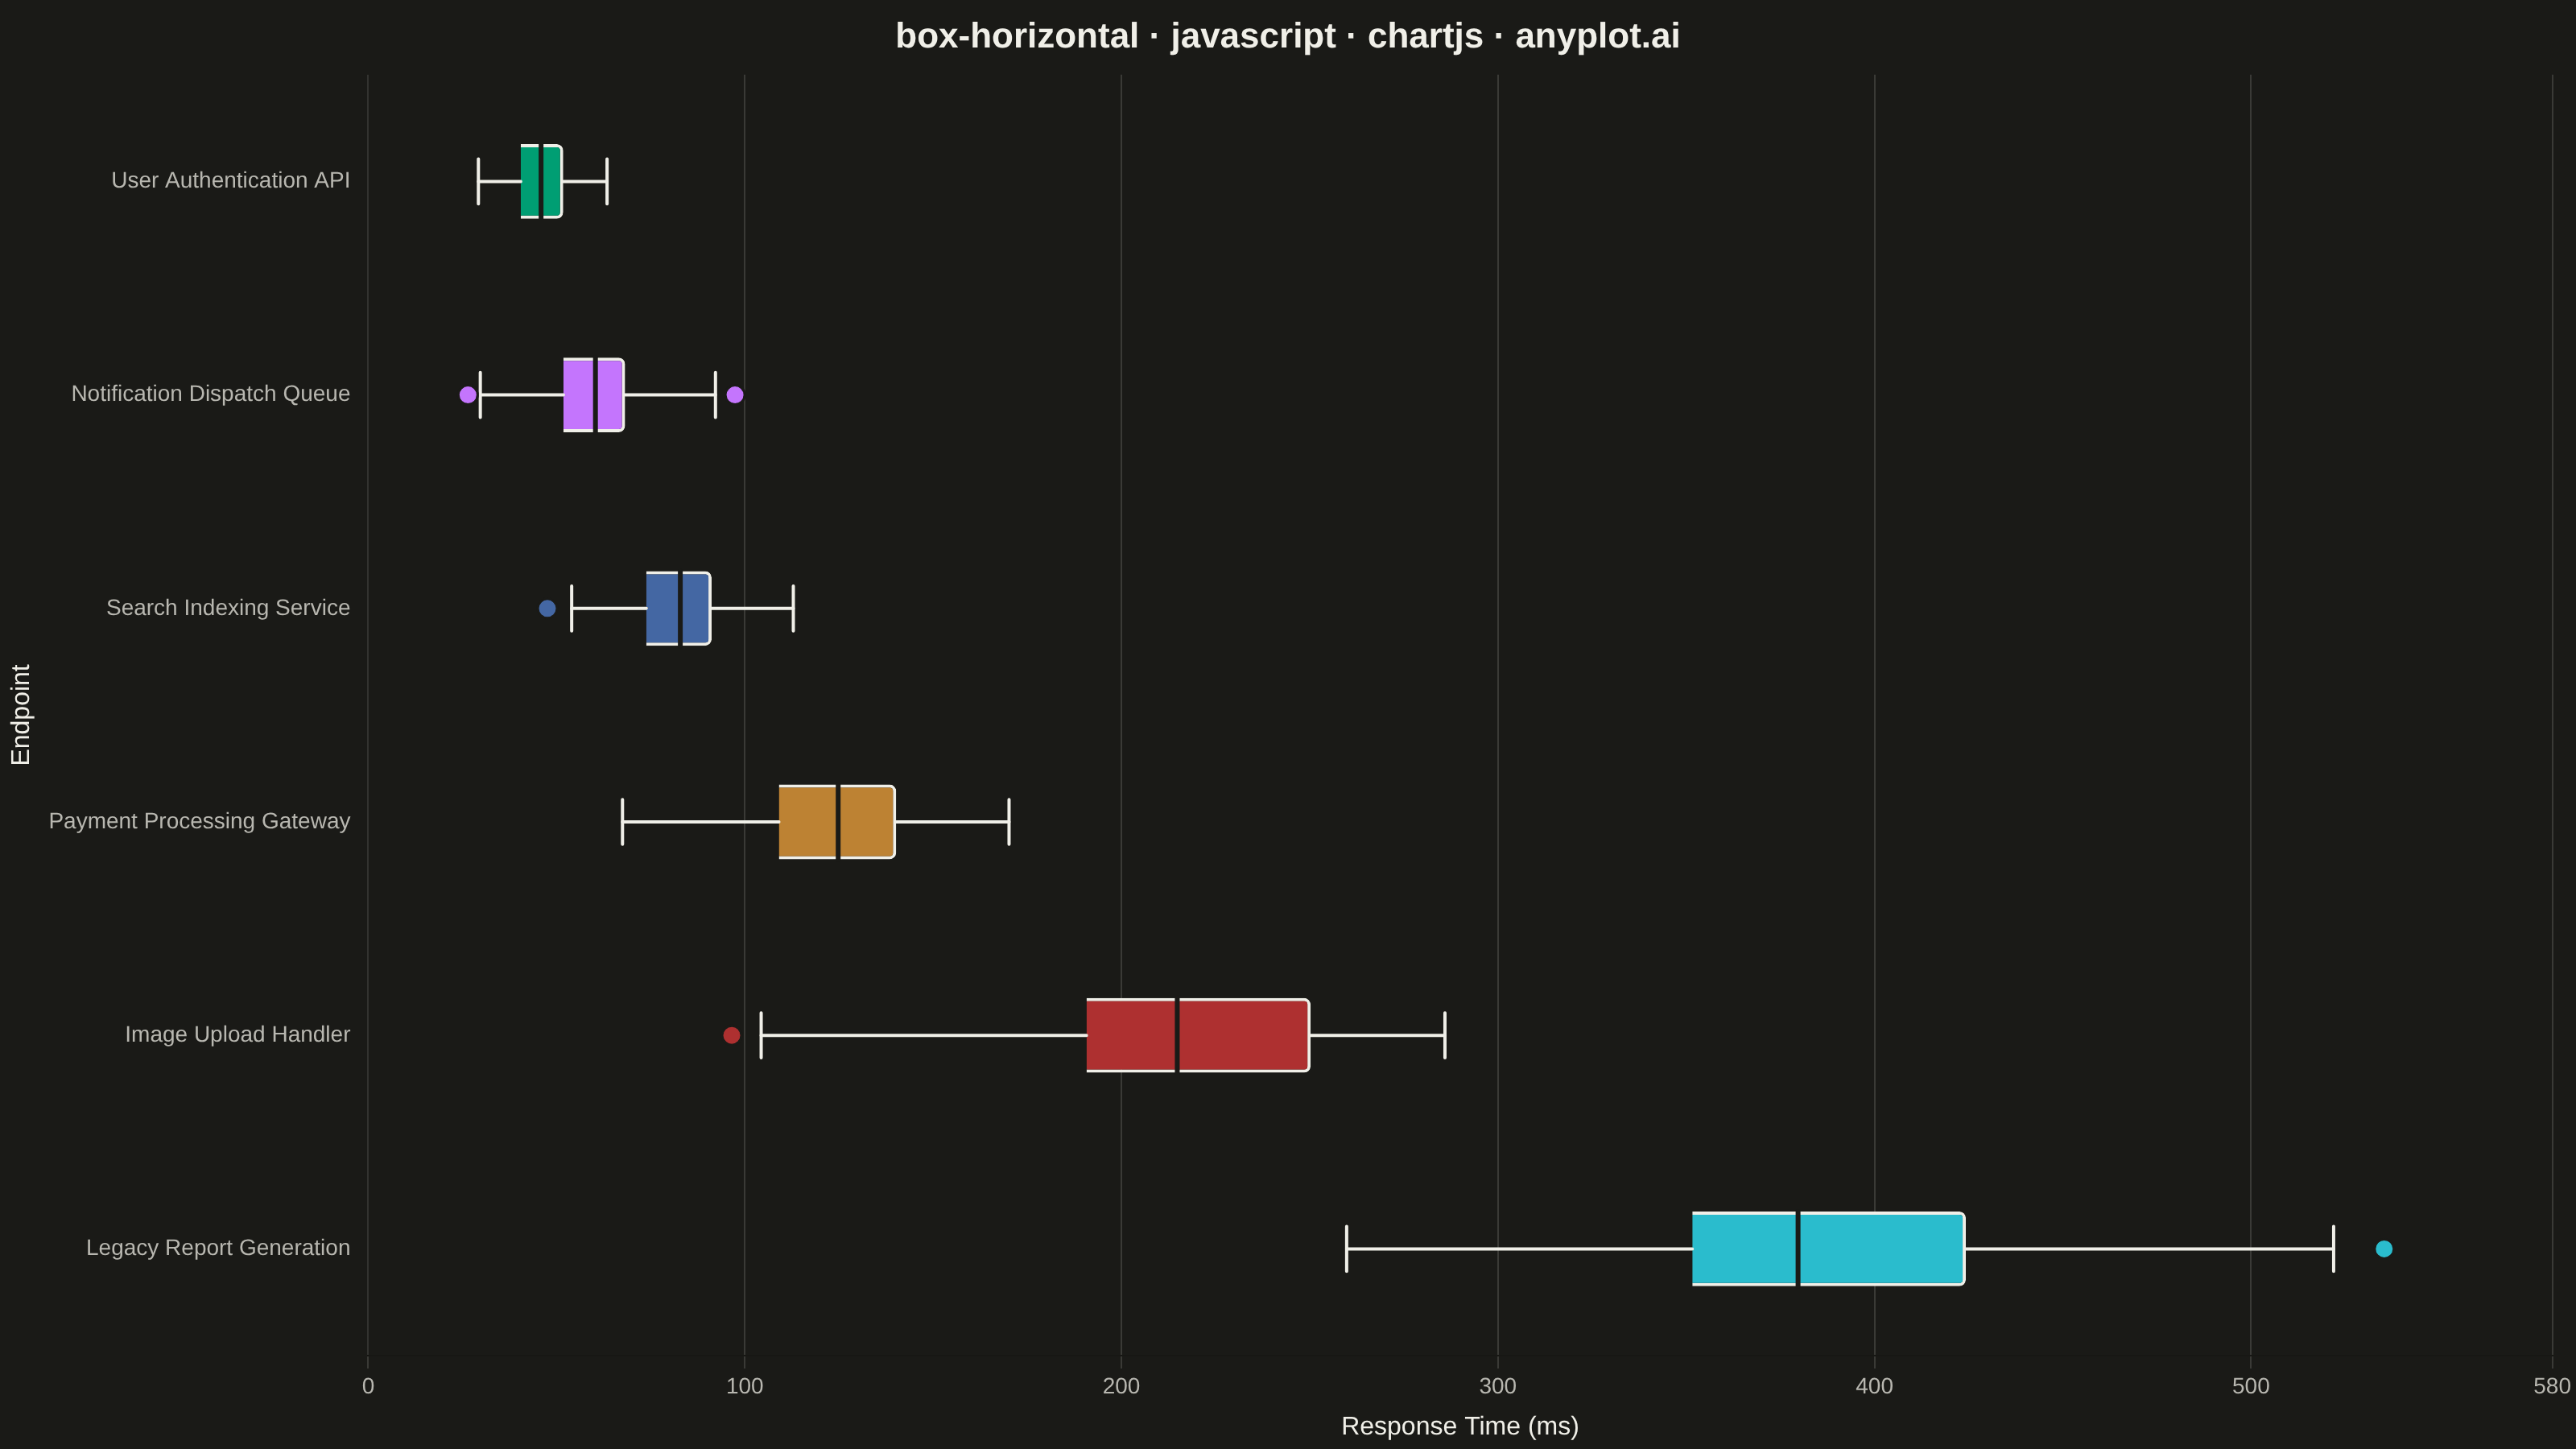
The same plot in 14 other libraries — JavaScript: D3.js, Apache ECharts, Highcharts, MUI X Charts; Python: Altair, Bokeh, lets-plot, Matplotlib, Plotly, plotnine, Pygal, Seaborn; R: ggplot2; Julia: Makie.jl. Compare all 15 side by side: Horizontal Box Plot in Python, R, Julia and JavaScript.
A horizontal box plot displays the distribution of numerical data through quartiles with the boxes oriented horizontally. This orientation is particularly useful when category labels are long or when comparing many groups, as it allows for easier reading of labels on the y-axis.
// anyplot.ai
// box-horizontal: Horizontal Box Plot
// Library: chartjs 4.4.7 | JavaScript 22.23.2
// Quality: 93/100 | Created: 2026-09-02

//# anyplot-orientation: landscape
const t = window.ANYPLOT_TOKENS;

// --- Deterministic PRNG (LCG) + Box-Muller normal sampling ------------------
let seed = 7;
function lcg() {
  seed = (seed * 1664525 + 1013904223) % 4294967296;
  return seed / 4294967296;
}
function randNormal(mean, sd) {
  const u1 = Math.max(lcg(), 1e-9);
  const u2 = lcg();
  const z = Math.sqrt(-2 * Math.log(u1)) * Math.cos(2 * Math.PI * u2);
  return mean + z * sd;
}
function quantile(sorted, q) {
  const pos = (sorted.length - 1) * q;
  const base = Math.floor(pos);
  const rest = pos - base;
  return sorted[base + 1] !== undefined
    ? sorted[base] + rest * (sorted[base + 1] - sorted[base])
    : sorted[base];
}

// --- Data: API response-time distributions by endpoint (long labels ------
// benefit from the horizontal orientation, per the spec's rationale) -------
const endpointSpecs = [
  { label: "User Authentication API", mean: 45, sd: 8, n: 60 },
  { label: "Notification Dispatch Queue", mean: 60, sd: 12, n: 70 },
  { label: "Search Indexing Service", mean: 85, sd: 15, n: 65 },
  { label: "Payment Processing Gateway", mean: 120, sd: 25, n: 55 },
  { label: "Image Upload Handler", mean: 210, sd: 40, n: 50 },
  { label: "Legacy Report Generation", mean: 380, sd: 60, n: 45 },
];

let endpoints = endpointSpecs.map((spec) => {
  const times = Array.from({ length: spec.n }, () =>
    Math.max(1, randNormal(spec.mean, spec.sd))
  ).sort((a, b) => a - b);

  const q1 = quantile(times, 0.25);
  const median = quantile(times, 0.5);
  const q3 = quantile(times, 0.75);
  const iqr = q3 - q1;
  const lowerFence = q1 - 1.5 * iqr;
  const upperFence = q3 + 1.5 * iqr;

  const inRange = times.filter((v) => v >= lowerFence && v <= upperFence);
  const outliers = times.filter((v) => v < lowerFence || v > upperFence);

  return {
    label: spec.label,
    q1,
    median,
    q3,
    whiskerMin: inRange[0],
    whiskerMax: inRange[inRange.length - 1],
    outliers,
  };
});

// Sort by median (ascending) so the fastest endpoint reads first, top to bottom.
endpoints = endpoints.sort((a, b) => a.median - b.median);

const allRangeValues = endpoints.flatMap((e) => [
  e.whiskerMin,
  e.whiskerMax,
  ...e.outliers,
]);
const dataMax = Math.max(...allRangeValues);
const xMax = Math.ceil((dataMax * 1.08) / 20) * 20;

// --- Custom plugin: whiskers, caps, median line, outlier points ------------
const boxPlotExtras = {
  id: "boxPlotExtras",
  afterDatasetsDraw(chart) {
    const { ctx } = chart;
    const meta = chart.getDatasetMeta(0);
    const xScale = chart.scales.x;
    ctx.save();
    ctx.lineCap = "round";

    endpoints.forEach((ep, i) => {
      const bar = meta.data[i];
      if (!bar) return;
      const centerY = bar.y;
      const capHalf = bar.height * 0.3;
      const xWhiskerMin = xScale.getPixelForValue(ep.whiskerMin);
      const xWhiskerMax = xScale.getPixelForValue(ep.whiskerMax);
      const xQ1 = xScale.getPixelForValue(ep.q1);
      const xQ3 = xScale.getPixelForValue(ep.q3);
      const xMedian = xScale.getPixelForValue(ep.median);

      // Whiskers
      ctx.strokeStyle = t.ink;
      ctx.lineWidth = 2;
      ctx.beginPath();
      ctx.moveTo(xWhiskerMin, centerY);
      ctx.lineTo(xQ1, centerY);
      ctx.moveTo(xQ3, centerY);
      ctx.lineTo(xWhiskerMax, centerY);
      ctx.stroke();

      // Whisker caps
      ctx.beginPath();
      ctx.moveTo(xWhiskerMin, centerY - capHalf);
      ctx.lineTo(xWhiskerMin, centerY + capHalf);
      ctx.moveTo(xWhiskerMax, centerY - capHalf);
      ctx.lineTo(xWhiskerMax, centerY + capHalf);
      ctx.stroke();

      // Median line — page-bg stroke for contrast against the saturated fill
      ctx.strokeStyle = t.pageBg;
      ctx.lineWidth = 3;
      ctx.beginPath();
      ctx.moveTo(xMedian, centerY - bar.height / 2);
      ctx.lineTo(xMedian, centerY + bar.height / 2);
      ctx.stroke();

      // Outliers
      const color = t.palette[i % t.palette.length];
      ep.outliers.forEach((value) => {
        const x = xScale.getPixelForValue(value);
        ctx.beginPath();
        ctx.arc(x, centerY, 6, 0, Math.PI * 2);
        ctx.fillStyle = color;
        ctx.fill();
        ctx.lineWidth = 1.5;
        ctx.strokeStyle = t.pageBg;
        ctx.stroke();
      });
    });

    ctx.restore();
  },
};

// --- Mount -------------------------------------------------------------------
const canvas = document.createElement("canvas");
document.getElementById("container").appendChild(canvas);

// --- Chart: horizontal floating bars for Q1-Q3, custom plugin for the rest -
new Chart(canvas, {
  type: "bar",
  data: {
    labels: endpoints.map((e) => e.label),
    datasets: [
      {
        label: "Interquartile range",
        data: endpoints.map((e) => [e.q1, e.q3]),
        backgroundColor: endpoints.map((_, i) => t.palette[i % t.palette.length]),
        borderColor: t.ink,
        borderWidth: 2,
        borderRadius: 4,
        barPercentage: 0.5,
        categoryPercentage: 0.7,
      },
    ],
  },
  plugins: [boxPlotExtras],
  options: {
    indexAxis: "y",
    responsive: true,
    maintainAspectRatio: false,
    animation: false,
    plugins: {
      title: {
        display: true,
        text: "box-horizontal · javascript · chartjs · anyplot.ai",
        color: t.ink,
        font: { size: 22 },
      },
      legend: { display: false },
    },
    scales: {
      x: {
        min: 0,
        max: xMax,
        title: {
          display: true,
          text: "Response Time (ms)",
          color: t.ink,
          font: { size: 16 },
        },
        ticks: { color: t.inkSoft, font: { size: 14 } },
        grid: { color: t.grid },
      },
      y: {
        title: { display: true, text: "Endpoint", color: t.ink, font: { size: 16 } },
        ticks: { color: t.inkSoft, font: { size: 14 } },
        grid: { display: false },
      },
    },
  },
});
Runnable source as JSON, for any HTTP client: https://api.anyplot.ai/specs/box-horizontal/chartjs/code. Any spec id and library id listed in llms-full.txt fit the same URL shape; every URL below is complete and callable.
{
  "spec_id": "box-horizontal",
  "language": "javascript",
  "library": "chartjs",
  "page": "https://anyplot.ai/box-horizontal/javascript/chartjs",
  "hub": "https://anyplot.ai/box-horizontal",
  "code_json": "https://api.anyplot.ai/specs/box-horizontal/chartjs/code",
  "spec_json": "https://api.anyplot.ai/specs/box-horizontal",
  "render_light_png": "https://storage.googleapis.com/anyplot-images/plots/box-horizontal/javascript/chartjs/plot-light.png",
  "render_dark_png": "https://storage.googleapis.com/anyplot-images/plots/box-horizontal/javascript/chartjs/plot-dark.png",
  "interactive_light_html": "https://storage.googleapis.com/anyplot-images/plots/box-horizontal/javascript/chartjs/plot-light.html",
  "interactive_dark_html": "https://storage.googleapis.com/anyplot-images/plots/box-horizontal/javascript/chartjs/plot-dark.html",
  "quality_score": 93.0,
  "license": "MIT",
  "guide": "https://anyplot.ai/llms.txt"
}
Part of Horizontal Box Plot on anyplot.ai.