The same plot in 14 other libraries — Python: Altair, Bokeh, lets-plot, Matplotlib, Plotly, plotnine, Pygal, Seaborn; R: ggplot2; JavaScript: Chart.js, D3.js, Apache ECharts, Highcharts, MUI X Charts. Compare all 15 side by side: Horizontal Box Plot in Python, R, Julia and JavaScript.
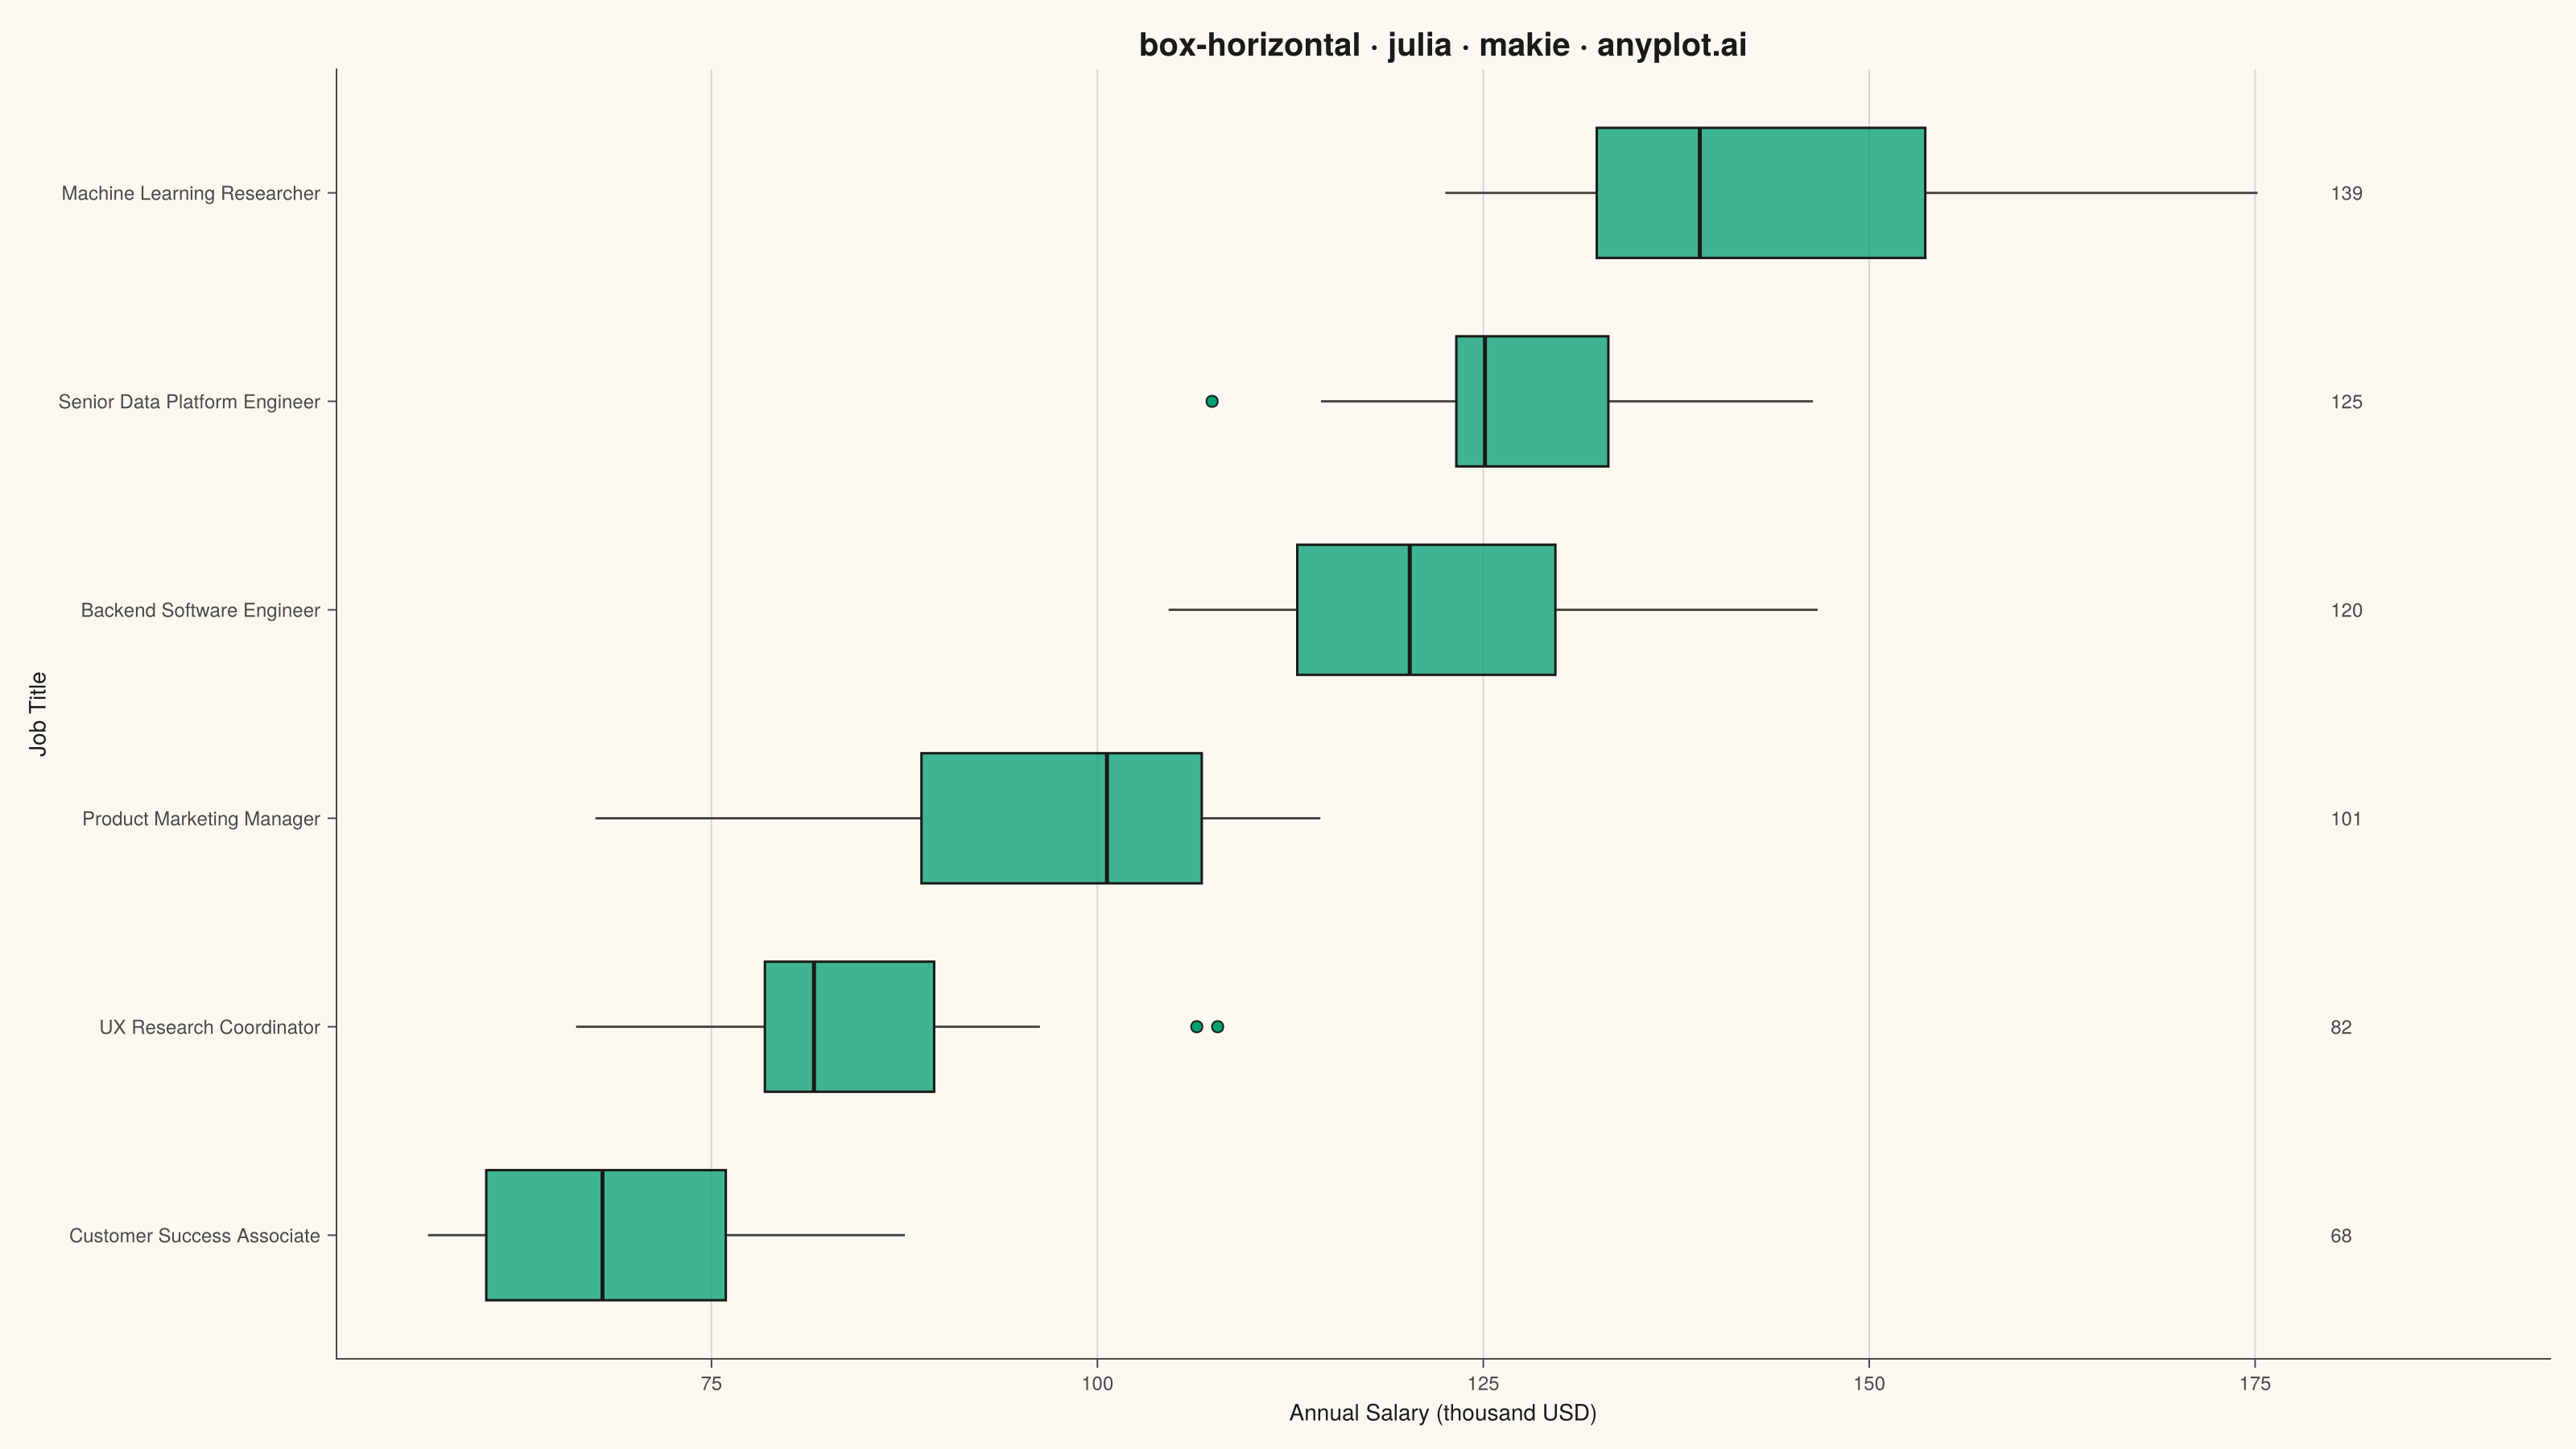
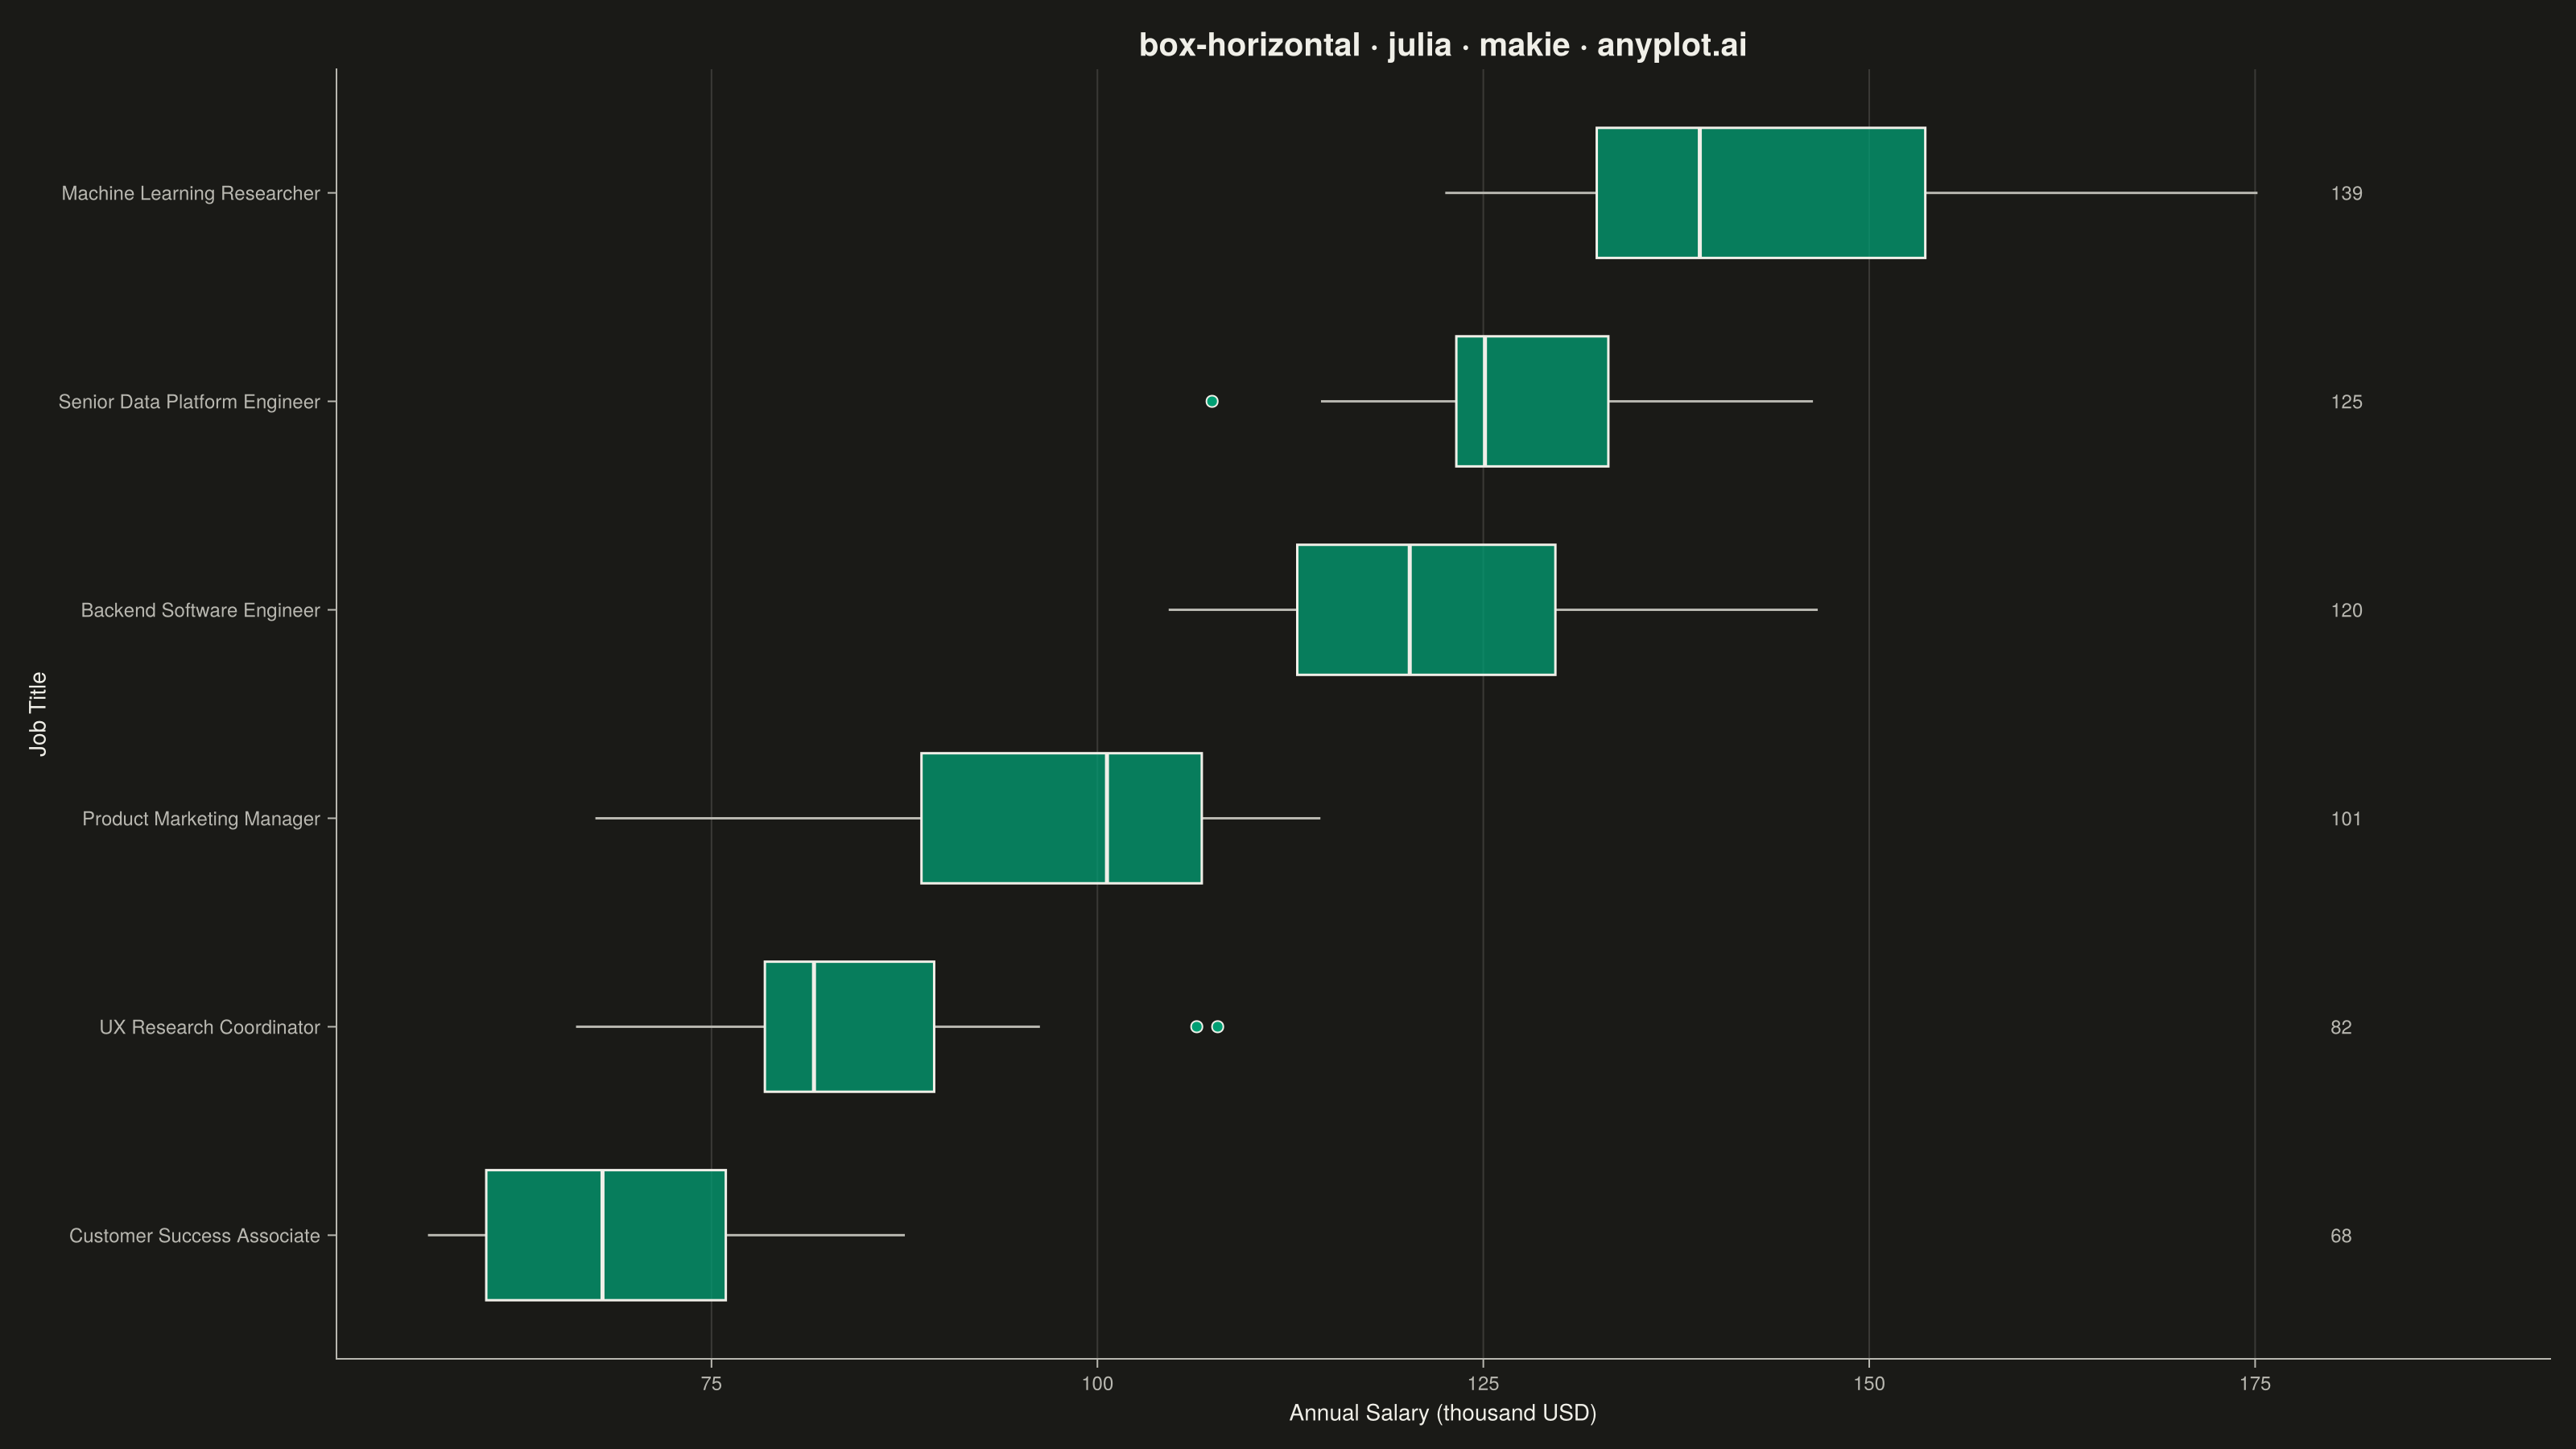
A horizontal box plot displays the distribution of numerical data through quartiles with the boxes oriented horizontally. This orientation is particularly useful when category labels are long or when comparing many groups, as it allows for easier reading of labels on the y-axis.
# anyplot.ai
# box-horizontal: Horizontal Box Plot
# Library: makie 0.21.9 | Julia 1.11.9
# Quality: 91/100 | Created: 2026-09-02

using CairoMakie
using Colors
using Random
using Statistics

Random.seed!(42)

# --- Theme tokens -------------------------------------------------------------
const THEME    = get(ENV, "ANYPLOT_THEME", "light")
const PAGE_BG  = THEME == "light" ? colorant"#FAF8F1" : colorant"#1A1A17"
const INK      = THEME == "light" ? colorant"#1A1A17" : colorant"#F0EFE8"
const INK_SOFT = THEME == "light" ? colorant"#4A4A44" : colorant"#B8B7B0"
const IMPRINT_PALETTE = [
    colorant"#009E73", colorant"#C475FD", colorant"#4467A3", colorant"#BD8233",
    colorant"#AE3030", colorant"#2ABCCD", colorant"#954477", colorant"#99B314",
]
const BRAND = IMPRINT_PALETTE[1]

# --- Data -----------------------------------------------------------------
job_titles = [
    "Senior Data Platform Engineer",
    "Machine Learning Researcher",
    "Product Marketing Manager",
    "Backend Software Engineer",
    "Customer Success Associate",
    "UX Research Coordinator",
]
n_per_group = 15
means = [128.0, 142.0, 96.0, 118.0, 68.0, 82.0]  # thousand USD
stds  = [14.0, 18.0, 11.0, 13.0, 9.0, 10.0]

salaries = Float64[]
group_idx = Int[]
for (i, (m, s)) in enumerate(zip(means, stds))
    append!(salaries, m .+ s .* randn(n_per_group))
    append!(group_idx, fill(i, n_per_group))
end

# Sort categories by median salary for easier comparison
medians = [median(salaries[group_idx .== i]) for i in eachindex(job_titles)]
sort_order = sortperm(medians)
sorted_titles = job_titles[sort_order]
rank_of = Dict(sort_order[rank] => rank for rank in eachindex(sort_order))
plot_positions = [rank_of[g] for g in group_idx]

# --- Plot -------------------------------------------------------------------
fig = Figure(
    resolution      = (1600, 900),
    fontsize        = 14,
    backgroundcolor = PAGE_BG,
)

ax = Axis(
    fig[1, 1];
    title              = "box-horizontal · julia · makie · anyplot.ai",
    titlesize          = 20,
    titlecolor         = INK,
    xlabel             = "Annual Salary (thousand USD)",
    ylabel             = "Job Title",
    xlabelsize         = 14,
    ylabelsize         = 14,
    xlabelcolor        = INK,
    ylabelcolor        = INK,
    xticklabelsize     = 12,
    yticklabelsize     = 12,
    xticklabelcolor    = INK_SOFT,
    yticklabelcolor    = INK_SOFT,
    xtickcolor         = INK_SOFT,
    ytickcolor         = INK_SOFT,
    backgroundcolor    = PAGE_BG,
    topspinevisible    = false,
    rightspinevisible  = false,
    leftspinecolor     = INK_SOFT,
    bottomspinecolor   = INK_SOFT,
    xgridcolor         = RGBAf(INK.r, INK.g, INK.b, 0.15),
    ygridvisible       = false,
    yticks             = (1:length(sorted_titles), sorted_titles),
)

boxplot!(
    ax, plot_positions, salaries;
    orientation         = :horizontal,
    color               = (BRAND, 0.75),
    strokecolor         = INK,
    strokewidth         = 1.5,
    mediancolor         = INK,
    medianlinewidth     = 2.5,
    whiskercolor        = INK_SOFT,
    whiskerlinewidth    = 1.5,
    outliercolor        = BRAND,
    outlierstrokecolor  = INK,
    outlierstrokewidth  = 1,
    markersize          = 10,
    width               = 0.78,
)

# Annotate each box with its median salary, offset past the whisker tip so
# the label never collides with the box or outlier markers.
sorted_medians = medians[sort_order]
data_range = maximum(salaries) - minimum(salaries)
label_x = maximum(salaries) + 0.04 * data_range
text!(
    ax, fill(label_x, length(sorted_medians)), 1:length(sorted_medians);
    text      = [string(round(Int, m)) for m in sorted_medians],
    align     = (:left, :center),
    fontsize  = 12,
    color     = INK_SOFT,
)
xlims!(ax, minimum(salaries) - 0.05 * data_range, label_x + 0.12 * data_range)

# --- Save -------------------------------------------------------------------
save("plot-$(THEME).png", fig; px_per_unit = 2)
Runnable source as JSON, for any HTTP client: https://api.anyplot.ai/specs/box-horizontal/makie/code. Any spec id and library id listed in llms-full.txt fit the same URL shape; every URL below is complete and callable.
{
  "spec_id": "box-horizontal",
  "language": "julia",
  "library": "makie",
  "page": "https://anyplot.ai/box-horizontal/julia/makie",
  "hub": "https://anyplot.ai/box-horizontal",
  "code_json": "https://api.anyplot.ai/specs/box-horizontal/makie/code",
  "spec_json": "https://api.anyplot.ai/specs/box-horizontal",
  "render_light_png": "https://storage.googleapis.com/anyplot-images/plots/box-horizontal/julia/makie/plot-light.png",
  "render_dark_png": "https://storage.googleapis.com/anyplot-images/plots/box-horizontal/julia/makie/plot-dark.png",
  "quality_score": 91.0,
  "license": "MIT",
  "guide": "https://anyplot.ai/llms.txt"
}
Part of Horizontal Box Plot on anyplot.ai.