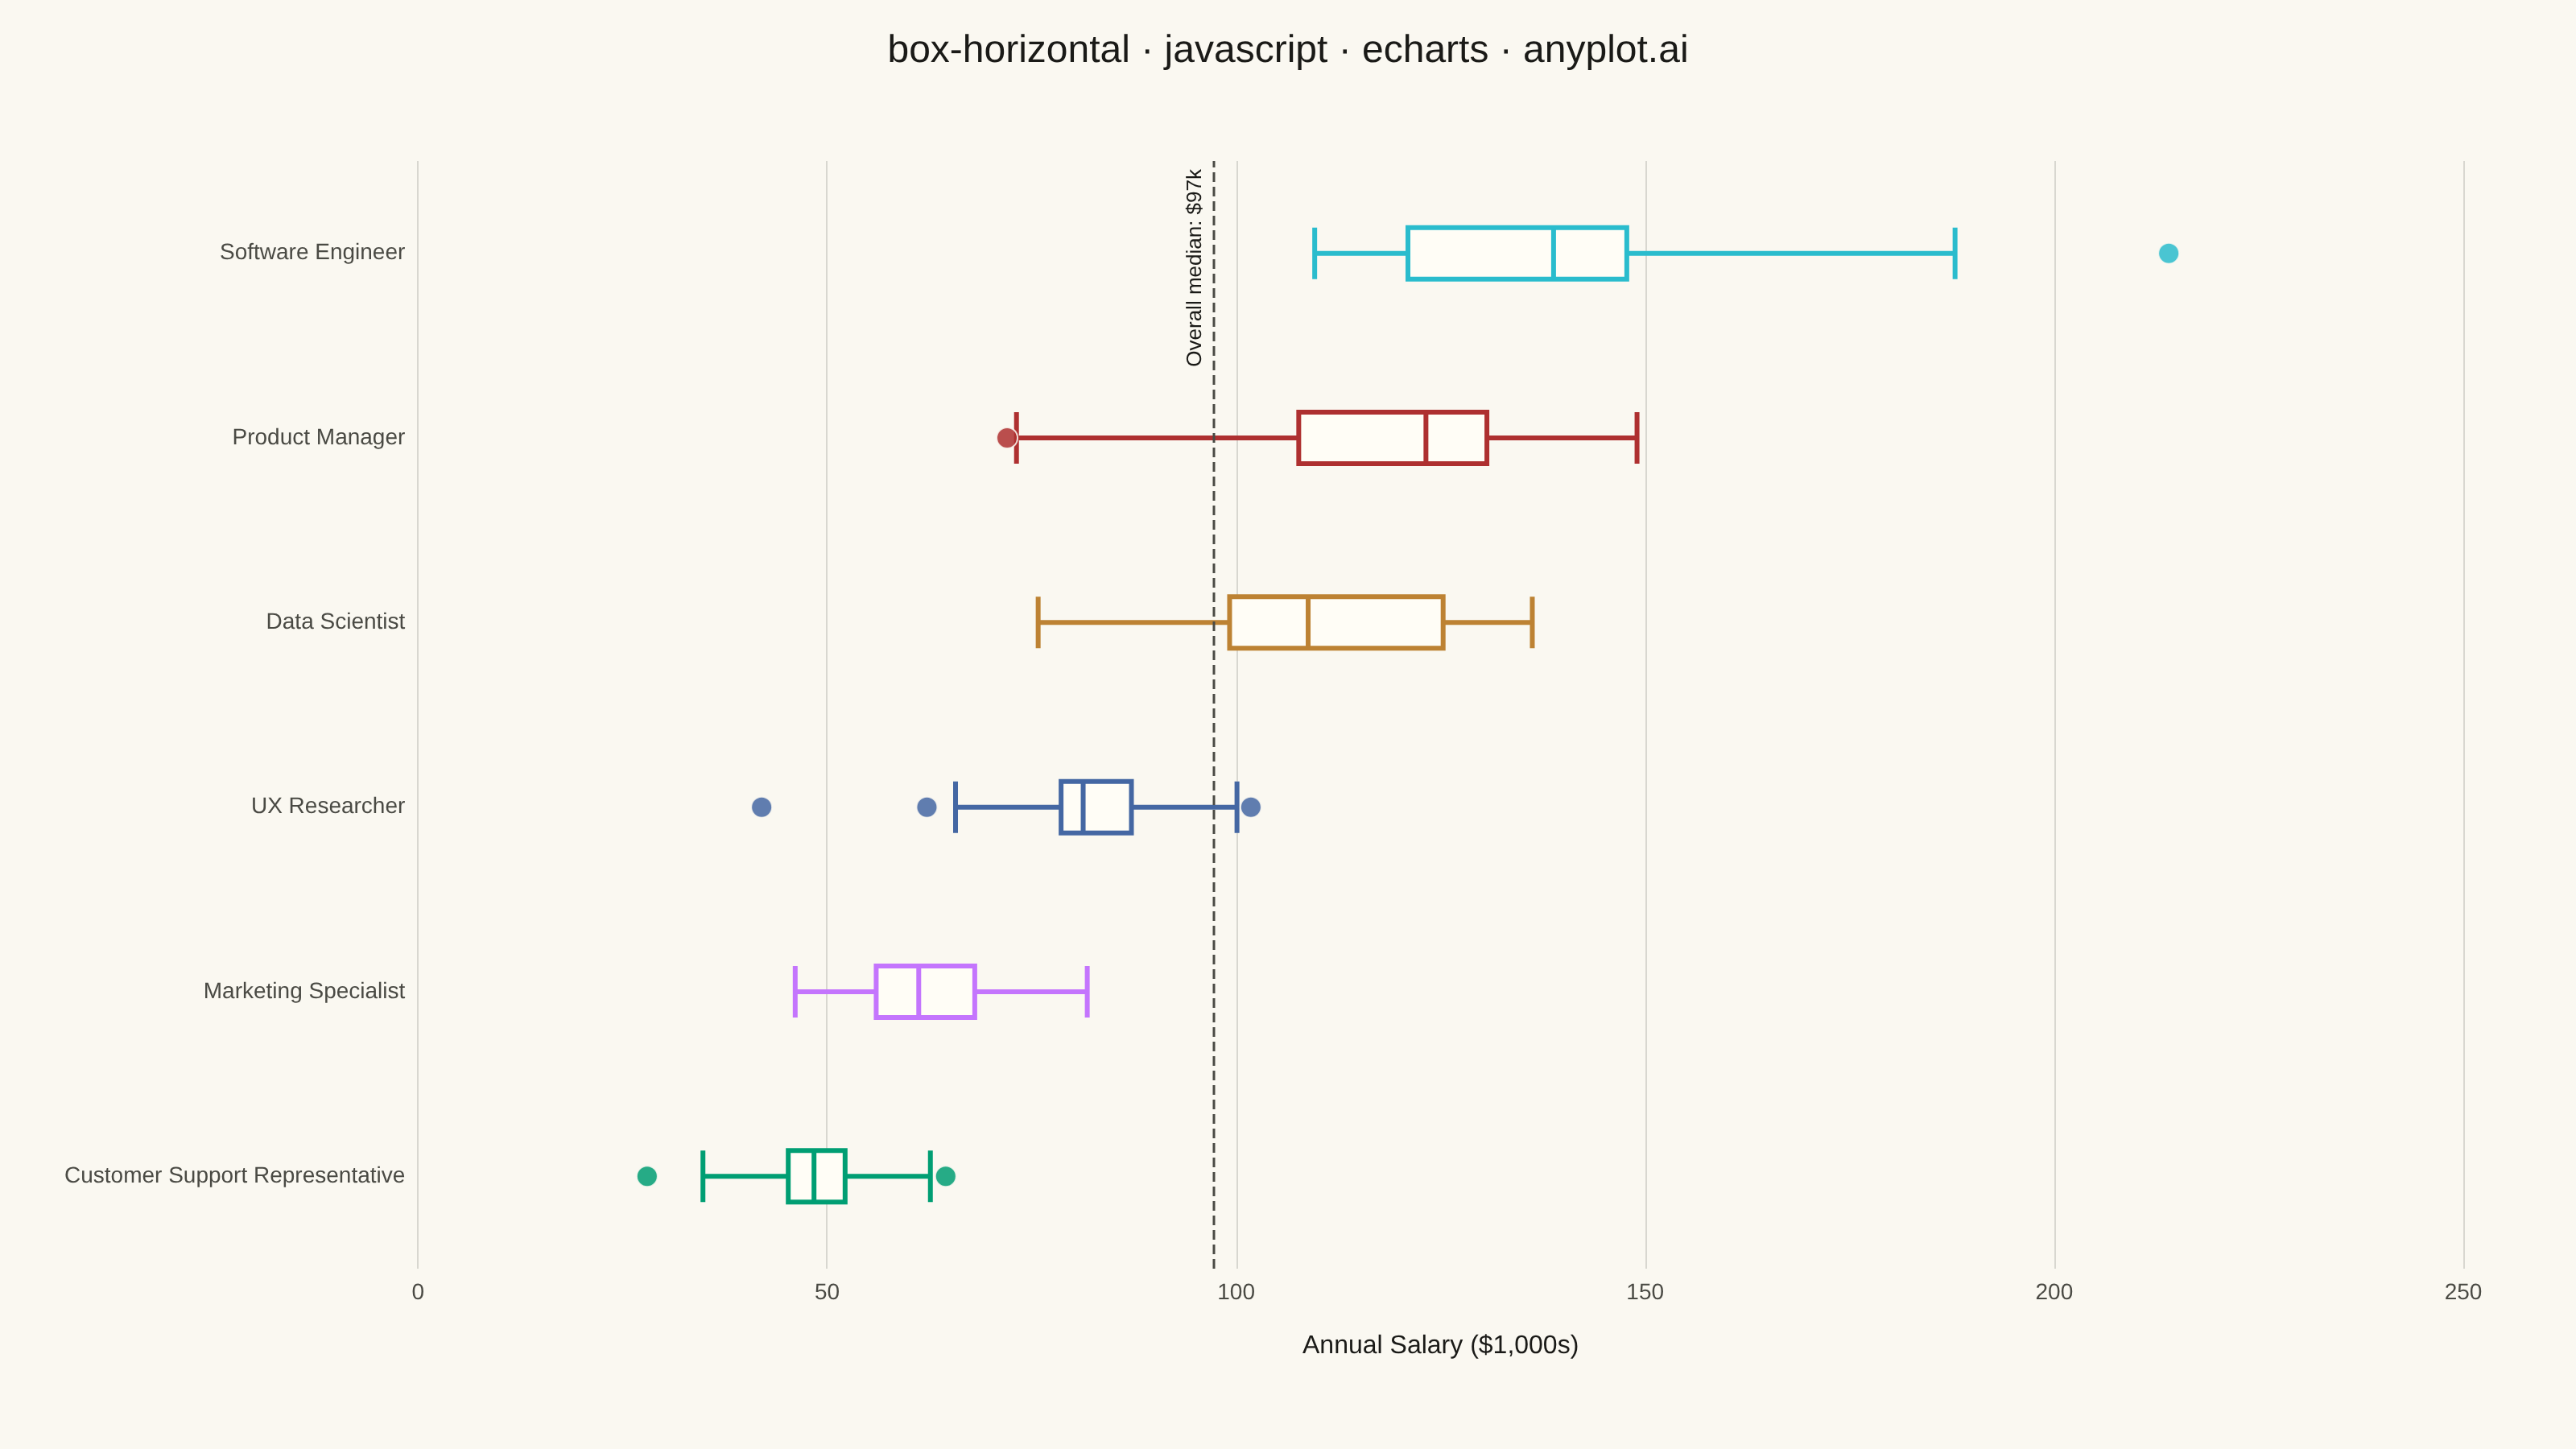
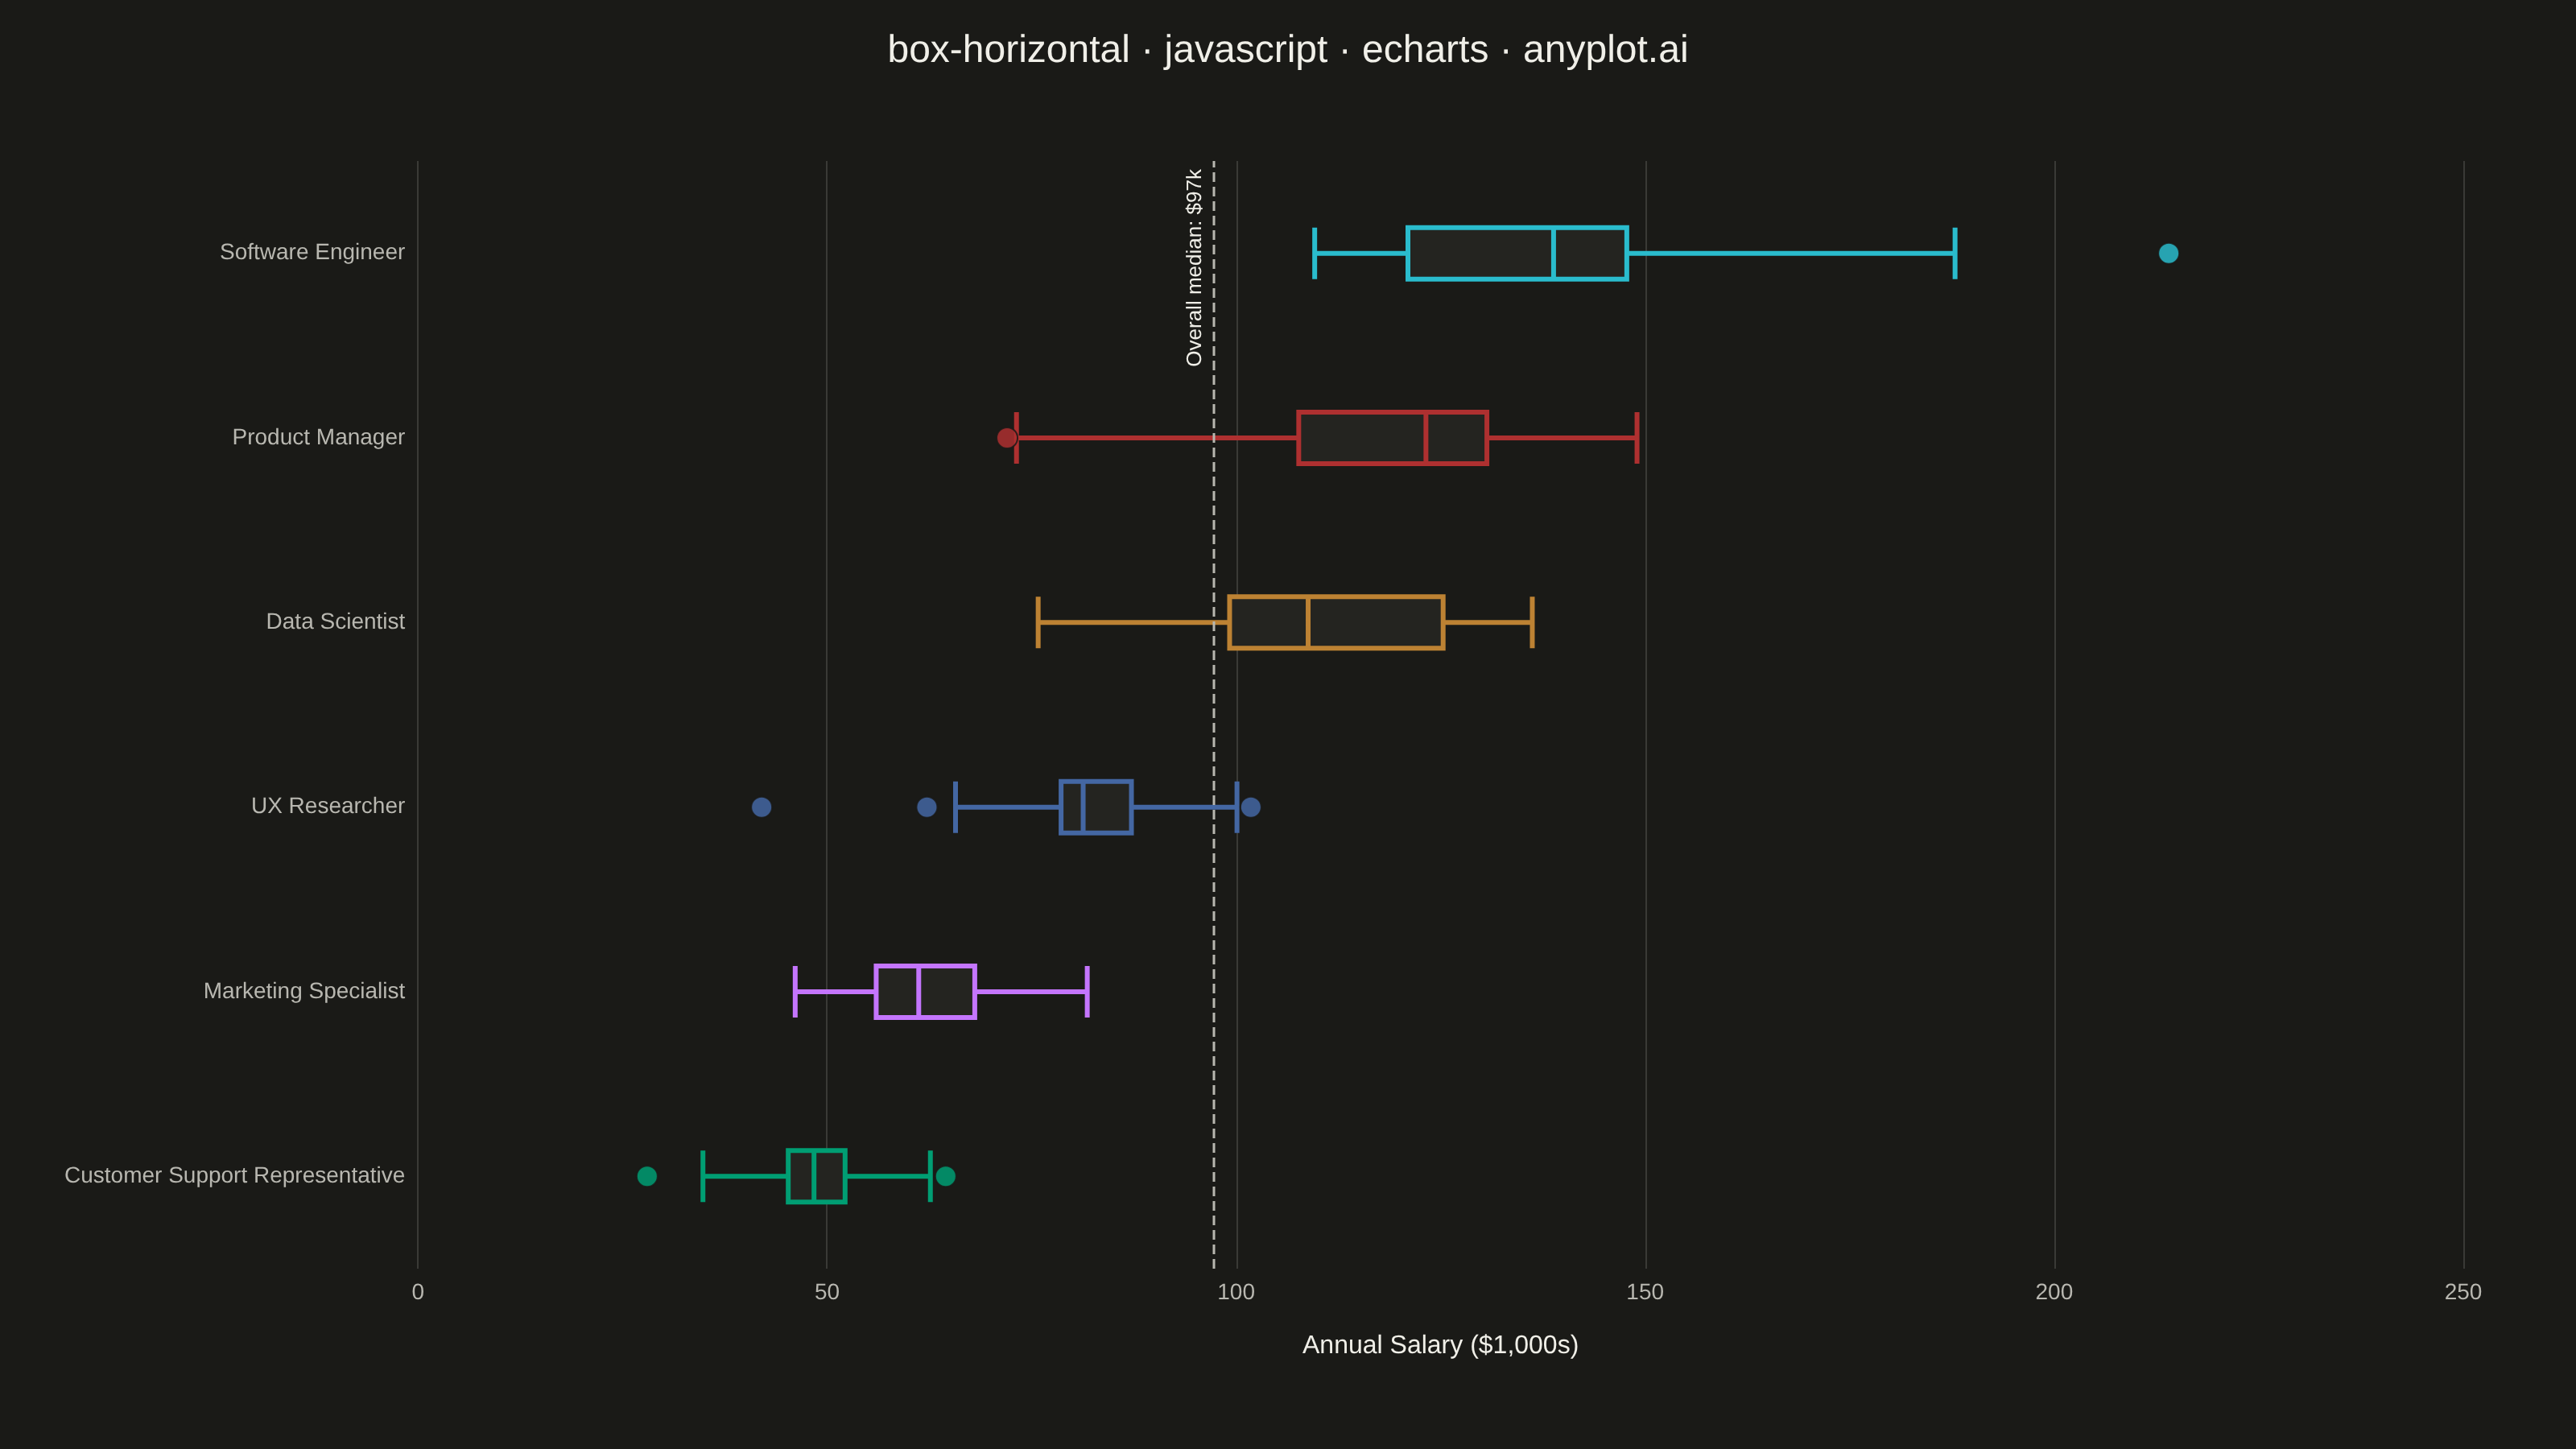
The same plot in 14 other libraries — JavaScript: Chart.js, D3.js, Highcharts, MUI X Charts; Python: Altair, Bokeh, lets-plot, Matplotlib, Plotly, plotnine, Pygal, Seaborn; R: ggplot2; Julia: Makie.jl. Compare all 15 side by side: Horizontal Box Plot in Python, R, Julia and JavaScript.
A horizontal box plot displays the distribution of numerical data through quartiles with the boxes oriented horizontally. This orientation is particularly useful when category labels are long or when comparing many groups, as it allows for easier reading of labels on the y-axis.
// anyplot.ai
// box-horizontal: Horizontal Box Plot
// Library: echarts 6.1.0 | JavaScript 22.23.2
// Quality: 91/100 | Created: 2026-09-02

const t = window.ANYPLOT_TOKENS;

// --- Data (in-memory, deterministic) ----------------------------------------
// Annual salary distributions by job title — long category labels are exactly
// where the horizontal orientation earns its keep (no rotated x-axis text).
function makeLcg(seed) {
  let state = seed % 2147483647;
  if (state <= 0) state += 2147483646;
  return function uniform() {
    state = (state * 16807) % 2147483647;
    return (state - 1) / 2147483646;
  };
}
const rand = makeLcg(42);

function randNormal(mean, std) {
  const u1 = rand();
  const u2 = rand();
  const z = Math.sqrt(-2 * Math.log(u1)) * Math.cos(2 * Math.PI * u2);
  return mean + z * std;
}

function median(sorted) {
  const mid = Math.floor(sorted.length / 2);
  return sorted.length % 2 === 0
    ? (sorted[mid - 1] + sorted[mid]) / 2
    : sorted[mid];
}

const roles = [
  {
    name: "Customer Support Representative",
    n: 20,
    mean: 48,
    std: 6,
    extra: [],
  },
  { name: "Marketing Specialist", n: 18, mean: 62, std: 9, extra: [] },
  { name: "UX Researcher", n: 16, mean: 88, std: 11, extra: [42] },
  { name: "Data Scientist", n: 17, mean: 118, std: 15, extra: [] },
  { name: "Product Manager", n: 18, mean: 125, std: 18, extra: [72] },
  { name: "Software Engineer", n: 22, mean: 132, std: 20, extra: [214] },
];

const withSalaries = roles.map((role) => {
  const salaries = [];
  for (let i = 0; i < role.n; i++) {
    salaries.push(
      Math.round(Math.max(28, randNormal(role.mean, role.std)) * 10) / 10,
    );
  }
  role.extra.forEach((v) => salaries.push(v));
  salaries.sort((a, b) => a - b);
  return { name: role.name, salaries };
});

// Sort by median ascending so the axis reads low-to-high bottom-to-top —
// per the spec's "sort by median for easier comparison" guidance.
withSalaries.sort((a, b) => median(a.salaries) - median(b.salaries));

const categoryNames = withSalaries.map((r) => r.name);
const rawSource = withSalaries.map((r) => r.salaries);
const overallMedian = median(
  withSalaries.flatMap((r) => r.salaries).sort((a, b) => a - b),
);

// --- Init ---------------------------------------------------------------
const chart = echarts.init(document.getElementById("container"));

// --- Option ---------------------------------------------------------------
// Quartiles, whiskers (1.5*IQR) and outliers are computed by ECharts' own
// built-in "boxplot" dataset transform (registered with the boxplot chart,
// no extra import needed) rather than reimplemented by hand. The transform
// yields two result sets: boxData (dataset[1]) and outliers (dataset[2]).
chart.setOption({
  animation: false,
  color: t.palette,
  backgroundColor: "transparent",
  title: {
    text: "box-horizontal · javascript · echarts · anyplot.ai",
    left: "center",
    textStyle: { color: t.ink, fontSize: 24, fontWeight: 500 },
  },
  dataset: [
    { source: rawSource },
    {
      fromDatasetIndex: 0,
      transform: {
        type: "boxplot",
        config: {
          itemNameFormatter: (params) => categoryNames[params.value],
        },
      },
    },
    { fromDatasetIndex: 1, fromTransformResult: 1 },
  ],
  grid: { left: 40, right: 70, top: 100, bottom: 90, containLabel: true },
  xAxis: {
    type: "value",
    name: "Annual Salary ($1,000s)",
    nameLocation: "middle",
    nameGap: 40,
    nameTextStyle: { color: t.ink, fontSize: 16 },
    axisLabel: { color: t.inkSoft, fontSize: 14 },
    axisLine: { show: false },
    splitLine: { lineStyle: { color: t.grid } },
  },
  yAxis: {
    type: "category",
    data: categoryNames,
    boundaryGap: true,
    axisLabel: { color: t.inkSoft, fontSize: 14 },
    axisLine: { show: false },
    axisTick: { show: false },
    splitLine: { show: false },
  },
  series: [
    {
      name: "Salary distribution",
      type: "boxplot",
      datasetIndex: 1,
      encode: { x: [1, 2, 3, 4, 5], y: 0 },
      // colorBy:"data" + boxplot's own stroke-only visualDrawType makes
      // ECharts cycle the Imprint palette across the box *borders* per
      // category automatically, while the fill stays a constant elevated
      // surface — the hollow-box look, driven by the library itself rather
      // than per-item itemStyle bookkeeping.
      colorBy: "data",
      boxWidth: [16, 32],
      itemStyle: { color: t.elevatedBg, borderWidth: 3 },
      markLine: {
        silent: true,
        symbol: "none",
        lineStyle: { color: t.inkSoft, type: "dashed", width: 1.5 },
        label: {
          color: t.ink,
          fontSize: 13,
          formatter: `Overall median: $${Math.round(overallMedian)}k`,
          position: "insideEndTop",
        },
        data: [{ xAxis: overallMedian }],
      },
    },
    {
      name: "Outliers",
      type: "scatter",
      datasetIndex: 2,
      encode: { x: 1, y: 0 },
      symbolSize: 13,
      itemStyle: {
        color: (params) =>
          t.palette[categoryNames.indexOf(params.value[0]) % t.palette.length],
        opacity: 0.85,
        borderColor: t.pageBg,
        borderWidth: 1,
      },
    },
  ],
});
Runnable source as JSON, for any HTTP client: https://api.anyplot.ai/specs/box-horizontal/echarts/code. Any spec id and library id listed in llms-full.txt fit the same URL shape; every URL below is complete and callable.
{
  "spec_id": "box-horizontal",
  "language": "javascript",
  "library": "echarts",
  "page": "https://anyplot.ai/box-horizontal/javascript/echarts",
  "hub": "https://anyplot.ai/box-horizontal",
  "code_json": "https://api.anyplot.ai/specs/box-horizontal/echarts/code",
  "spec_json": "https://api.anyplot.ai/specs/box-horizontal",
  "render_light_png": "https://storage.googleapis.com/anyplot-images/plots/box-horizontal/javascript/echarts/plot-light.png",
  "render_dark_png": "https://storage.googleapis.com/anyplot-images/plots/box-horizontal/javascript/echarts/plot-dark.png",
  "interactive_light_html": "https://storage.googleapis.com/anyplot-images/plots/box-horizontal/javascript/echarts/plot-light.html",
  "interactive_dark_html": "https://storage.googleapis.com/anyplot-images/plots/box-horizontal/javascript/echarts/plot-dark.html",
  "quality_score": 91.0,
  "license": "MIT",
  "guide": "https://anyplot.ai/llms.txt"
}
Part of Horizontal Box Plot on anyplot.ai.