The same plot in 14 other libraries — JavaScript: Chart.js, D3.js, Apache ECharts, Highcharts; Python: Altair, Bokeh, lets-plot, Matplotlib, Plotly, plotnine, Pygal, Seaborn; R: ggplot2; Julia: Makie.jl. Compare all 15 side by side: Horizontal Box Plot in Python, R, Julia and JavaScript.
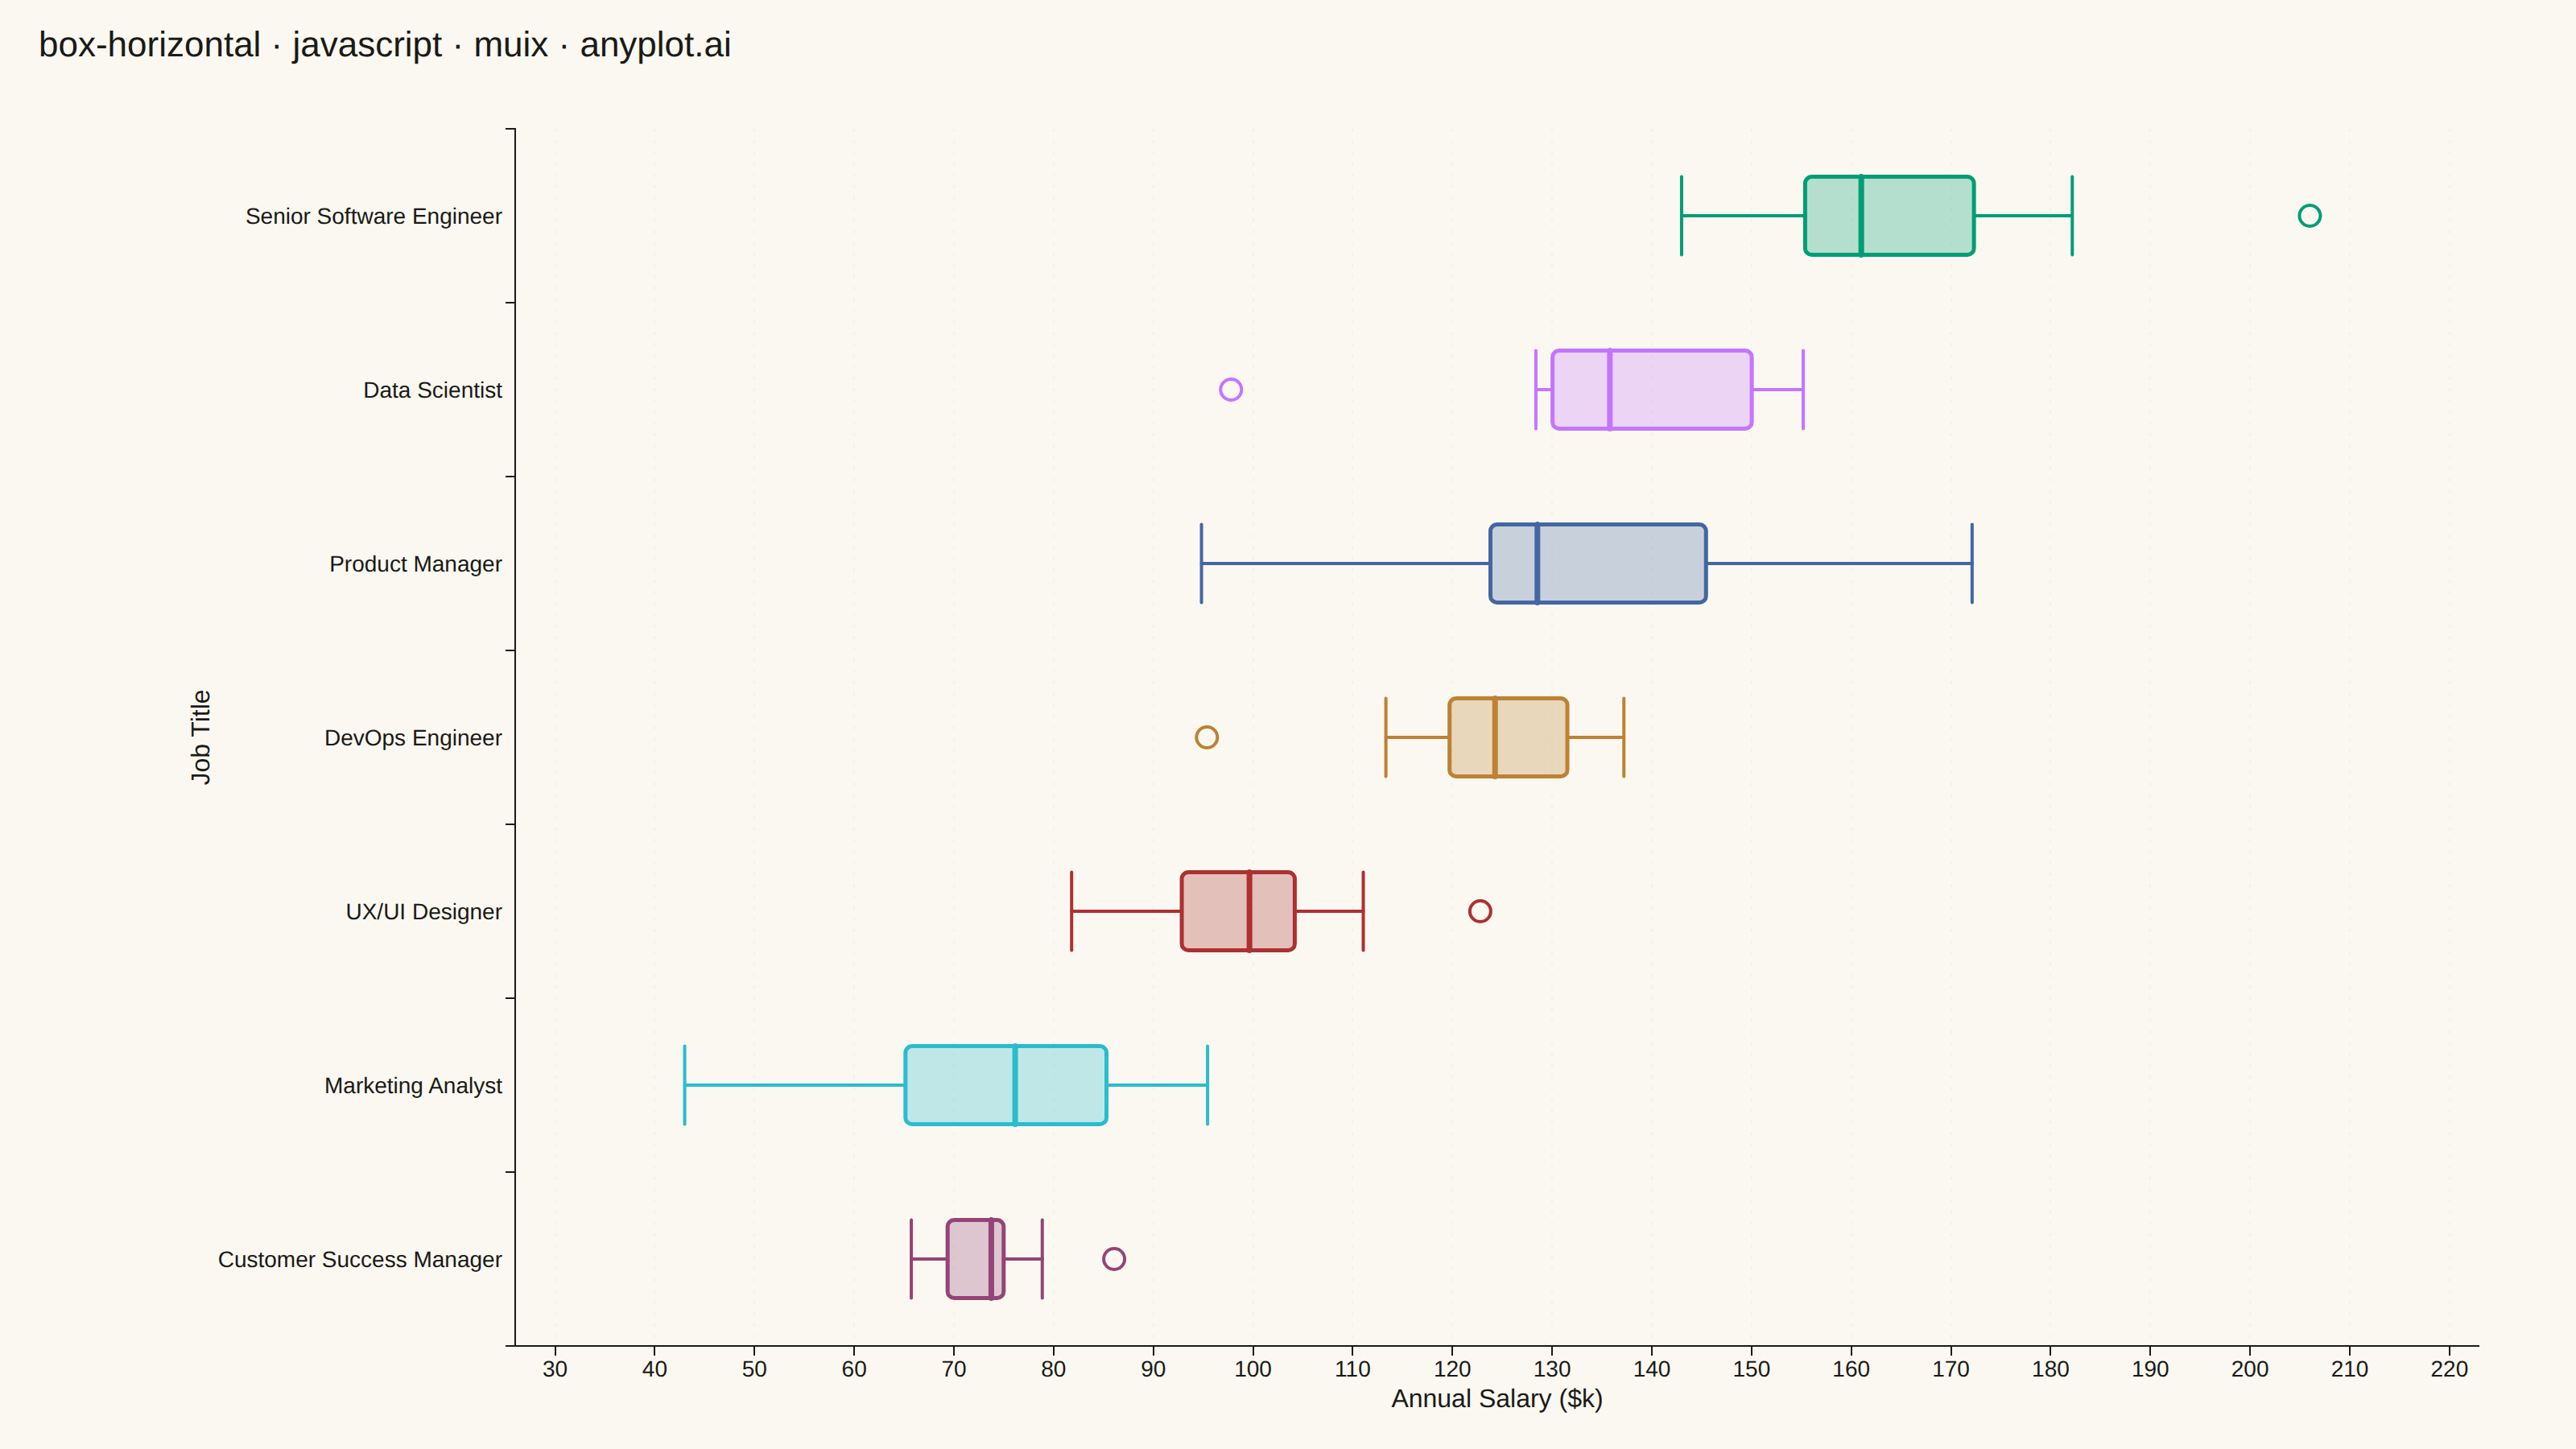
A horizontal box plot displays the distribution of numerical data through quartiles with the boxes oriented horizontally. This orientation is particularly useful when category labels are long or when comparing many groups, as it allows for easier reading of labels on the y-axis.
// anyplot.ai
// box-horizontal: Horizontal Box Plot
// Library: muix 7.29.1 | JavaScript 22.23.2
// Quality: 90/100 | Created: 2026-09-02
import { ChartContainer } from "@mui/x-charts/ChartContainer";
import { ChartsGrid } from "@mui/x-charts/ChartsGrid";
import { ChartsXAxis } from "@mui/x-charts/ChartsXAxis";
import { ChartsYAxis } from "@mui/x-charts/ChartsYAxis";
import { useXScale, useYScale } from "@mui/x-charts/hooks";

const t = window.ANYPLOT_TOKENS;
const TITLE = "box-horizontal · javascript · muix · anyplot.ai";
const TITLE_HEIGHT = 56;

// --- Data (in-memory, deterministic LCG — no seeded RNG in the browser) -----
function lcg(seed) {
  let state = seed;
  return () => {
    state = (state * 1664525 + 1013904223) % 4294967296;
    return state / 4294967296;
  };
}

function randomNormal(rand, mean, stdDev) {
  const u1 = Math.max(rand(), 1e-9);
  const u2 = rand();
  const z = Math.sqrt(-2 * Math.log(u1)) * Math.cos(2 * Math.PI * u2);
  return mean + z * stdDev;
}

function quantile(sorted, q) {
  const pos = (sorted.length - 1) * q;
  const base = Math.floor(pos);
  const rest = pos - base;
  return base + 1 < sorted.length
    ? sorted[base] + rest * (sorted[base + 1] - sorted[base])
    : sorted[base];
}

// Annual base salary ($k) by job title — long titles are exactly the case
// this orientation exists for, since they still read cleanly on the y-axis.
const roles = [
  { title: "Senior Software Engineer", mean: 152, std: 16, size: 13 },
  { title: "Data Scientist", mean: 138, std: 15, size: 12 },
  { title: "Product Manager", mean: 134, std: 19, size: 11 },
  { title: "DevOps Engineer", mean: 121, std: 13, size: 12 },
  { title: "UX/UI Designer", mean: 104, std: 14, size: 11 },
  { title: "Marketing Analyst", mean: 79, std: 11, size: 11 },
  { title: "Customer Success Manager", mean: 73, std: 9, size: 11 },
];

const rand = lcg(42);

// A couple of roles get one deliberate, deterministic extreme salary on top
// of the random draws (a rare senior hire, a below-band junior contract) so
// the outlier marker is demonstrated on more than one row.
const injectedOutliers = { "Senior Software Engineer": 206, "Marketing Analyst": 43 };

const boxStats = roles
  .map(({ title, mean, std, size }) => {
    const salaries = Array.from({ length: size }, () => Math.max(28, randomNormal(rand, mean, std)));
    if (title in injectedOutliers) salaries.push(injectedOutliers[title]);
    salaries.sort((a, b) => a - b);

    const q1 = quantile(salaries, 0.25);
    const median = quantile(salaries, 0.5);
    const q3 = quantile(salaries, 0.75);
    const iqr = q3 - q1;
    const lowerFence = q1 - 1.5 * iqr;
    const upperFence = q3 + 1.5 * iqr;
    const inliers = salaries.filter((v) => v >= lowerFence && v <= upperFence);
    const outliers = salaries.filter((v) => v < lowerFence || v > upperFence);

    return {
      title,
      q1,
      median,
      q3,
      whiskerLow: inliers.length ? Math.min(...inliers) : q1,
      whiskerHigh: inliers.length ? Math.max(...inliers) : q3,
      outliers,
    };
  })
  .sort((a, b) => b.median - a.median); // highest-paid role first (top row)

const categories = boxStats.map((s) => s.title);
const allValues = boxStats.flatMap((s) => [s.q1, s.median, s.q3, s.whiskerLow, s.whiskerHigh, ...s.outliers]);
const valuePad = (Math.max(...allValues) - Math.min(...allValues)) * 0.1;
const valueMin = Math.max(0, Math.floor(Math.min(...allValues) - valuePad));
const valueMax = Math.ceil(Math.max(...allValues) + valuePad);

// --- Box-and-whisker overlay -------------------------------------------------
// The community package (7.29.1) has no BoxPlot component — a custom SVG
// layer positioned via the chart's own band/linear scale hooks reproduces it
// while staying entirely within the community ChartContainer surface.
function BoxWhiskers() {
  const xScale = useXScale();
  const yScale = useYScale();
  const bandwidth = yScale.bandwidth();
  const boxHeight = bandwidth * 0.56;

  return (
    <g>
      {boxStats.map((s, i) => {
        const center = yScale(s.title) + bandwidth / 2;
        const top = center - boxHeight / 2;
        const bottom = center + boxHeight / 2;
        const color = t.palette[i % t.palette.length];

        return (
          <g key={s.title}>
            <line
              x1={xScale(s.whiskerLow)}
              x2={xScale(s.q1)}
              y1={center}
              y2={center}
              stroke={color}
              strokeWidth={2}
              strokeLinecap="round"
            />
            <line
              x1={xScale(s.q3)}
              x2={xScale(s.whiskerHigh)}
              y1={center}
              y2={center}
              stroke={color}
              strokeWidth={2}
              strokeLinecap="round"
            />
            <line
              x1={xScale(s.whiskerLow)}
              x2={xScale(s.whiskerLow)}
              y1={top}
              y2={bottom}
              stroke={color}
              strokeWidth={2}
              strokeLinecap="round"
            />
            <line
              x1={xScale(s.whiskerHigh)}
              x2={xScale(s.whiskerHigh)}
              y1={top}
              y2={bottom}
              stroke={color}
              strokeWidth={2}
              strokeLinecap="round"
            />
            <rect
              x={xScale(s.q1)}
              y={top}
              width={Math.max(1, xScale(s.q3) - xScale(s.q1))}
              height={boxHeight}
              rx={4}
              ry={4}
              fill={color}
              fillOpacity={0.28}
              stroke={color}
              strokeWidth={2.5}
            />
            <line
              x1={xScale(s.median)}
              x2={xScale(s.median)}
              y1={top}
              y2={bottom}
              stroke={color}
              strokeWidth={3.5}
              strokeLinecap="round"
            />
            {s.outliers.map((v, j) => (
              <circle key={j} cx={xScale(v)} cy={center} r={6.5} fill={t.pageBg} stroke={color} strokeWidth={2} />
            ))}
          </g>
        );
      })}
    </g>
  );
}

// --- Chart (default-exported component — the harness mounts it) ------------
export default function Chart() {
  const chartHeight = window.ANYPLOT_SIZE.height - TITLE_HEIGHT;

  return (
    <div style={{ width: window.ANYPLOT_SIZE.width, height: window.ANYPLOT_SIZE.height }}>
      <div
        style={{
          height: TITLE_HEIGHT,
          lineHeight: `${TITLE_HEIGHT}px`,
          paddingLeft: 24,
          fontSize: 22,
          fontWeight: 500,
          color: t.ink,
        }}
      >
        {TITLE}
      </div>
      <ChartContainer
        width={window.ANYPLOT_SIZE.width}
        height={chartHeight}
        series={[]}
        skipAnimation
        margin={{ top: 24, right: 60, bottom: 64, left: 320 }}
        xAxis={[
          {
            id: "salary",
            scaleType: "linear",
            min: valueMin,
            max: valueMax,
            label: "Annual Salary ($k)",
            labelStyle: { fontSize: 16 },
            tickLabelStyle: { fontSize: 14 },
          },
        ]}
        yAxis={[
          {
            id: "role",
            scaleType: "band",
            data: categories,
            label: "Job Title",
            labelStyle: { fontSize: 16 },
            tickLabelStyle: { fontSize: 14 },
          },
        ]}
      >
        <ChartsGrid vertical sx={{ "& .MuiChartsGrid-line": { opacity: 0.2, strokeDasharray: "2 5" } }} />
        <BoxWhiskers />
        <ChartsXAxis axisId="salary" />
        <ChartsYAxis axisId="role" slotProps={{ axisLabel: { x: -190 } }} />
      </ChartContainer>
    </div>
  );
}
Runnable source as JSON, for any HTTP client: https://api.anyplot.ai/specs/box-horizontal/muix/code. Any spec id and library id listed in llms-full.txt fit the same URL shape; every URL below is complete and callable.
{
  "spec_id": "box-horizontal",
  "language": "javascript",
  "library": "muix",
  "page": "https://anyplot.ai/box-horizontal/javascript/muix",
  "hub": "https://anyplot.ai/box-horizontal",
  "code_json": "https://api.anyplot.ai/specs/box-horizontal/muix/code",
  "spec_json": "https://api.anyplot.ai/specs/box-horizontal",
  "render_light_png": "https://storage.googleapis.com/anyplot-images/plots/box-horizontal/javascript/muix/plot-light.png",
  "render_dark_png": "https://storage.googleapis.com/anyplot-images/plots/box-horizontal/javascript/muix/plot-dark.png",
  "interactive_light_html": "https://storage.googleapis.com/anyplot-images/plots/box-horizontal/javascript/muix/plot-light.html",
  "interactive_dark_html": "https://storage.googleapis.com/anyplot-images/plots/box-horizontal/javascript/muix/plot-dark.html",
  "quality_score": 90.0,
  "license": "MIT",
  "guide": "https://anyplot.ai/llms.txt"
}
Part of Horizontal Box Plot on anyplot.ai.