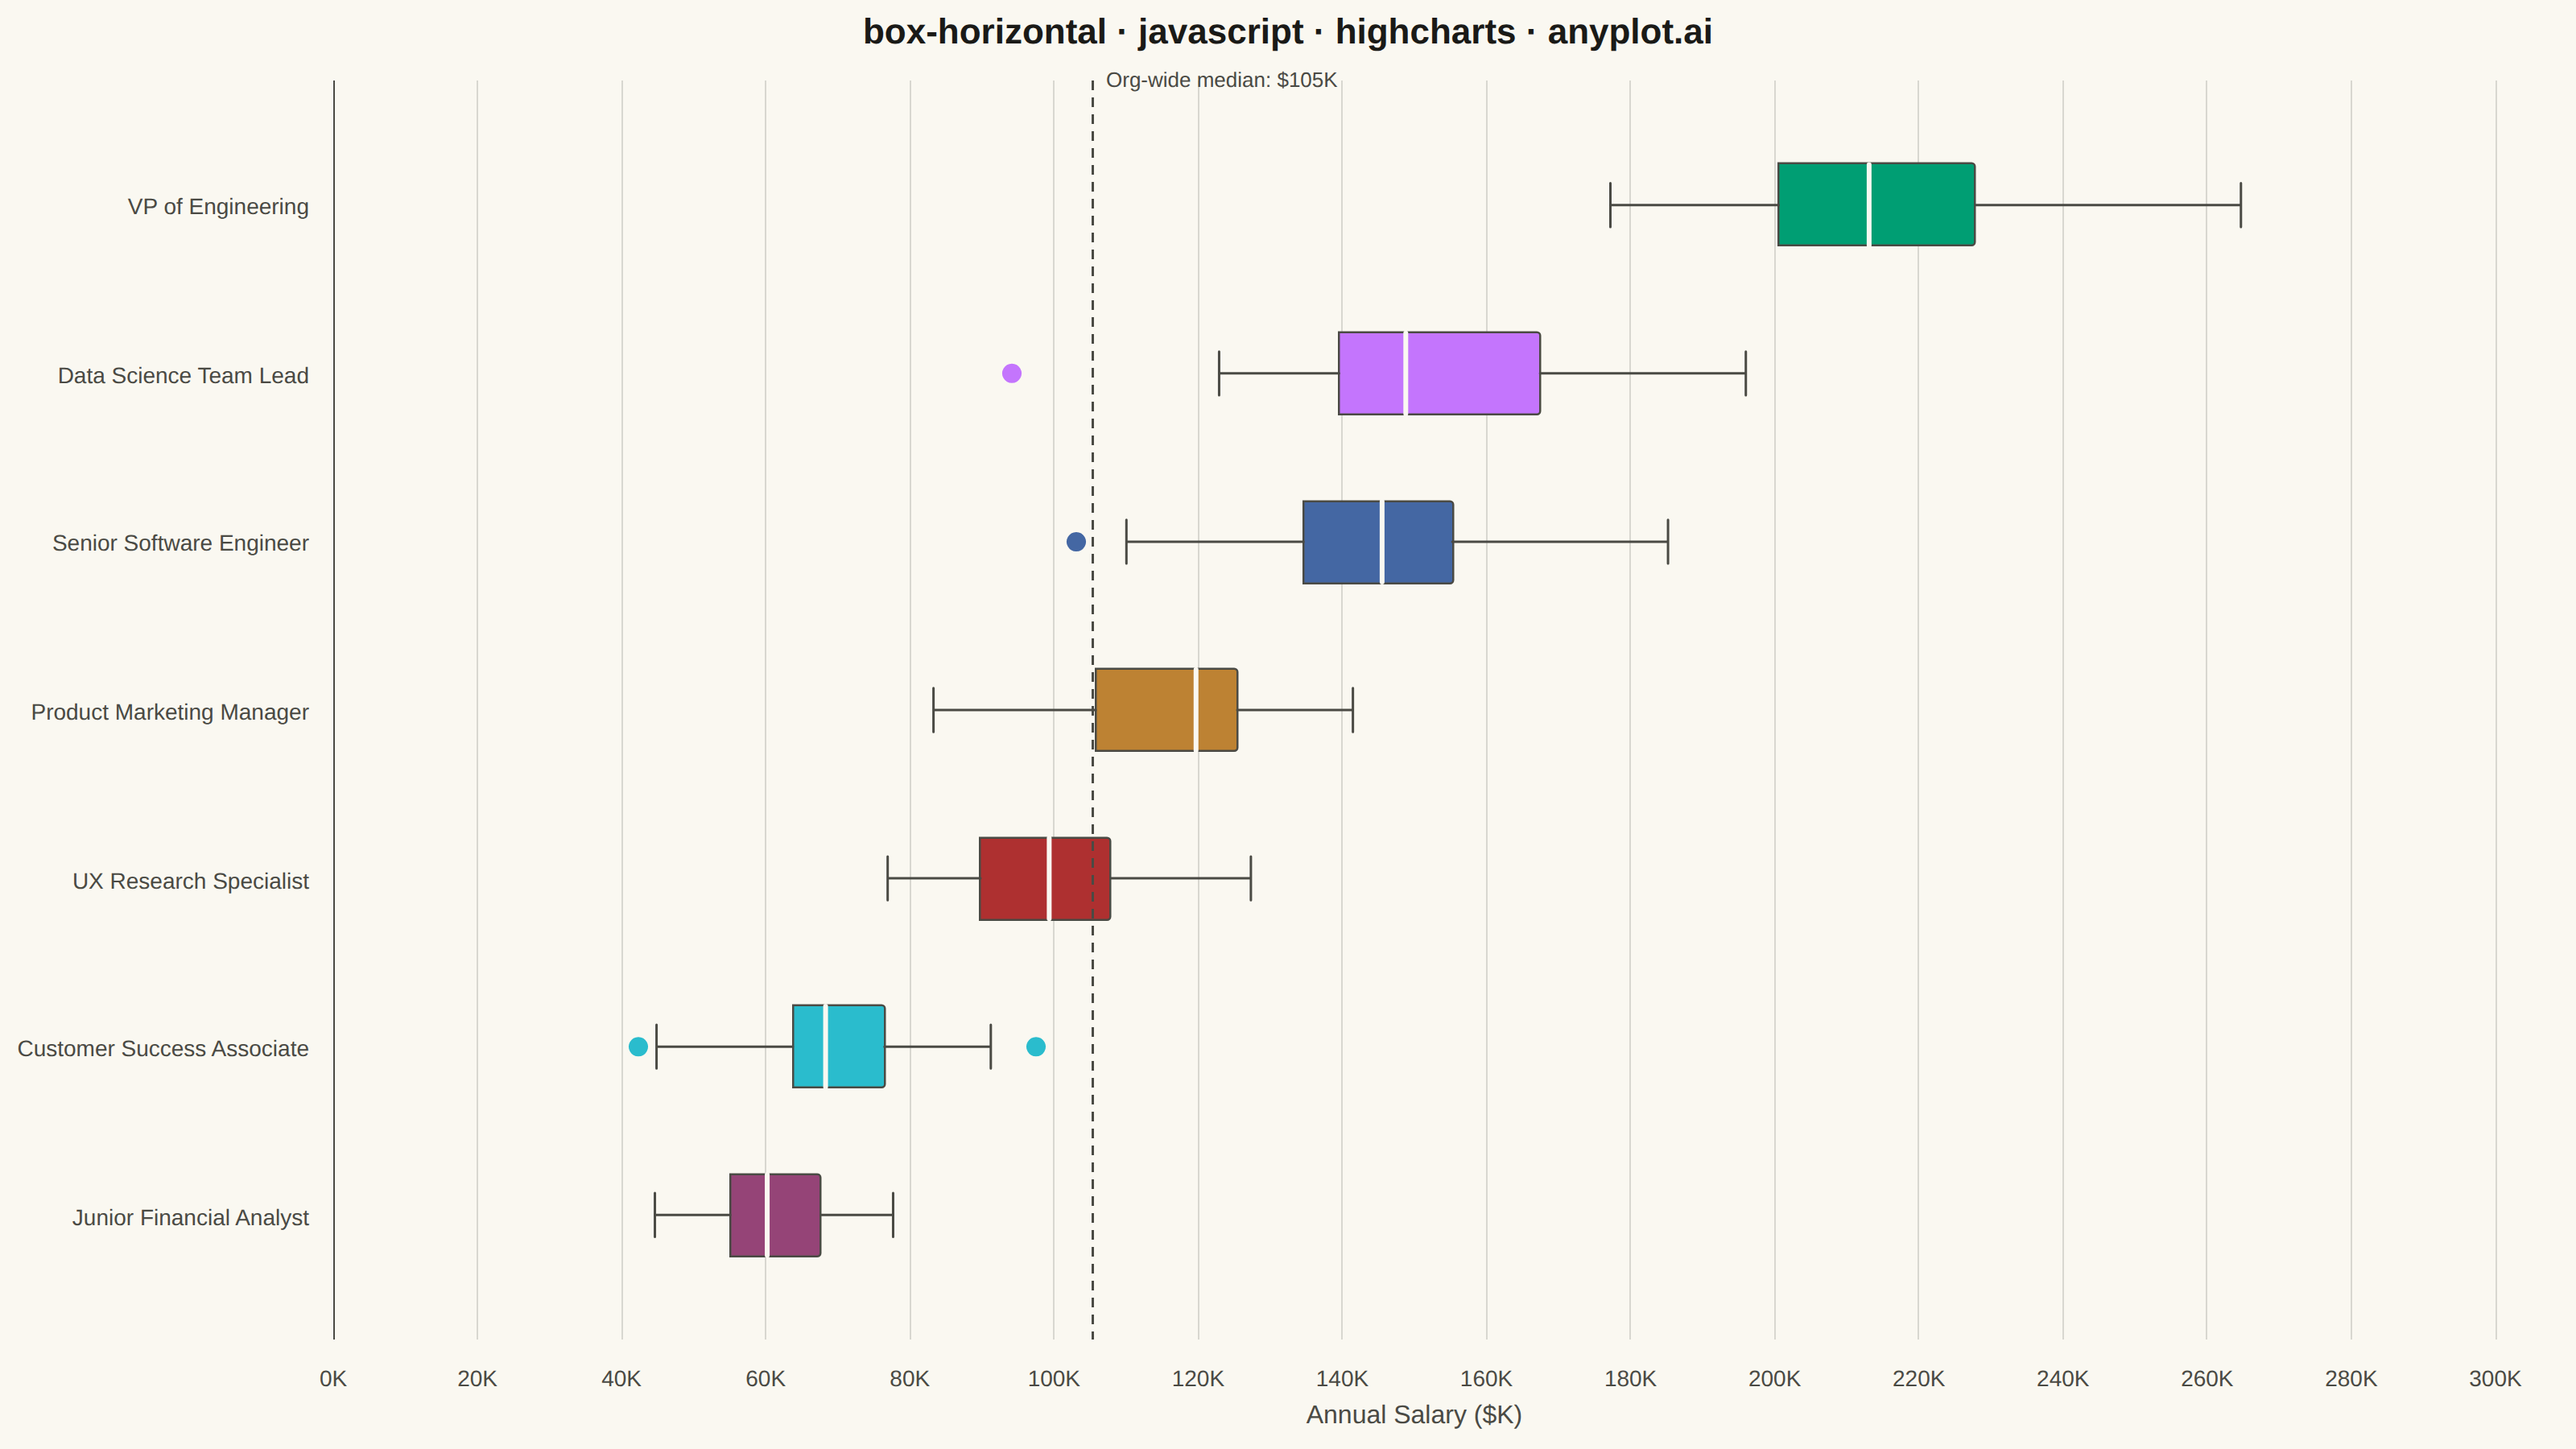
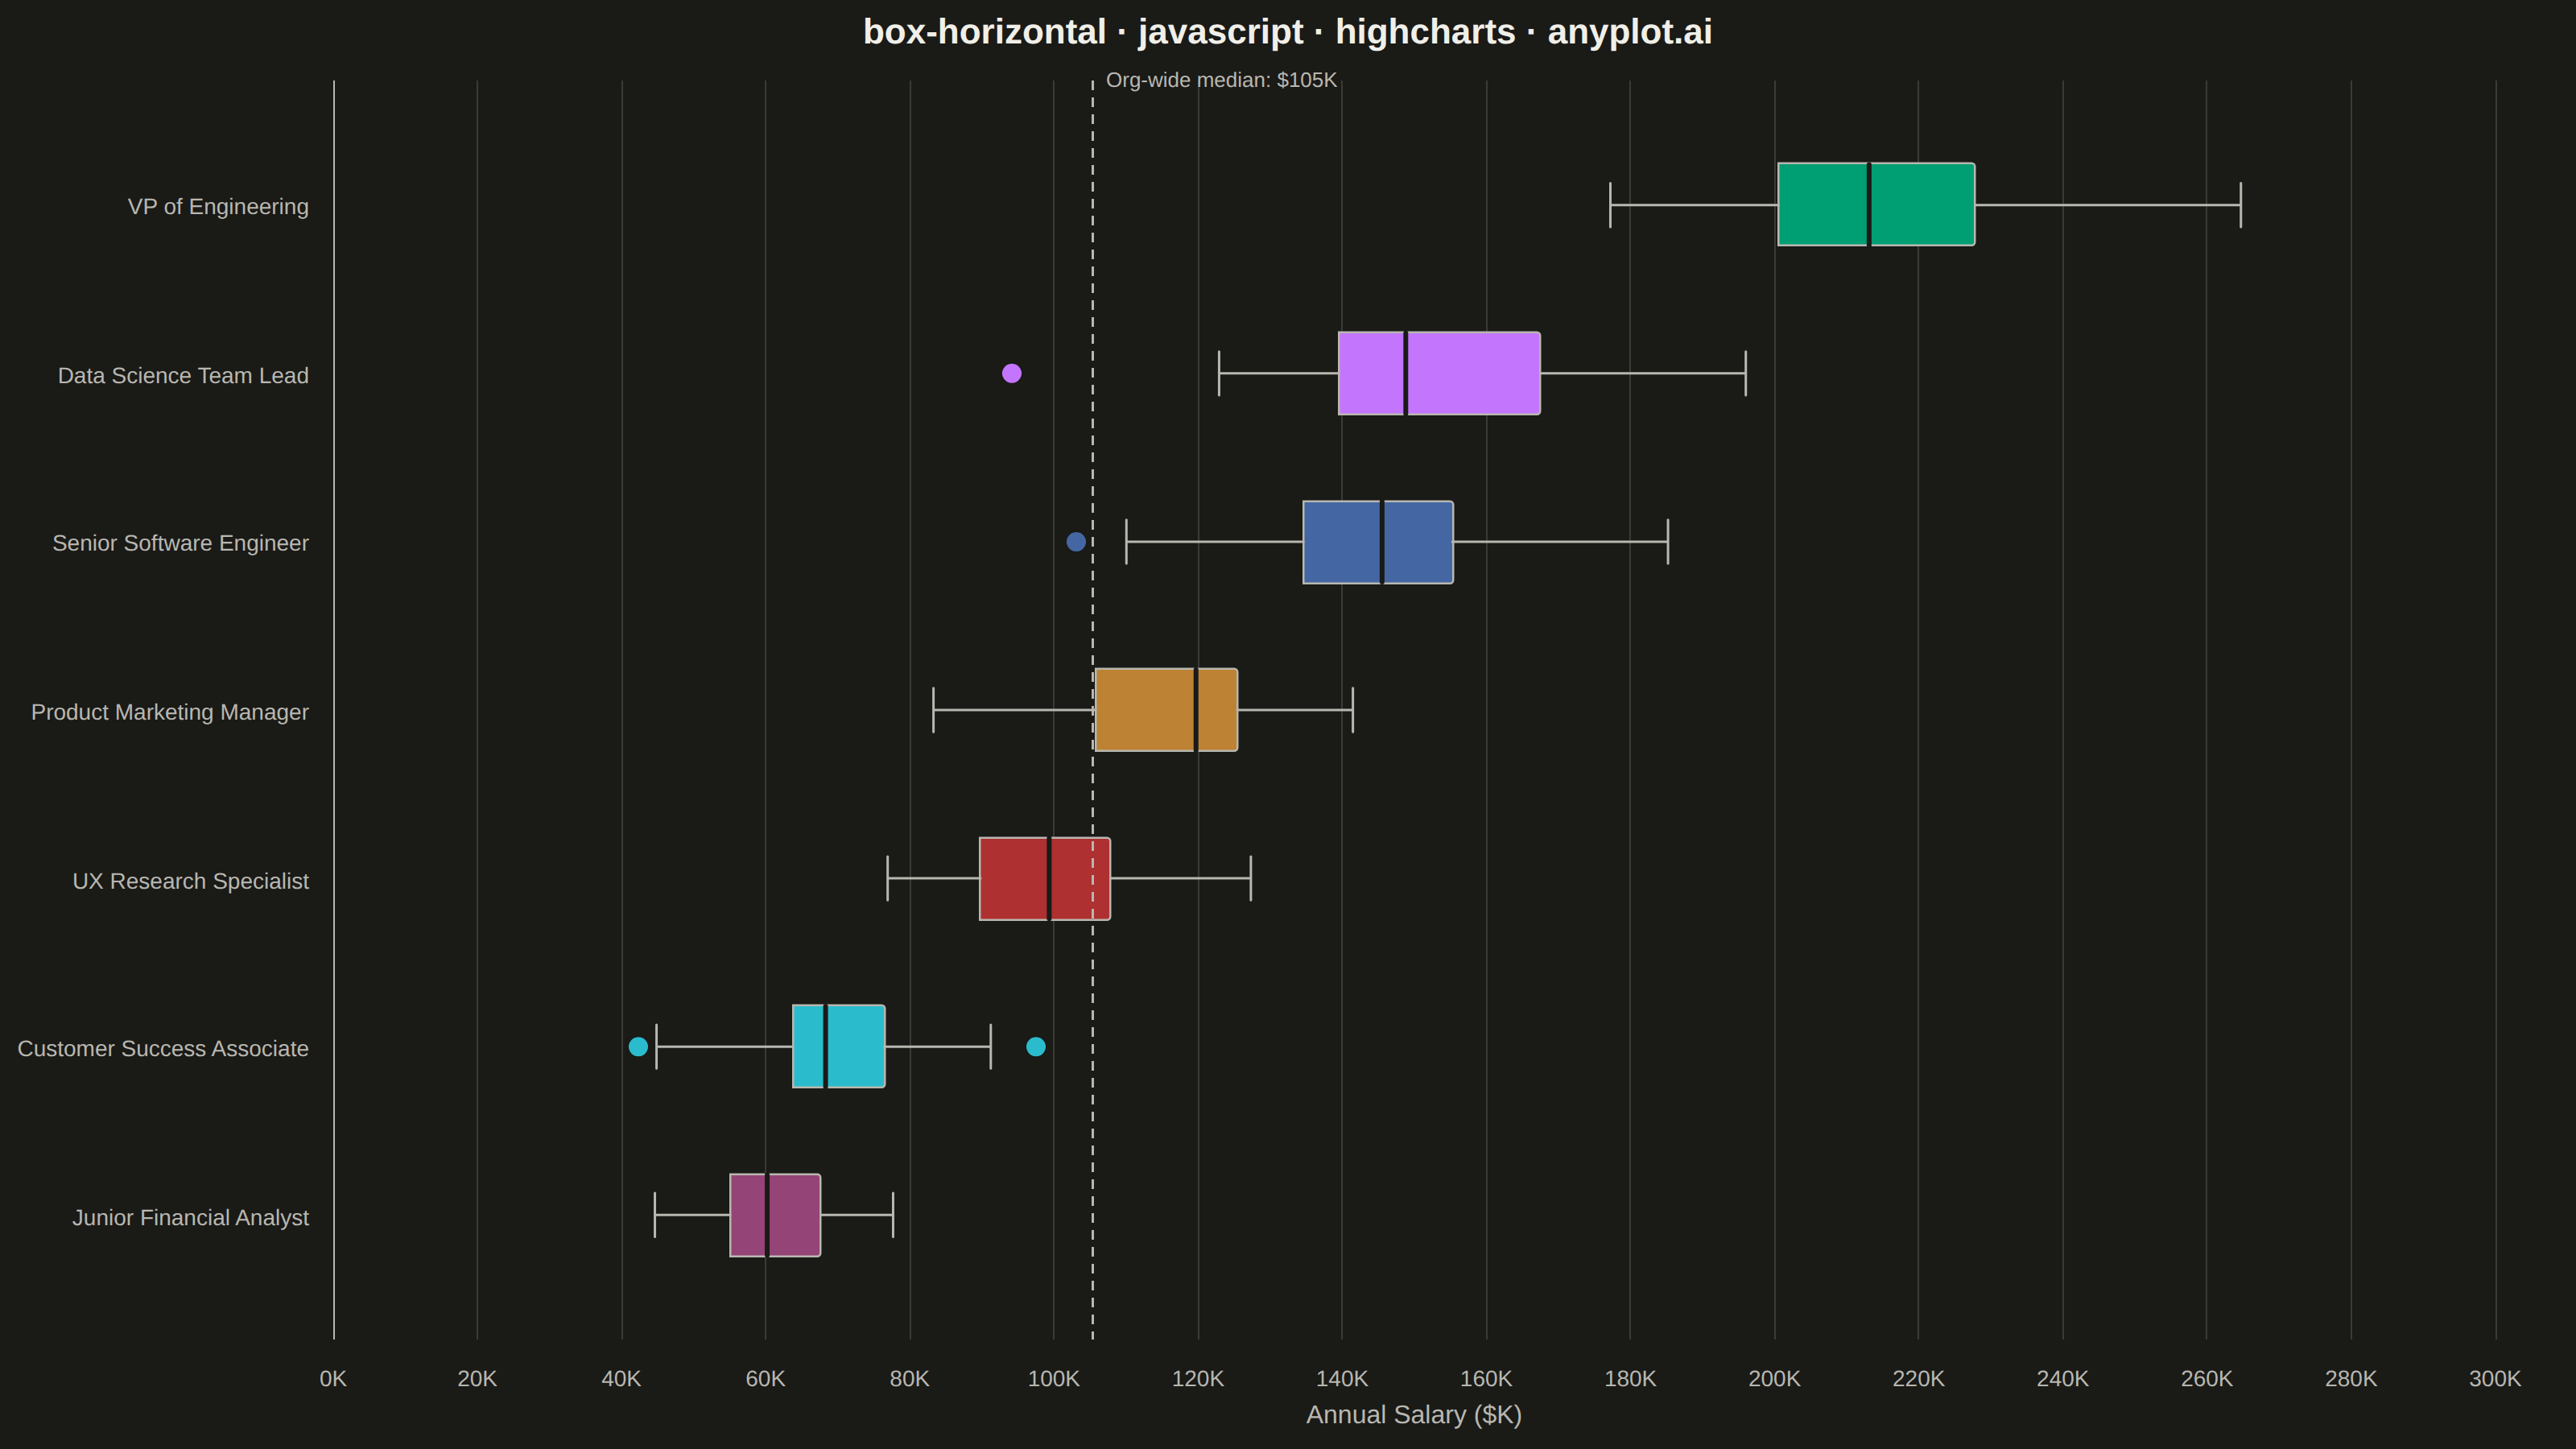
The same plot in 14 other libraries — JavaScript: Chart.js, D3.js, Apache ECharts, MUI X Charts; Python: Altair, Bokeh, lets-plot, Matplotlib, Plotly, plotnine, Pygal, Seaborn; R: ggplot2; Julia: Makie.jl. Compare all 15 side by side: Horizontal Box Plot in Python, R, Julia and JavaScript.
A horizontal box plot displays the distribution of numerical data through quartiles with the boxes oriented horizontally. This orientation is particularly useful when category labels are long or when comparing many groups, as it allows for easier reading of labels on the y-axis.
// anyplot.ai
// box-horizontal: Horizontal Box Plot
// Library: highcharts 12.6.0 | JavaScript 22.23.2
// Quality: 96/100 | Created: 2026-09-02

// The core bundle (no highcharts-more) has no "boxplot" series type, so the box
// is built from two stacked "bar" series (an invisible floor up to Q1, then a
// visible box from Q1 to Q3, colorByPoint from the Imprint palette). Whiskers
// and the median are drawn as two extra core "line" series (null-separated
// segments, one per category) rather than custom chart.renderer shapes — a
// series defined after the box series always layers on top, which is what a
// median mark sitting inside the box needs. chart.type: "bar" inverts the
// axes so the category axis reads vertically — the whole point of this spec.
const t = window.ANYPLOT_TOKENS;

// --- Data (in-memory, deterministic LCG) ------------------------------------
let seed = 7;
function lcg() {
  seed = (seed * 1103515245 + 12345) & 0x7fffffff;
  return seed / 0x7fffffff;
}
function randNormal(mean, std) {
  const u1 = Math.max(lcg(), 1e-9);
  const u2 = lcg();
  const z = Math.sqrt(-2 * Math.log(u1)) * Math.cos(2 * Math.PI * u2);
  return mean + z * std;
}
function quartile(sorted, q) {
  const pos = (sorted.length - 1) * q;
  const base = Math.floor(pos);
  const rest = pos - base;
  return sorted[base + 1] !== undefined
    ? sorted[base] + rest * (sorted[base + 1] - sorted[base])
    : sorted[base];
}
function boxStats(values) {
  const sorted = [...values].sort((a, b) => a - b);
  const q1 = quartile(sorted, 0.25);
  const median = quartile(sorted, 0.5);
  const q3 = quartile(sorted, 0.75);
  const iqr = q3 - q1;
  const lowerFence = q1 - 1.5 * iqr;
  const upperFence = q3 + 1.5 * iqr;
  const inRange = sorted.filter((v) => v >= lowerFence && v <= upperFence);
  return {
    q1,
    median,
    q3,
    whiskerLow: inRange[0],
    whiskerHigh: inRange[inRange.length - 1],
    outliers: sorted.filter((v) => v < lowerFence || v > upperFence),
  };
}

// Long job-title labels are exactly where a horizontal box plot earns its
// keep — they'd collide or need rotation on a vertical category axis.
const roles = [
  { name: "VP of Engineering", mean: 210, std: 24, n: 22 },
  { name: "Data Science Team Lead", mean: 156, std: 19, n: 38 },
  { name: "Senior Software Engineer", mean: 145, std: 17, n: 60 },
  { name: "Product Marketing Manager", mean: 118, std: 15, n: 45 },
  { name: "UX Research Specialist", mean: 98, std: 12, n: 40 },
  { name: "Customer Success Associate", mean: 68, std: 9, n: 70 },
  { name: "Junior Financial Analyst", mean: 62, std: 8, n: 55 },
];
const statsByRole = {};
const allSalaries = [];
roles.forEach((r) => {
  const salaries = Array.from({ length: r.n }, () =>
    Math.max(35, randNormal(r.mean, r.std))
  );
  statsByRole[r.name] = boxStats(salaries);
  allSalaries.push(...salaries);
});
// Pooled-median reference line — the storytelling device that lets a reader
// see at a glance which roles sit above/below the org-wide typical salary.
const overallMedian = quartile(
  [...allSalaries].sort((a, b) => a - b),
  0.5
);

// Sort by median so the highest-paid role reads first — easier comparison,
// per the spec's note on ordering categories by median value.
const sortedRoles = [...roles].sort(
  (a, b) => statsByRole[b.name].median - statsByRole[a.name].median
);
const categories = sortedRoles.map((r) => r.name);

// Whiskers (box edge → fence) and caps, one null-separated "line" series for
// every category so a single series draws all the disconnected segments.
// Every entry (including gaps) carries an explicit x so a mixed array of real
// points and null-y gap markers can't be re-bucketed by an auto pointStart/
// pointInterval index — only the y:null gaps break the connecting line.
const capHalf = 0.13;
const whiskerData = categories.flatMap((name, i) => {
  const s = statsByRole[name];
  return [
    { x: i, y: s.q3 }, { x: i, y: s.whiskerHigh }, { x: i, y: null },
    { x: i - capHalf, y: s.whiskerHigh }, { x: i + capHalf, y: s.whiskerHigh }, { x: i, y: null },
    { x: i, y: s.q1 }, { x: i, y: s.whiskerLow }, { x: i, y: null },
    { x: i - capHalf, y: s.whiskerLow }, { x: i + capHalf, y: s.whiskerLow }, { x: i, y: null },
  ];
});
// Median line spans the same half-width as the box itself (matches the
// pointPadding/groupPadding below), drawn as its own series so it renders on
// top of the box fill instead of being covered by it.
const boxHalf = 0.24;
const medianData = categories.flatMap((name, i) => [
  { x: i - boxHalf, y: statsByRole[name].median },
  { x: i + boxHalf, y: statsByRole[name].median },
  { x: i, y: null },
]);

// --- Chart -------------------------------------------------------------------
Highcharts.chart("container", {
  chart: {
    type: "bar",
    backgroundColor: "transparent",
    animation: false,
    style: { fontFamily: "inherit" },
    marginRight: 50, // room for the rightmost value-axis tick label, which sits at the plot edge in an inverted chart
  },
  credits: { enabled: false },
  colors: t.palette,
  title: {
    text: "box-horizontal · javascript · highcharts · anyplot.ai",
    style: { color: t.ink, fontSize: "22px", fontWeight: "600" },
  },
  xAxis: {
    categories,
    reversed: true, // index 0 (highest median) reads at the top, not the bottom
    lineColor: t.inkSoft,
    tickColor: t.inkSoft,
    labels: { style: { color: t.inkSoft, fontSize: "14px" } },
  },
  yAxis: {
    min: 0,
    maxPadding: 0.06, // keeps the last tick label from touching the canvas edge
    reversedStacks: false, // keep series[0] (invisible floor) at the base of the stack
    title: { text: "Annual Salary ($K)", style: { color: t.inkSoft, fontSize: "16px" } },
    labels: { style: { color: t.inkSoft, fontSize: "14px" }, format: "{value}K" },
    gridLineColor: t.grid,
    plotLines: [
      {
        value: overallMedian,
        color: t.inkSoft,
        width: 1.5,
        dashStyle: "Dash",
        zIndex: 5,
        label: {
          text: `Org-wide median: $${overallMedian.toFixed(0)}K`,
          rotation: 0,
          align: "left",
          verticalAlign: "top",
          x: 8,
          y: 4,
          style: { color: t.inkSoft, fontSize: "13px" },
        },
      },
    ],
  },
  legend: { enabled: false },
  tooltip: { outside: false },
  plotOptions: {
    bar: {
      stacking: "normal",
      pointPadding: 0.12,
      groupPadding: 0.18,
      borderRadius: 0,
      animation: false,
    },
    series: { animation: false },
  },
  series: [
    {
      name: "Floor",
      data: categories.map((name) => +statsByRole[name].q1.toFixed(1)),
      color: "transparent",
      borderWidth: 0,
      enableMouseTracking: false,
      showInLegend: false,
    },
    {
      name: "Interquartile range",
      data: categories.map((name) => +(statsByRole[name].q3 - statsByRole[name].q1).toFixed(1)),
      colorByPoint: true,
      borderColor: t.inkSoft,
      borderWidth: 1.25,
      borderRadius: 2,
      showInLegend: false,
      tooltip: {
        pointFormatter: function () {
          const s = statsByRole[categories[this.index]];
          return (
            `<b>${categories[this.index]}</b><br/>` +
            `Max: $${s.whiskerHigh.toFixed(0)}K<br/>Q3: $${s.q3.toFixed(0)}K<br/>` +
            `Median: $${s.median.toFixed(0)}K<br/>Q1: $${s.q1.toFixed(0)}K<br/>` +
            `Min: $${s.whiskerLow.toFixed(0)}K`
          );
        },
      },
    },
    {
      type: "line",
      name: "Whiskers",
      data: whiskerData,
      color: t.inkSoft,
      lineWidth: 1.5,
      linecap: "round",
      marker: { enabled: false },
      enableMouseTracking: false,
      showInLegend: false,
    },
    {
      type: "line",
      name: "Median",
      data: medianData,
      color: t.pageBg,
      lineWidth: 3,
      marker: { enabled: false },
      enableMouseTracking: false,
      showInLegend: false,
    },
    {
      type: "scatter",
      name: "Outliers",
      data: sortedRoles.flatMap((r, i) =>
        statsByRole[r.name].outliers.map((value) => ({
          x: i,
          y: +value.toFixed(1),
          color: t.palette[i % t.palette.length],
        }))
      ),
      marker: { radius: 6.5, symbol: "circle", lineWidth: 1, lineColor: t.pageBg, fillOpacity: 0.85 },
      showInLegend: false,
      tooltip: { pointFormat: "Outlier: <b>${point.y:.0f}K</b>" },
    },
  ],
});
Runnable source as JSON, for any HTTP client: https://api.anyplot.ai/specs/box-horizontal/highcharts/code. Any spec id and library id listed in llms-full.txt fit the same URL shape; every URL below is complete and callable.
{
  "spec_id": "box-horizontal",
  "language": "javascript",
  "library": "highcharts",
  "page": "https://anyplot.ai/box-horizontal/javascript/highcharts",
  "hub": "https://anyplot.ai/box-horizontal",
  "code_json": "https://api.anyplot.ai/specs/box-horizontal/highcharts/code",
  "spec_json": "https://api.anyplot.ai/specs/box-horizontal",
  "render_light_png": "https://storage.googleapis.com/anyplot-images/plots/box-horizontal/javascript/highcharts/plot-light.png",
  "render_dark_png": "https://storage.googleapis.com/anyplot-images/plots/box-horizontal/javascript/highcharts/plot-dark.png",
  "interactive_light_html": "https://storage.googleapis.com/anyplot-images/plots/box-horizontal/javascript/highcharts/plot-light.html",
  "interactive_dark_html": "https://storage.googleapis.com/anyplot-images/plots/box-horizontal/javascript/highcharts/plot-dark.html",
  "quality_score": 96.0,
  "license": "MIT",
  "guide": "https://anyplot.ai/llms.txt"
}
Part of Horizontal Box Plot on anyplot.ai.