The same plot in 14 other libraries — Python: Altair, Bokeh, lets-plot, Matplotlib, Plotly, plotnine, Pygal, Seaborn; Julia: Makie.jl; JavaScript: Chart.js, D3.js, Apache ECharts, Highcharts, MUI X Charts. Compare all 15 side by side: Horizontal Box Plot in Python, R, Julia and JavaScript.
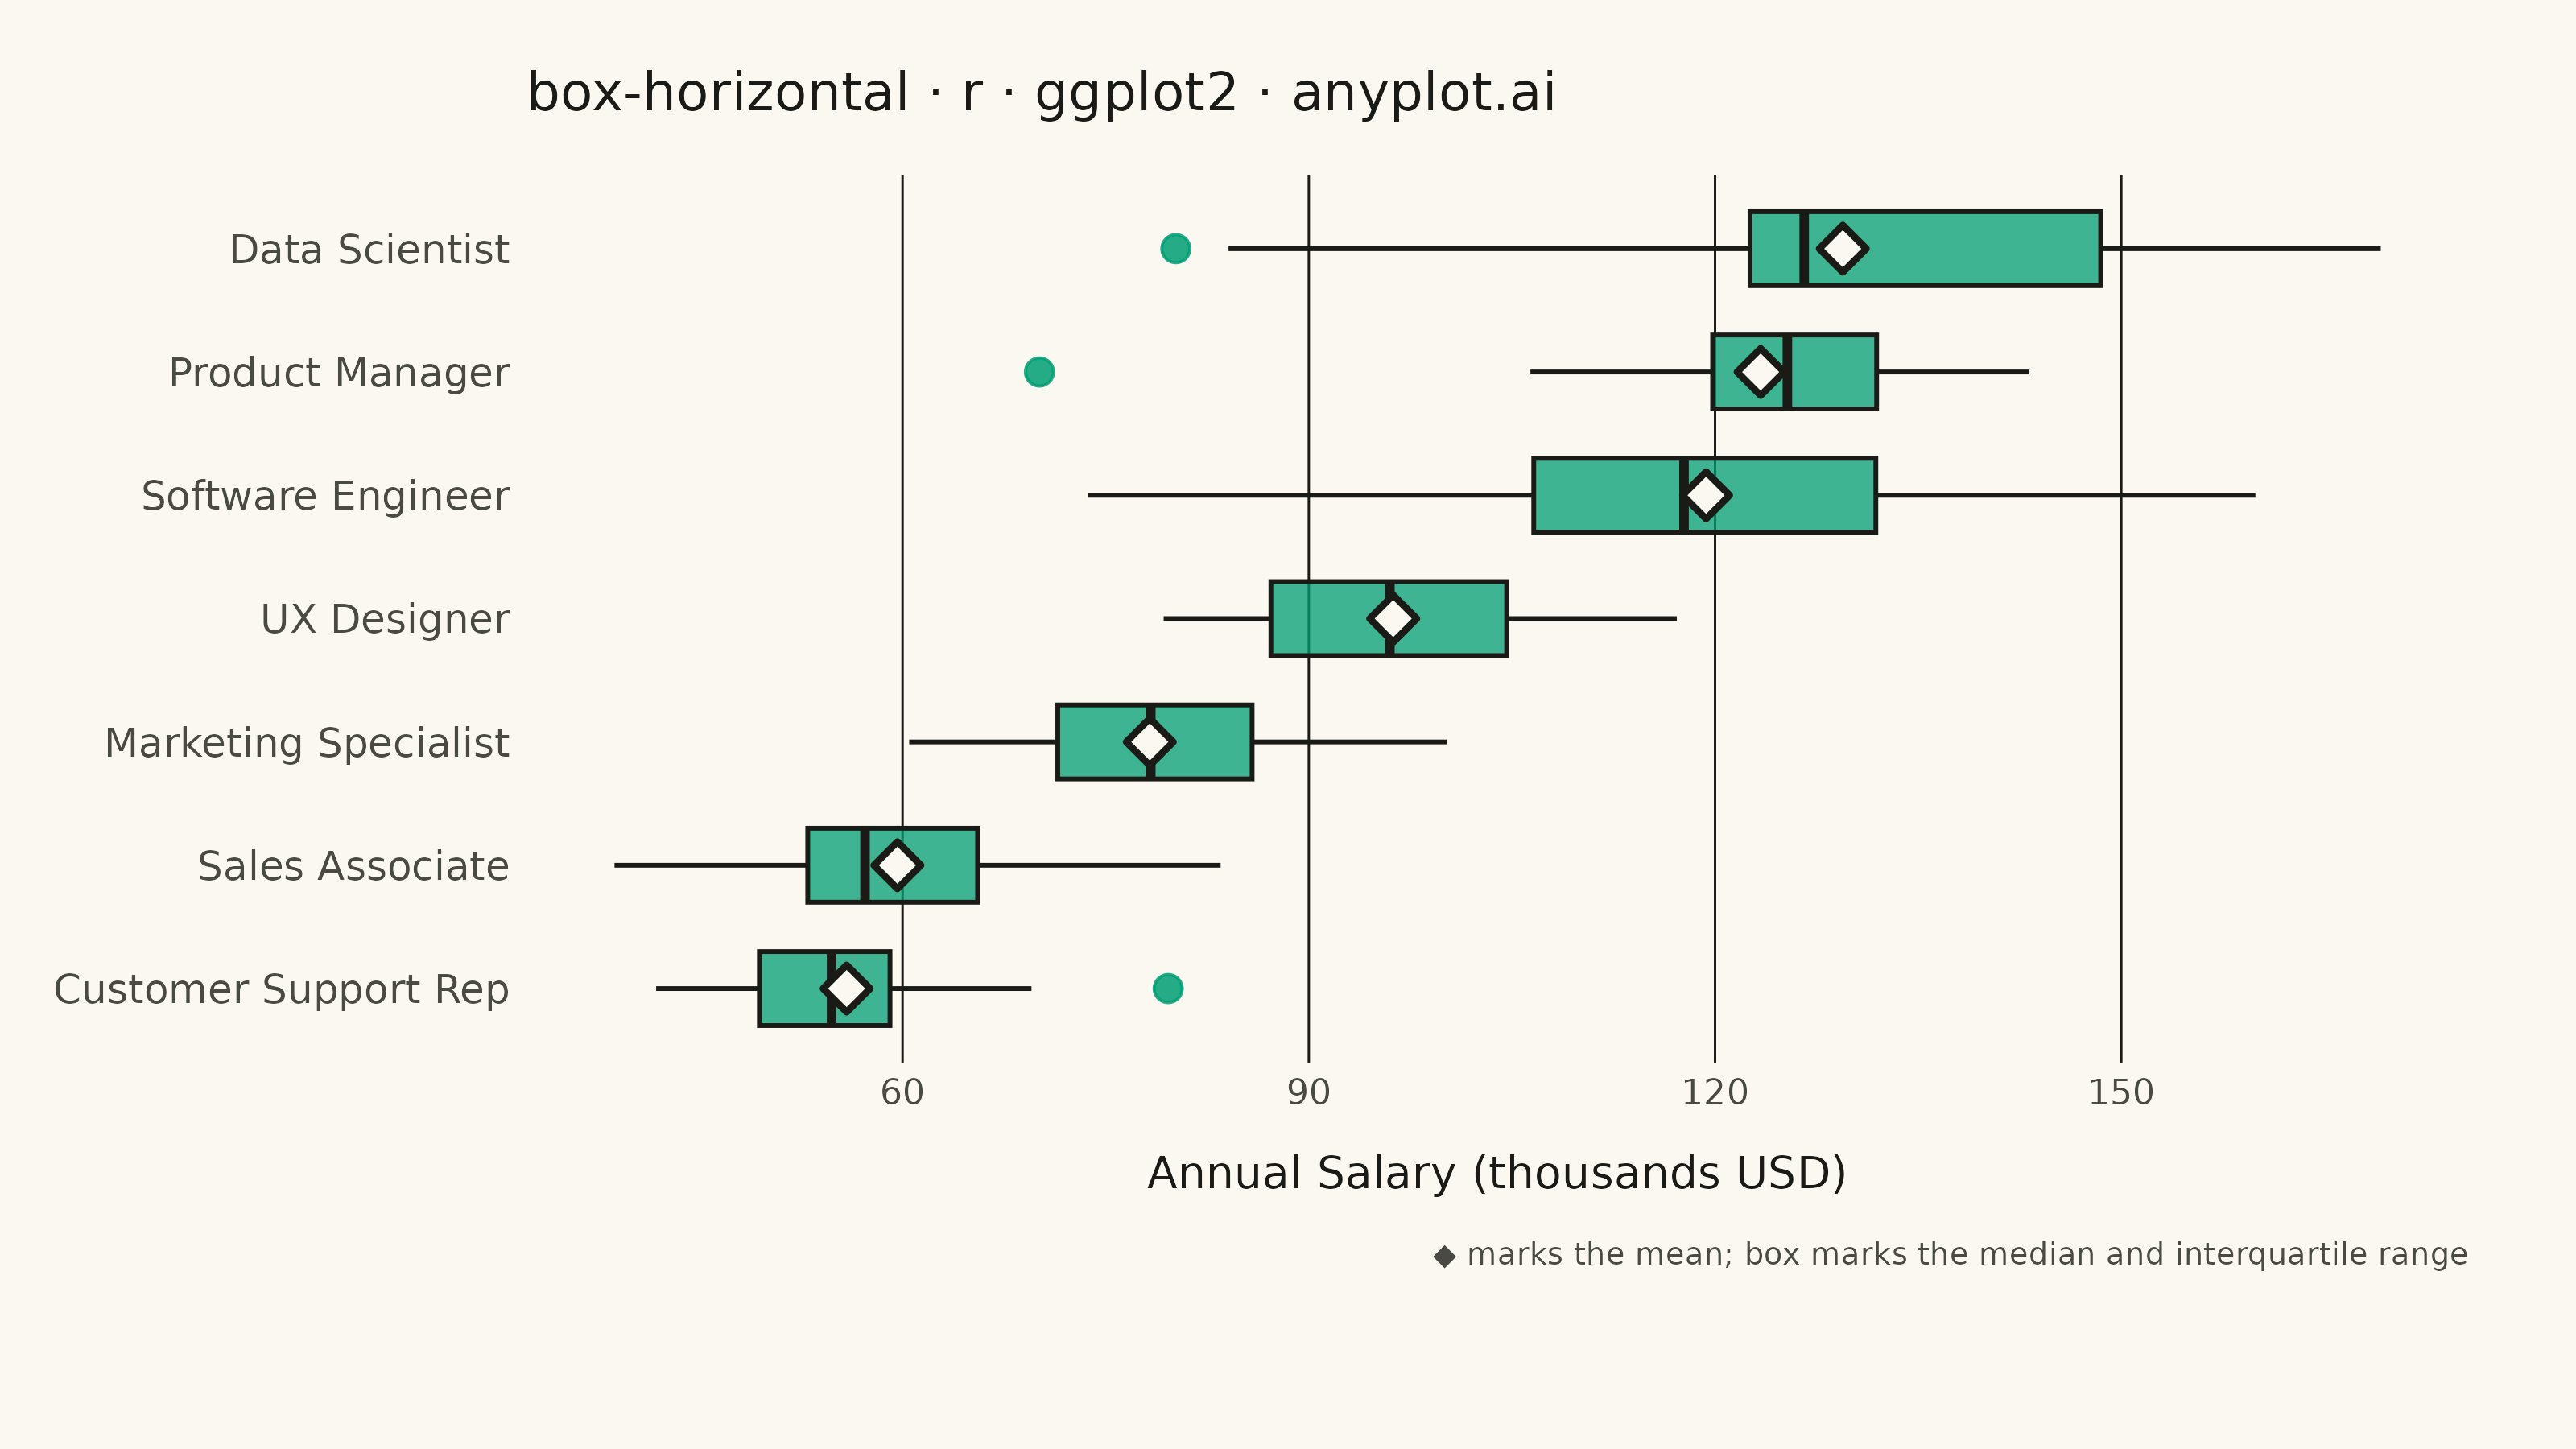
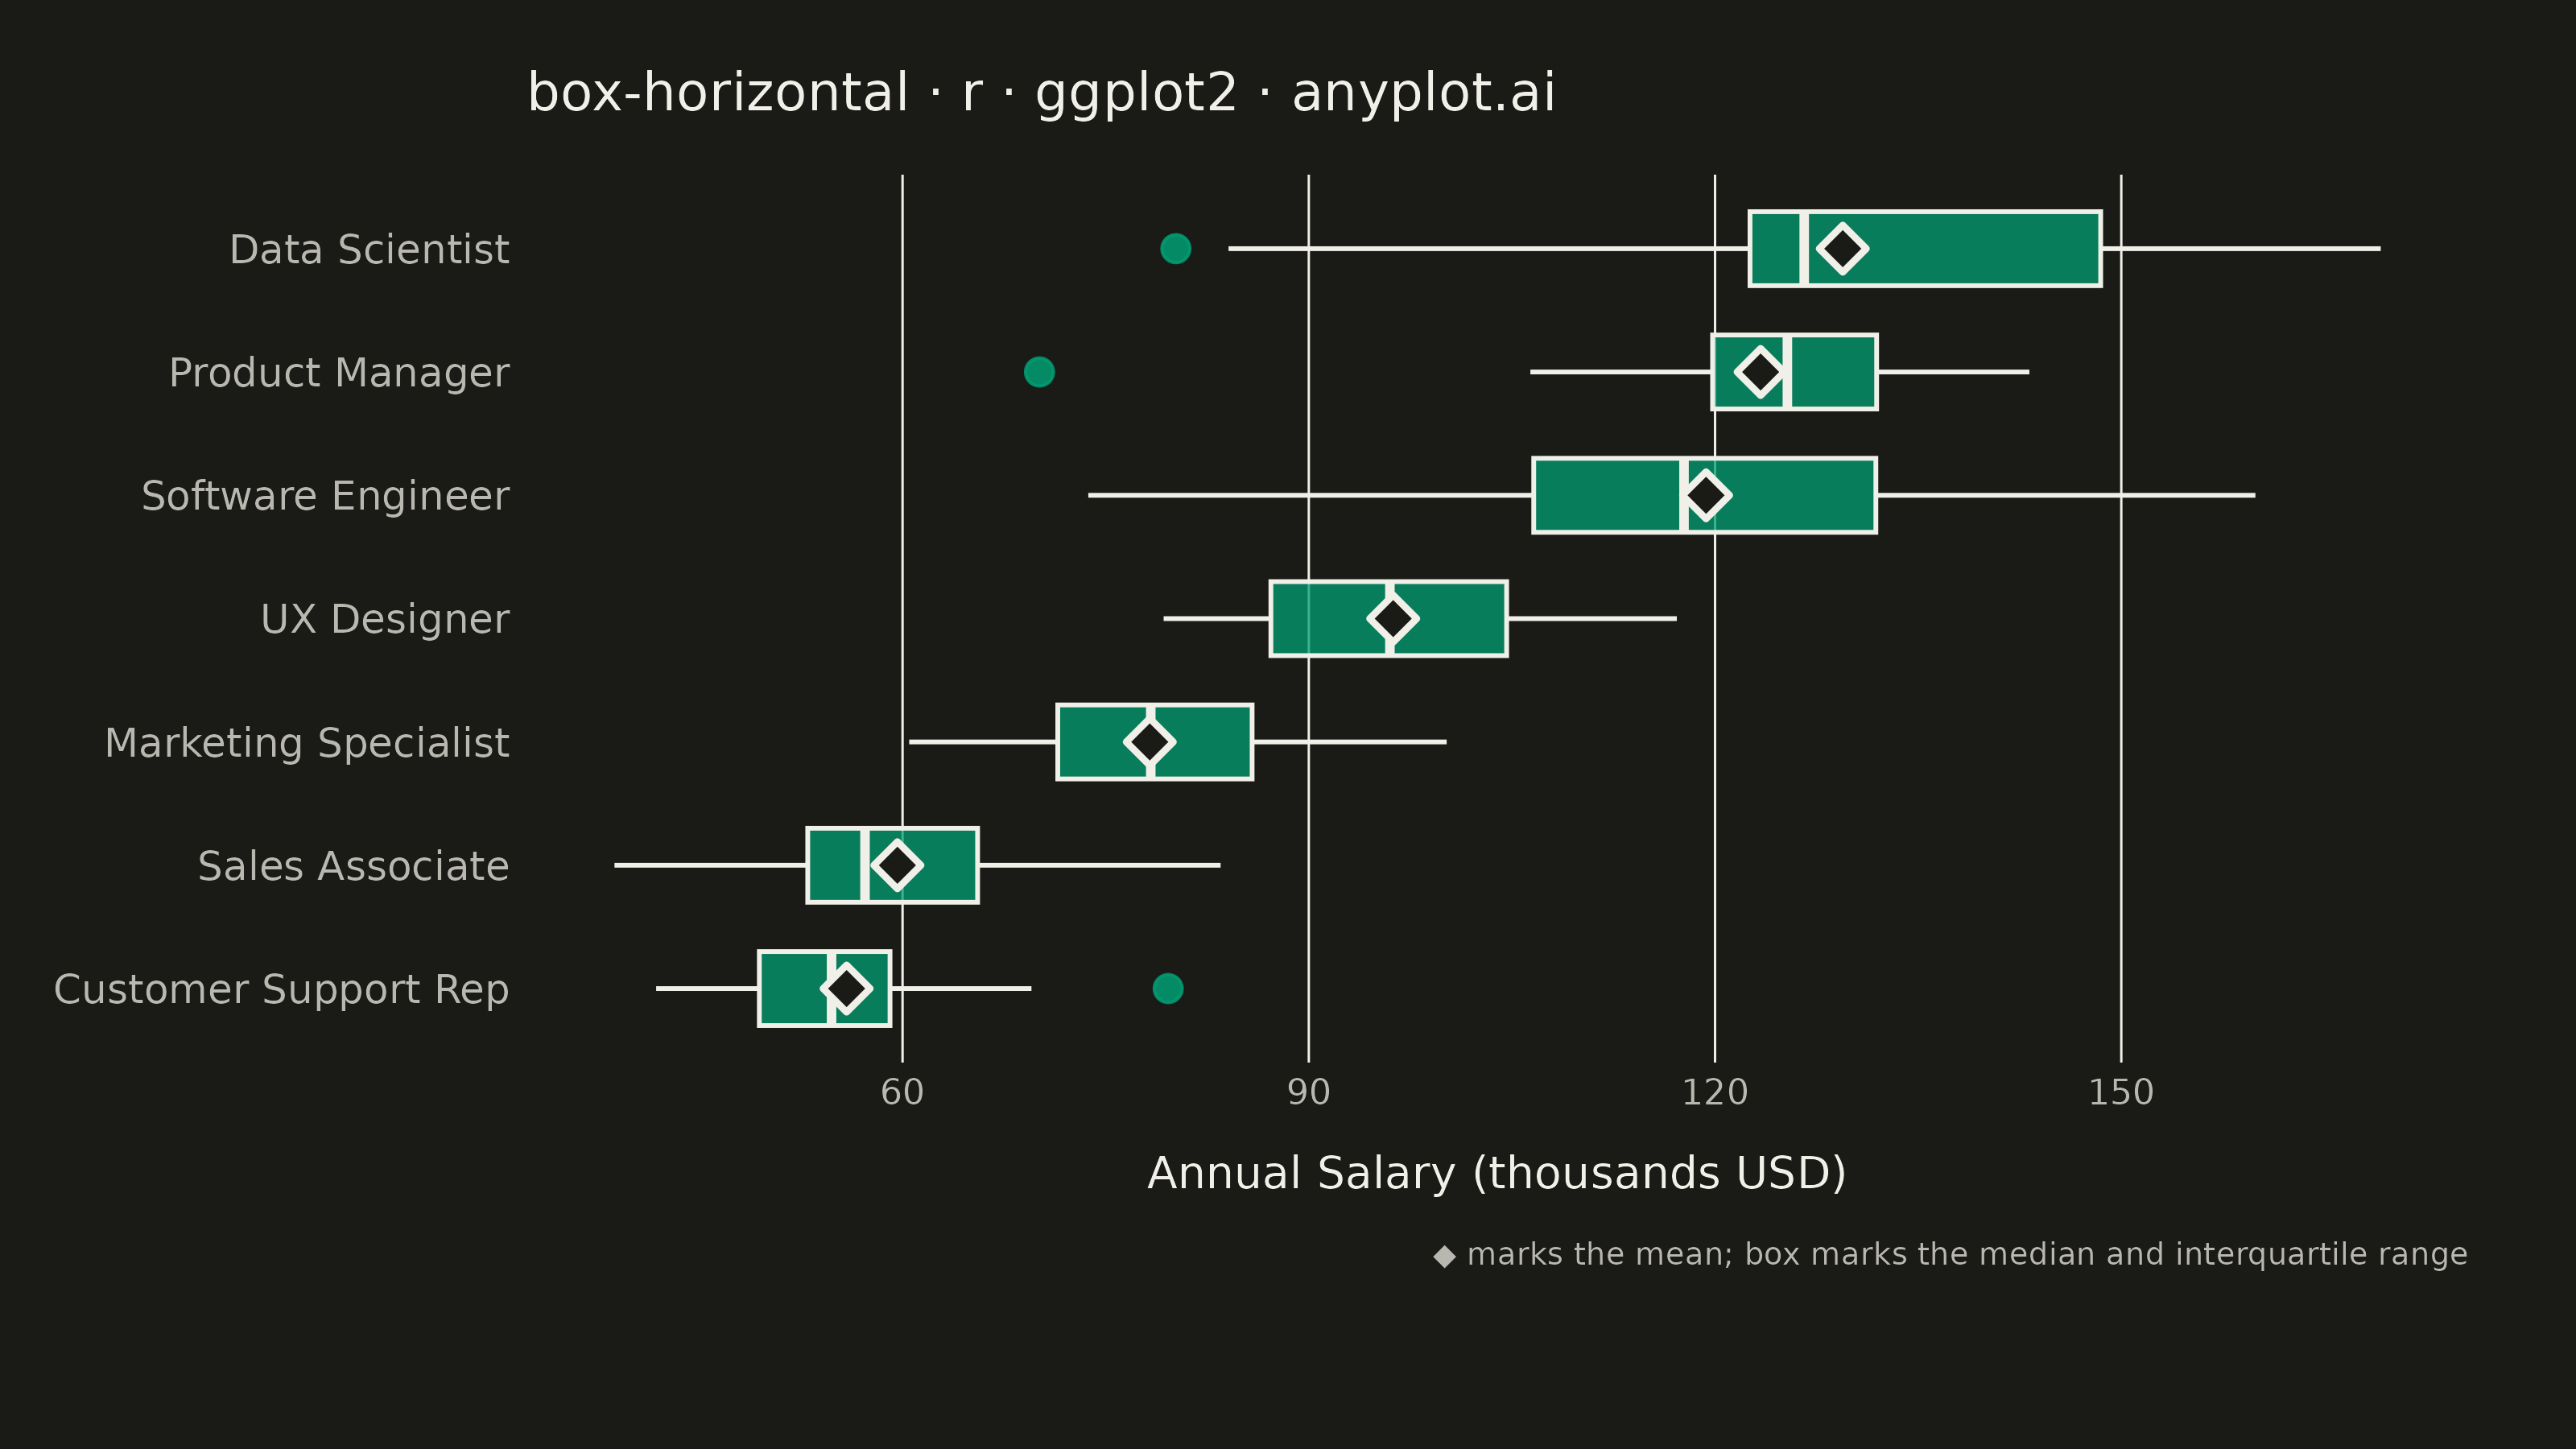
A horizontal box plot displays the distribution of numerical data through quartiles with the boxes oriented horizontally. This orientation is particularly useful when category labels are long or when comparing many groups, as it allows for easier reading of labels on the y-axis.
#' anyplot.ai
#' box-horizontal: Horizontal Box Plot
#' Library: ggplot2 3.5.1 | R 4.4.1
#' Quality: 89/100 | Created: 2026-09-02

library(ggplot2)
library(dplyr)
library(ragg)

set.seed(42)

# --- Theme tokens -------------------------------------------------------
THEME       <- Sys.getenv("ANYPLOT_THEME", "light")
PAGE_BG     <- if (THEME == "light") "#FAF8F1" else "#1A1A17"
INK         <- if (THEME == "light") "#1A1A17" else "#F0EFE8"
INK_SOFT    <- if (THEME == "light") "#4A4A44" else "#B8B7B0"
IMPRINT_PALETTE <- c("#009E73", "#C475FD", "#4467A3", "#BD8233",
                     "#AE3030", "#2ABCCD", "#954477", "#99B314")
BRAND <- IMPRINT_PALETTE[1]

# --- Data: annual salary (in thousands USD) by job title ----------------
job_titles <- c(
  "Data Scientist", "Software Engineer", "Product Manager",
  "UX Designer", "Marketing Specialist", "Customer Support Rep",
  "Sales Associate"
)
job_params <- tibble::tibble(
  job_title = job_titles,
  mean_salary = c(128, 122, 118, 96, 78, 58, 62),
  sd_salary   = c(18, 20, 16, 14, 12, 8, 15),
  n           = c(22, 30, 18, 20, 24, 26, 28)
)

df <- job_params %>%
  rowwise() %>%
  reframe(
    job_title = job_title,
    salary_k  = pmax(rnorm(n, mean_salary, sd_salary), 30)
  )

# Sort categories by median salary for easier comparison
ordered_titles <- df %>%
  group_by(job_title) %>%
  summarise(median_salary = median(salary_k)) %>%
  arrange(median_salary) %>%
  pull(job_title)
df$job_title <- factor(df$job_title, levels = ordered_titles)

# --- Plot -----------------------------------------------------------------
title_text <- "box-horizontal · r · ggplot2 · anyplot.ai"

p <- ggplot(df, aes(x = salary_k, y = job_title)) +
  geom_boxplot(
    fill = BRAND, color = INK, alpha = 0.75,
    outlier.color = BRAND, outlier.alpha = 0.85, outlier.size = 2.6,
    linewidth = 0.5, width = 0.6
  ) +
  stat_summary(
    fun = mean, geom = "point", orientation = "y",
    shape = 23, size = 3.2, stroke = 1.1,
    fill = PAGE_BG, color = INK
  ) +
  labs(
    title = title_text,
    x = "Annual Salary (thousands USD)",
    y = NULL,
    caption = "◆ marks the mean; box marks the median and interquartile range"
  ) +
  theme_minimal(base_size = 8) +
  theme(
    plot.background   = element_rect(fill = PAGE_BG, color = PAGE_BG),
    panel.background  = element_rect(fill = PAGE_BG, color = NA),
    panel.grid.major.y = element_blank(),
    panel.grid.minor.y = element_blank(),
    panel.grid.major.x = element_line(color = INK, linewidth = 0.25),
    panel.grid.minor.x = element_blank(),
    axis.title.x      = element_text(color = INK, size = 10, margin = margin(t = 10)),
    axis.text.x       = element_text(color = INK_SOFT, size = 8),
    axis.text.y       = element_text(color = INK_SOFT, size = 9),
    axis.ticks        = element_blank(),
    plot.title        = element_text(color = INK, size = 12, margin = margin(b = 12)),
    plot.caption      = element_text(color = INK_SOFT, size = 7, margin = margin(t = 10)),
    plot.margin       = margin(t = 16, r = 24, b = 40, l = 12)
  )

# --- Save -------------------------------------------------------------------
ggsave(
  filename = sprintf("plot-%s.png", THEME),
  plot     = p,
  device   = ragg::agg_png,
  width    = 8,
  height   = 4.5,
  units    = "in",
  dpi      = 400
)
Runnable source as JSON, for any HTTP client: https://api.anyplot.ai/specs/box-horizontal/ggplot2/code. Any spec id and library id listed in llms-full.txt fit the same URL shape; every URL below is complete and callable.
{
  "spec_id": "box-horizontal",
  "language": "r",
  "library": "ggplot2",
  "page": "https://anyplot.ai/box-horizontal/r/ggplot2",
  "hub": "https://anyplot.ai/box-horizontal",
  "code_json": "https://api.anyplot.ai/specs/box-horizontal/ggplot2/code",
  "spec_json": "https://api.anyplot.ai/specs/box-horizontal",
  "render_light_png": "https://storage.googleapis.com/anyplot-images/plots/box-horizontal/r/ggplot2/plot-light.png",
  "render_dark_png": "https://storage.googleapis.com/anyplot-images/plots/box-horizontal/r/ggplot2/plot-dark.png",
  "quality_score": 89.0,
  "license": "MIT",
  "guide": "https://anyplot.ai/llms.txt"
}
Part of Horizontal Box Plot on anyplot.ai.