The same plot in 14 other libraries — JavaScript: Chart.js, Apache ECharts, Highcharts, MUI X Charts; Python: Altair, Bokeh, lets-plot, Matplotlib, Plotly, plotnine, Pygal, Seaborn; R: ggplot2; Julia: Makie.jl. Compare all 15 side by side: Horizontal Box Plot in Python, R, Julia and JavaScript.
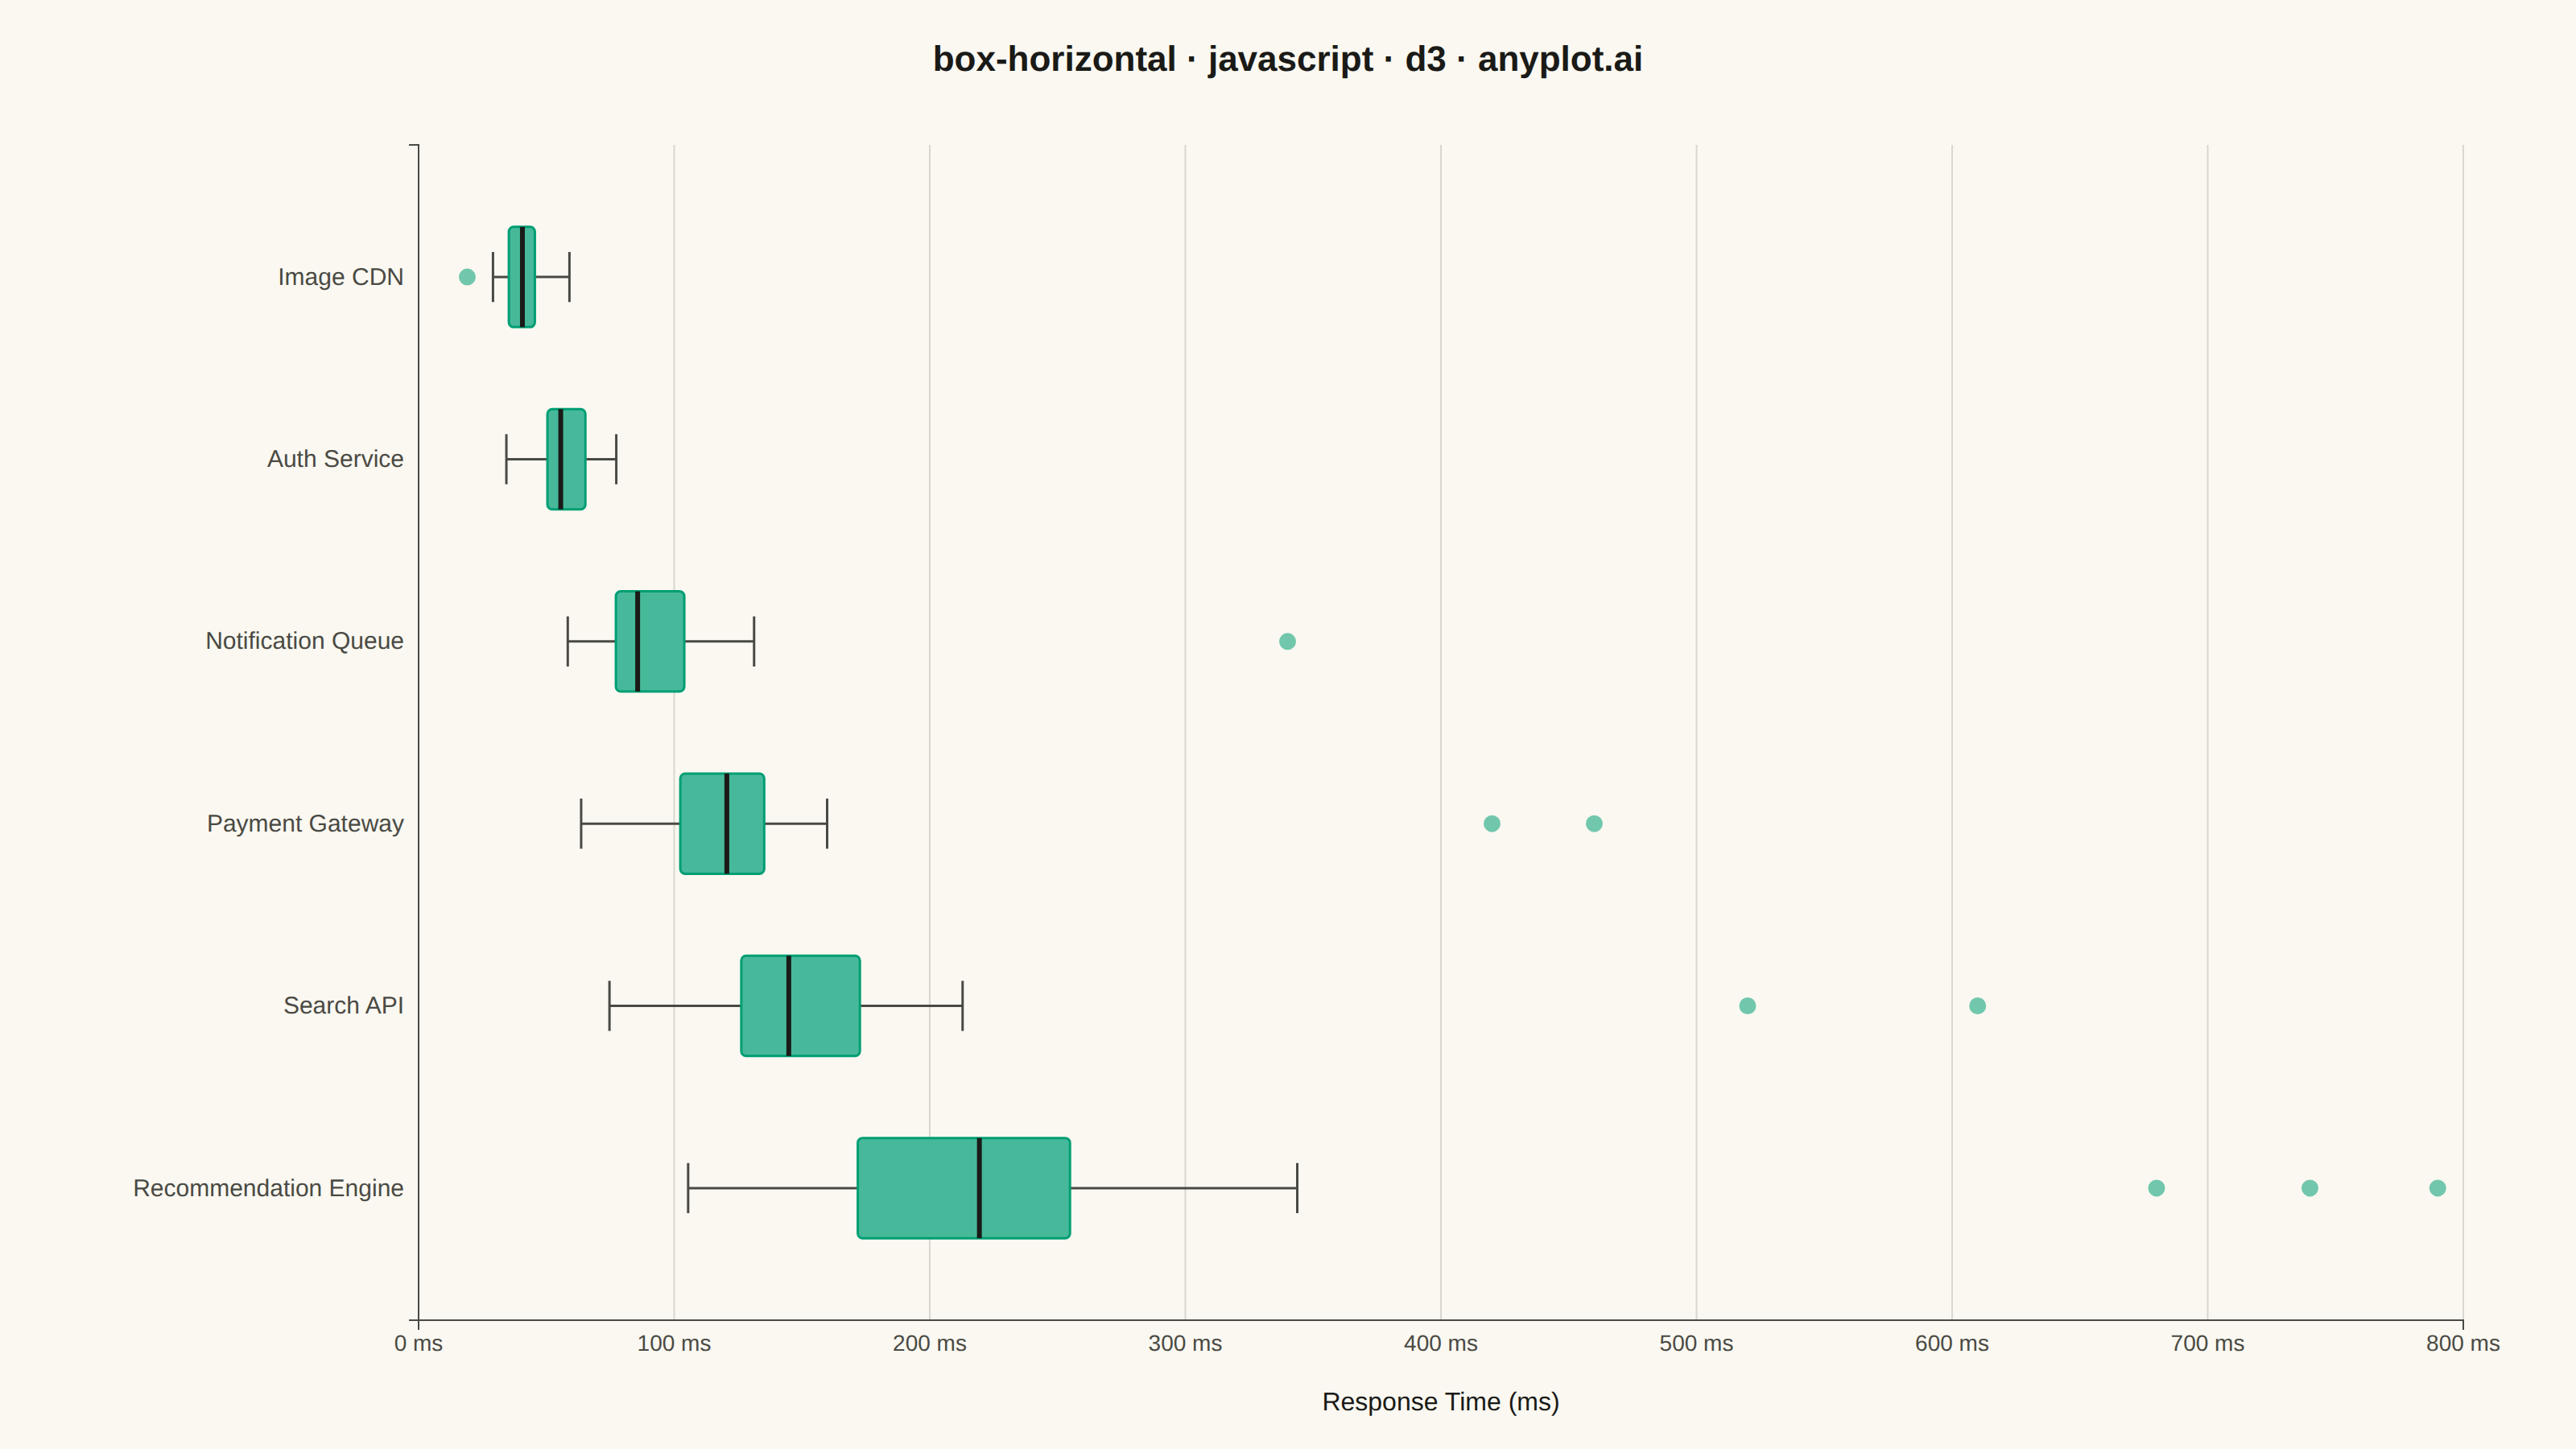
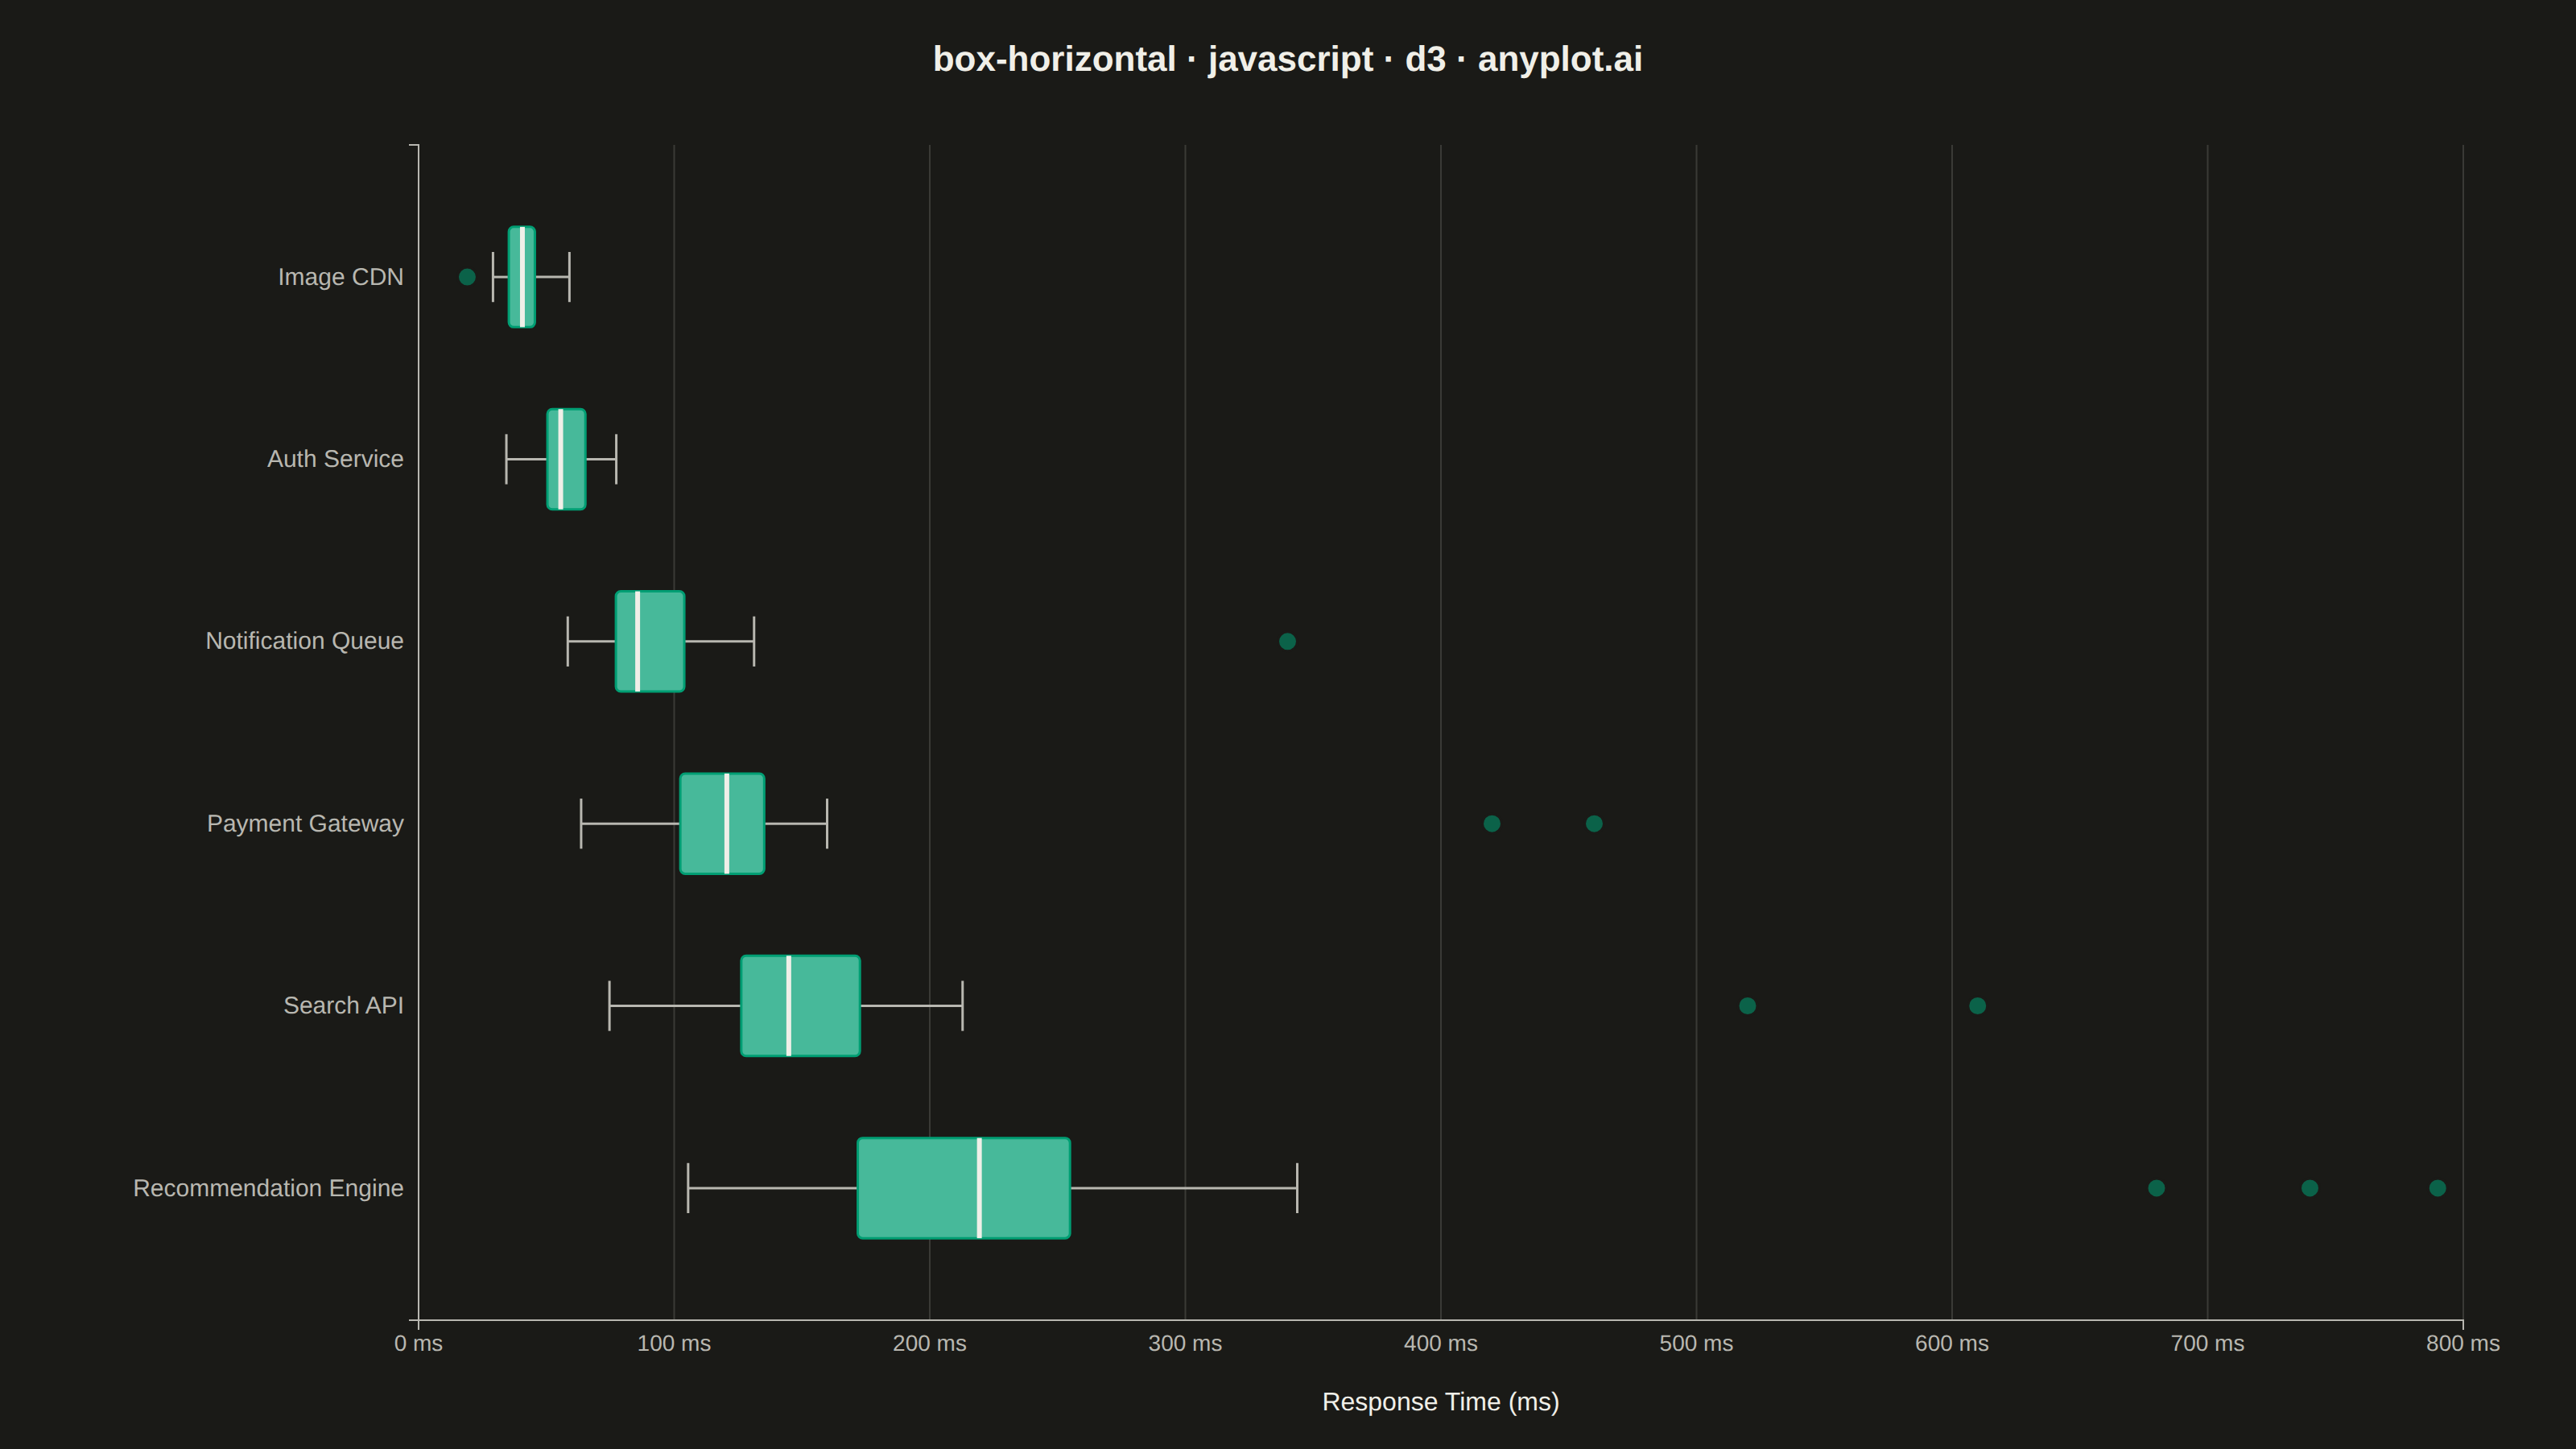
A horizontal box plot displays the distribution of numerical data through quartiles with the boxes oriented horizontally. This orientation is particularly useful when category labels are long or when comparing many groups, as it allows for easier reading of labels on the y-axis.
// anyplot.ai
// box-horizontal: Horizontal Box Plot
// Library: d3 7.9.0 | JavaScript 22.23.2
// Quality: 89/100 | Created: 2026-09-02

const t = window.ANYPLOT_TOKENS;
const { width, height } = window.ANYPLOT_SIZE;
const margin = { top: 90, right: 70, bottom: 80, left: 260 };
const iw = width - margin.left - margin.right;
const ih = height - margin.top - margin.bottom;

// --- Deterministic PRNG (mulberry32) + Box-Muller normal sampler ------------
function mulberry32(seed) {
  return () => {
    seed |= 0;
    seed = (seed + 0x6d2b79f5) | 0;
    let x = Math.imul(seed ^ (seed >>> 15), 1 | seed);
    x = (x + Math.imul(x ^ (x >>> 7), 61 | x)) ^ x;
    return ((x ^ (x >>> 14)) >>> 0) / 4294967296;
  };
}
const rng = mulberry32(42);
function normal(mean, sd) {
  const u1 = Math.max(rng(), 1e-9);
  const u2 = rng();
  const z = Math.sqrt(-2 * Math.log(u1)) * Math.cos(2 * Math.PI * u2);
  return mean + z * sd;
}

// --- Data: API response time distributions by service (ms) -----------------
const services = [
  { name: "Image CDN", mean: 42, sd: 7, n: 45, outliers: [] },
  { name: "Auth Service", mean: 58, sd: 11, n: 50, outliers: [] },
  { name: "Notification Queue", mean: 88, sd: 18, n: 40, outliers: [340] },
  { name: "Payment Gateway", mean: 112, sd: 22, n: 45, outliers: [420, 460] },
  { name: "Search API", mean: 145, sd: 34, n: 55, outliers: [520, 610] },
  { name: "Recommendation Engine", mean: 218, sd: 48, n: 40, outliers: [680, 740, 790] },
];

const groups = services.map((s) => {
  const samples = Array.from({ length: s.n }, () => Math.max(4, normal(s.mean, s.sd)));
  const values = samples.concat(s.outliers).sort((a, b) => a - b);
  const q1 = d3.quantile(values, 0.25);
  const median = d3.quantile(values, 0.5);
  const q3 = d3.quantile(values, 0.75);
  const iqr = q3 - q1;
  const lowFence = q1 - 1.5 * iqr;
  const highFence = q3 + 1.5 * iqr;
  const inRange = values.filter((v) => v >= lowFence && v <= highFence);
  const whiskerLow = d3.min(inRange);
  const whiskerHigh = d3.max(inRange);
  const outliers = values.filter((v) => v < lowFence || v > highFence);
  return { name: s.name, q1, median, q3, whiskerLow, whiskerHigh, outliers };
});

// Sort by median ascending so the fastest services read at the top.
groups.sort((a, b) => a.median - b.median);

const xMax = d3.max(groups, (g) => Math.max(g.whiskerHigh, d3.max(g.outliers) ?? 0));

// --- SVG mount ---------------------------------------------------------------
const svg = d3.select("#container").append("svg").attr("width", width).attr("height", height);
const g = svg.append("g").attr("transform", `translate(${margin.left},${margin.top})`);

// --- Scales -------------------------------------------------------------------
const x = d3.scaleLinear().domain([0, xMax]).nice().range([0, iw]);
const y = d3
  .scaleBand()
  .domain(groups.map((d) => d.name))
  .range([0, ih])
  .padding(0.45);

// --- Gridlines (x-axis, subtle) ----------------------------------------------
g.append("g")
  .attr("class", "grid")
  .call(d3.axisBottom(x).ticks(6).tickSize(ih).tickFormat(""))
  .attr("transform", `translate(0,0)`)
  .call((sel) => sel.select(".domain").remove())
  .call((sel) => sel.selectAll("line").attr("stroke", t.grid));

// --- Boxes, whiskers, outliers -------------------------------------------------
const boxHeight = y.bandwidth();
const boxGroups = g
  .selectAll(".box-group")
  .data(groups)
  .join("g")
  .attr("class", "box-group")
  .attr("transform", (d) => `translate(0,${y(d.name)})`);

// whisker lines
boxGroups
  .append("line")
  .attr("x1", (d) => x(d.whiskerLow))
  .attr("x2", (d) => x(d.q1))
  .attr("y1", boxHeight / 2)
  .attr("y2", boxHeight / 2)
  .attr("stroke", t.inkSoft)
  .attr("stroke-width", 1.5);

boxGroups
  .append("line")
  .attr("x1", (d) => x(d.q3))
  .attr("x2", (d) => x(d.whiskerHigh))
  .attr("y1", boxHeight / 2)
  .attr("y2", boxHeight / 2)
  .attr("stroke", t.inkSoft)
  .attr("stroke-width", 1.5);

// whisker caps
for (const key of ["whiskerLow", "whiskerHigh"]) {
  boxGroups
    .append("line")
    .attr("x1", (d) => x(d[key]))
    .attr("x2", (d) => x(d[key]))
    .attr("y1", boxHeight * 0.25)
    .attr("y2", boxHeight * 0.75)
    .attr("stroke", t.inkSoft)
    .attr("stroke-width", 1.5);
}

// Pre-mixed opaque tint (fixed 28% white mix) so the composited box color no
// longer depends on the page background behind it — only chrome stays theme-adaptive.
const boxFill = d3.interpolateRgb(t.palette[0], "#ffffff")(0.28);

// box body
boxGroups
  .append("rect")
  .attr("x", (d) => x(d.q1))
  .attr("y", 0)
  .attr("width", (d) => x(d.q3) - x(d.q1))
  .attr("height", boxHeight)
  .attr("rx", 3)
  .attr("fill", boxFill)
  .attr("stroke", t.palette[0])
  .attr("stroke-width", 1.5);

// median line
boxGroups
  .append("line")
  .attr("x1", (d) => x(d.median))
  .attr("x2", (d) => x(d.median))
  .attr("y1", 0)
  .attr("y2", boxHeight)
  .attr("stroke", t.ink)
  .attr("stroke-width", 3);

// outliers
boxGroups
  .selectAll(".outlier")
  .data((d) => d.outliers.map((v) => ({ value: v })))
  .join("circle")
  .attr("class", "outlier")
  .attr("cx", (d) => x(d.value))
  .attr("cy", boxHeight / 2)
  .attr("r", 6)
  .attr("fill", t.palette[0])
  .attr("fill-opacity", 0.55)
  .attr("stroke", t.pageBg)
  .attr("stroke-width", 1.5);

// --- Axes ----------------------------------------------------------------------
const xAxis = g.append("g").attr("transform", `translate(0,${ih})`).call(
  d3
    .axisBottom(x)
    .ticks(6)
    .tickFormat((v) => `${v} ms`),
);
xAxis.selectAll("text").attr("fill", t.inkSoft).style("font-size", "14px");
xAxis.selectAll("line").remove();
xAxis.select(".domain").attr("stroke", t.inkSoft);

const yAxis = g.append("g").call(d3.axisLeft(y));
yAxis.selectAll("text").attr("fill", t.inkSoft).style("font-size", "15px");
yAxis.selectAll("line").remove();
yAxis.select(".domain").attr("stroke", t.inkSoft);

// x-axis label
svg
  .append("text")
  .attr("x", margin.left + iw / 2)
  .attr("y", height - 24)
  .attr("text-anchor", "middle")
  .attr("fill", t.ink)
  .style("font-size", "16px")
  .text("Response Time (ms)");

// --- Title -----------------------------------------------------------------
svg
  .append("text")
  .attr("x", width / 2)
  .attr("y", 44)
  .attr("text-anchor", "middle")
  .attr("fill", t.ink)
  .style("font-size", "22px")
  .style("font-weight", "600")
  .text("box-horizontal · javascript · d3 · anyplot.ai");
Runnable source as JSON, for any HTTP client: https://api.anyplot.ai/specs/box-horizontal/d3/code. Any spec id and library id listed in llms-full.txt fit the same URL shape; every URL below is complete and callable.
{
  "spec_id": "box-horizontal",
  "language": "javascript",
  "library": "d3",
  "page": "https://anyplot.ai/box-horizontal/javascript/d3",
  "hub": "https://anyplot.ai/box-horizontal",
  "code_json": "https://api.anyplot.ai/specs/box-horizontal/d3/code",
  "spec_json": "https://api.anyplot.ai/specs/box-horizontal",
  "render_light_png": "https://storage.googleapis.com/anyplot-images/plots/box-horizontal/javascript/d3/plot-light.png",
  "render_dark_png": "https://storage.googleapis.com/anyplot-images/plots/box-horizontal/javascript/d3/plot-dark.png",
  "interactive_light_html": "https://storage.googleapis.com/anyplot-images/plots/box-horizontal/javascript/d3/plot-light.html",
  "interactive_dark_html": "https://storage.googleapis.com/anyplot-images/plots/box-horizontal/javascript/d3/plot-dark.html",
  "quality_score": 89.0,
  "license": "MIT",
  "guide": "https://anyplot.ai/llms.txt"
}
Part of Horizontal Box Plot on anyplot.ai.