The same plot in 14 other libraries — JavaScript: D3.js, Apache ECharts, Highcharts, MUI X Charts; Python: Altair, Bokeh, lets-plot, Matplotlib, Plotly, plotnine, Pygal, Seaborn; R: ggplot2; Julia: Makie.jl. Compare all 15 side by side: Bias-Variance Tradeoff Curve in Python, R, Julia and JavaScript.
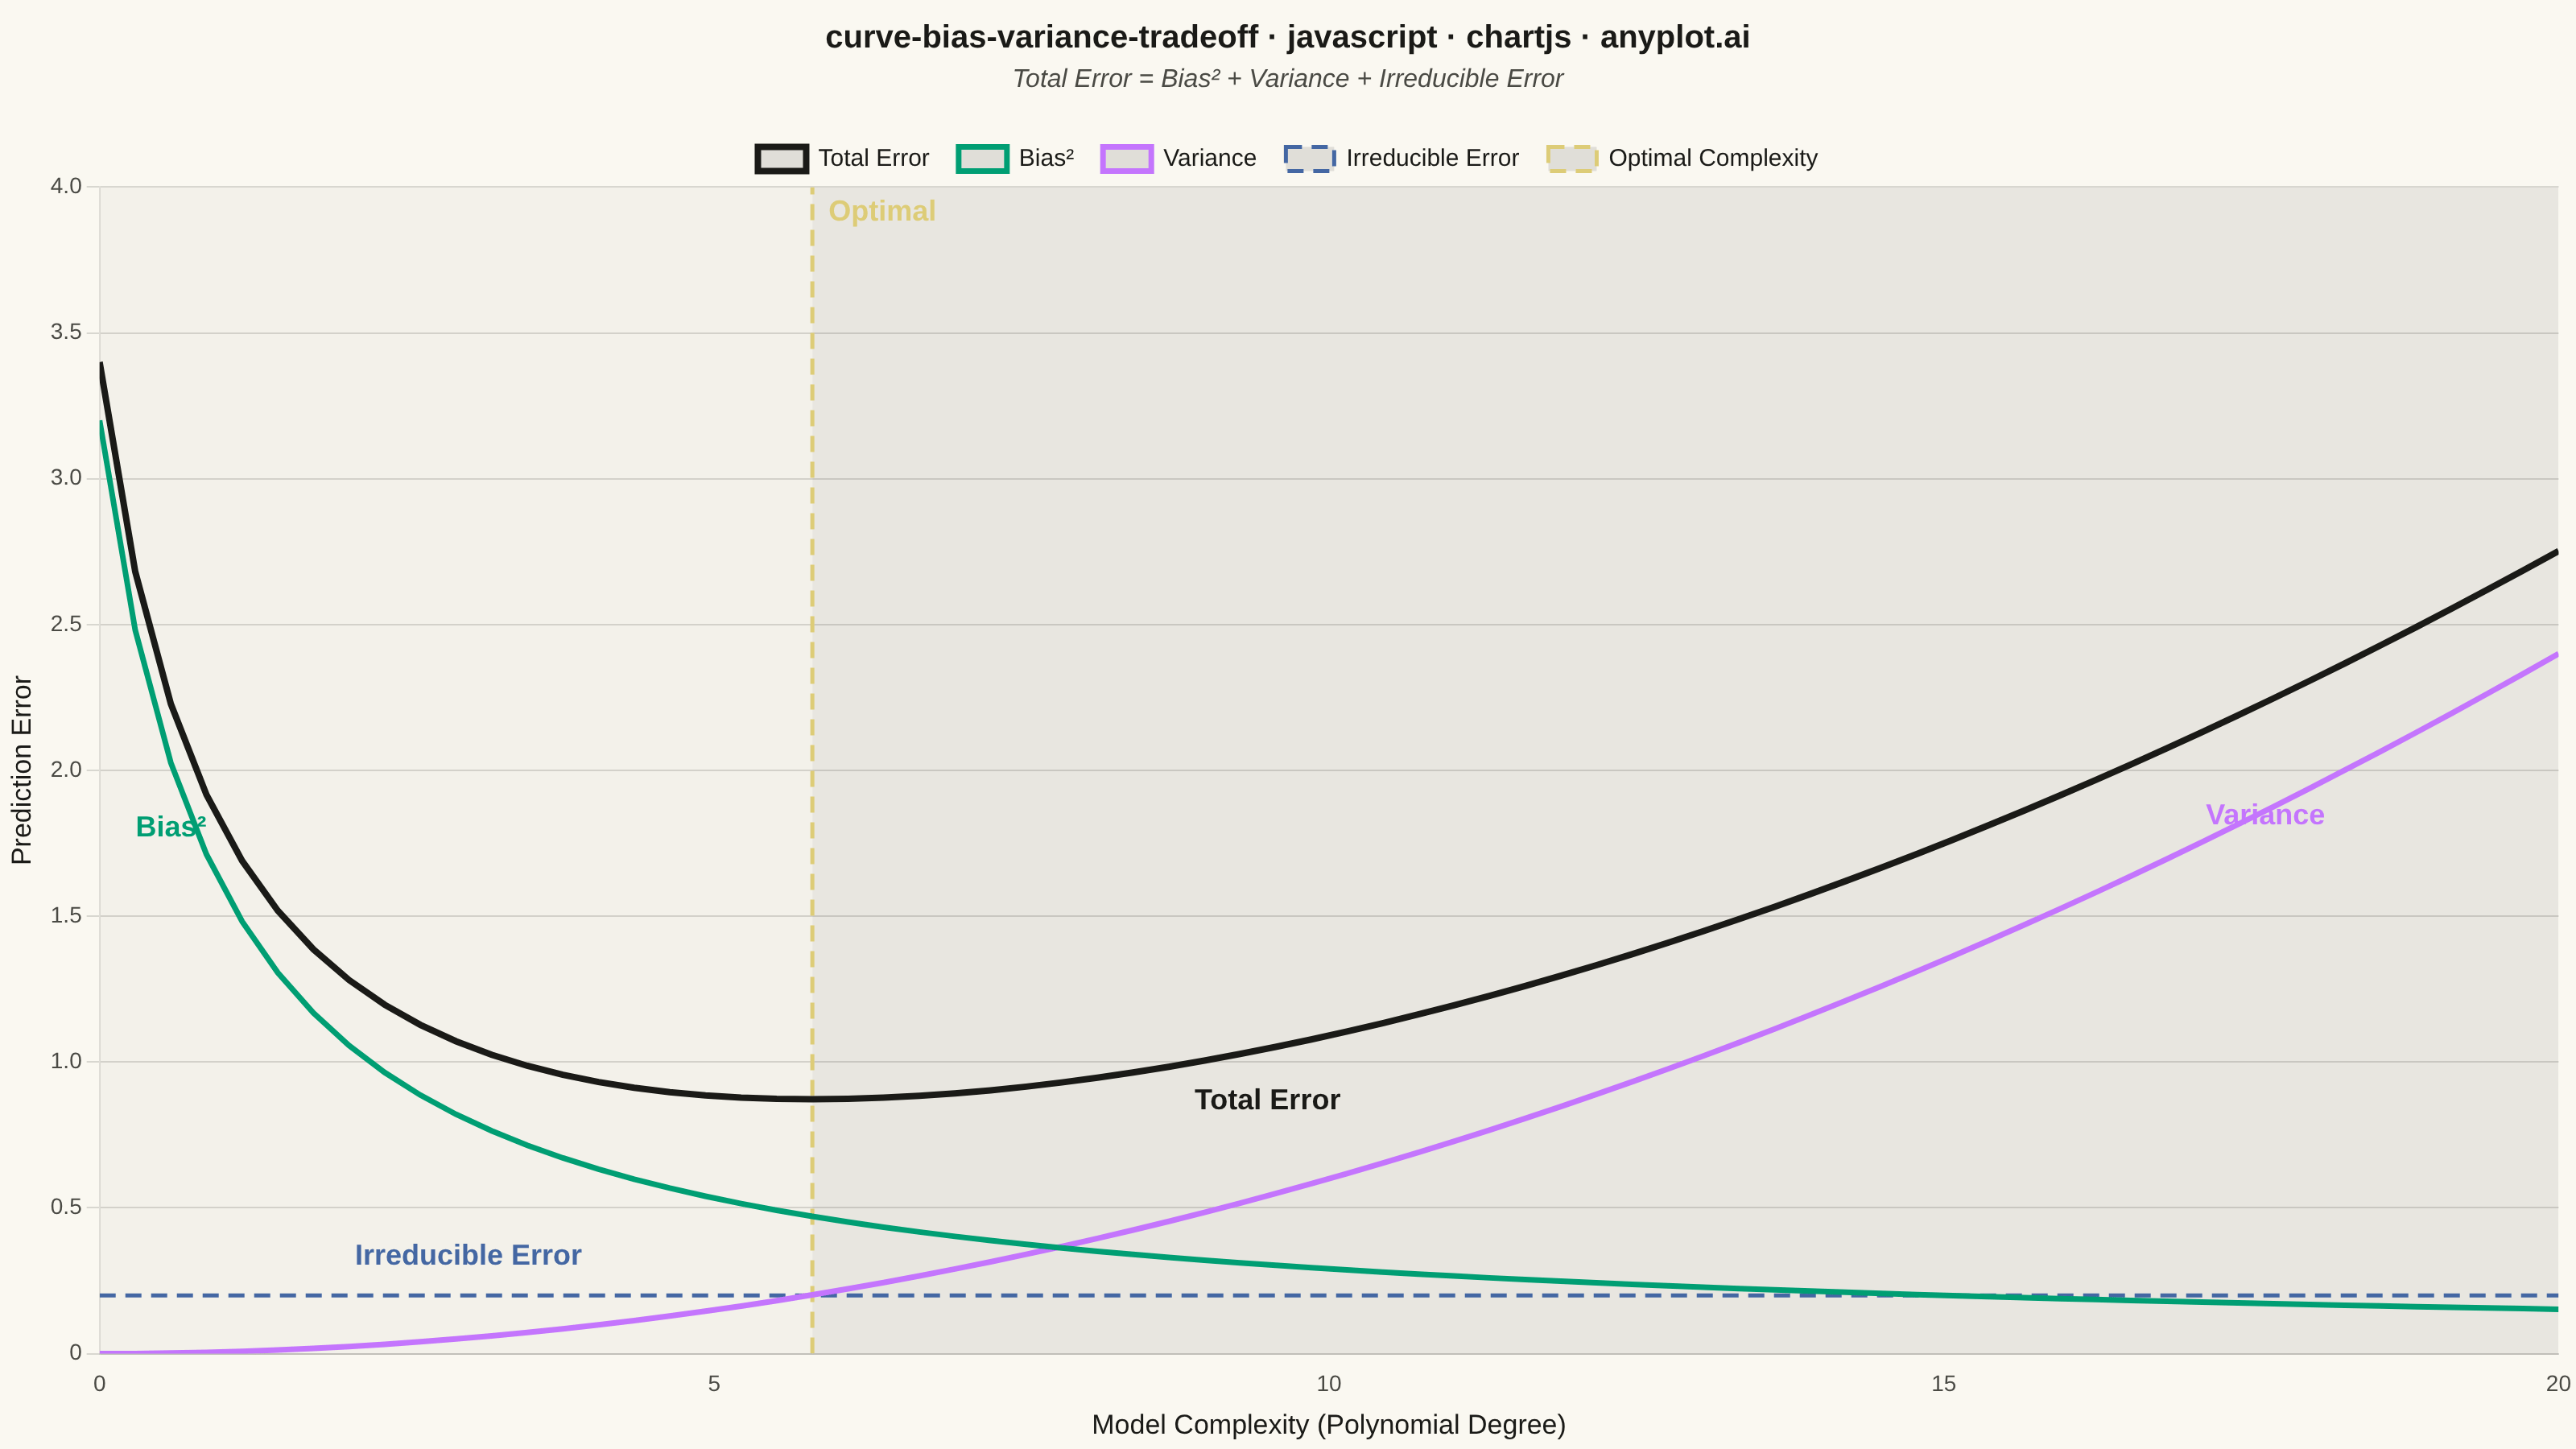
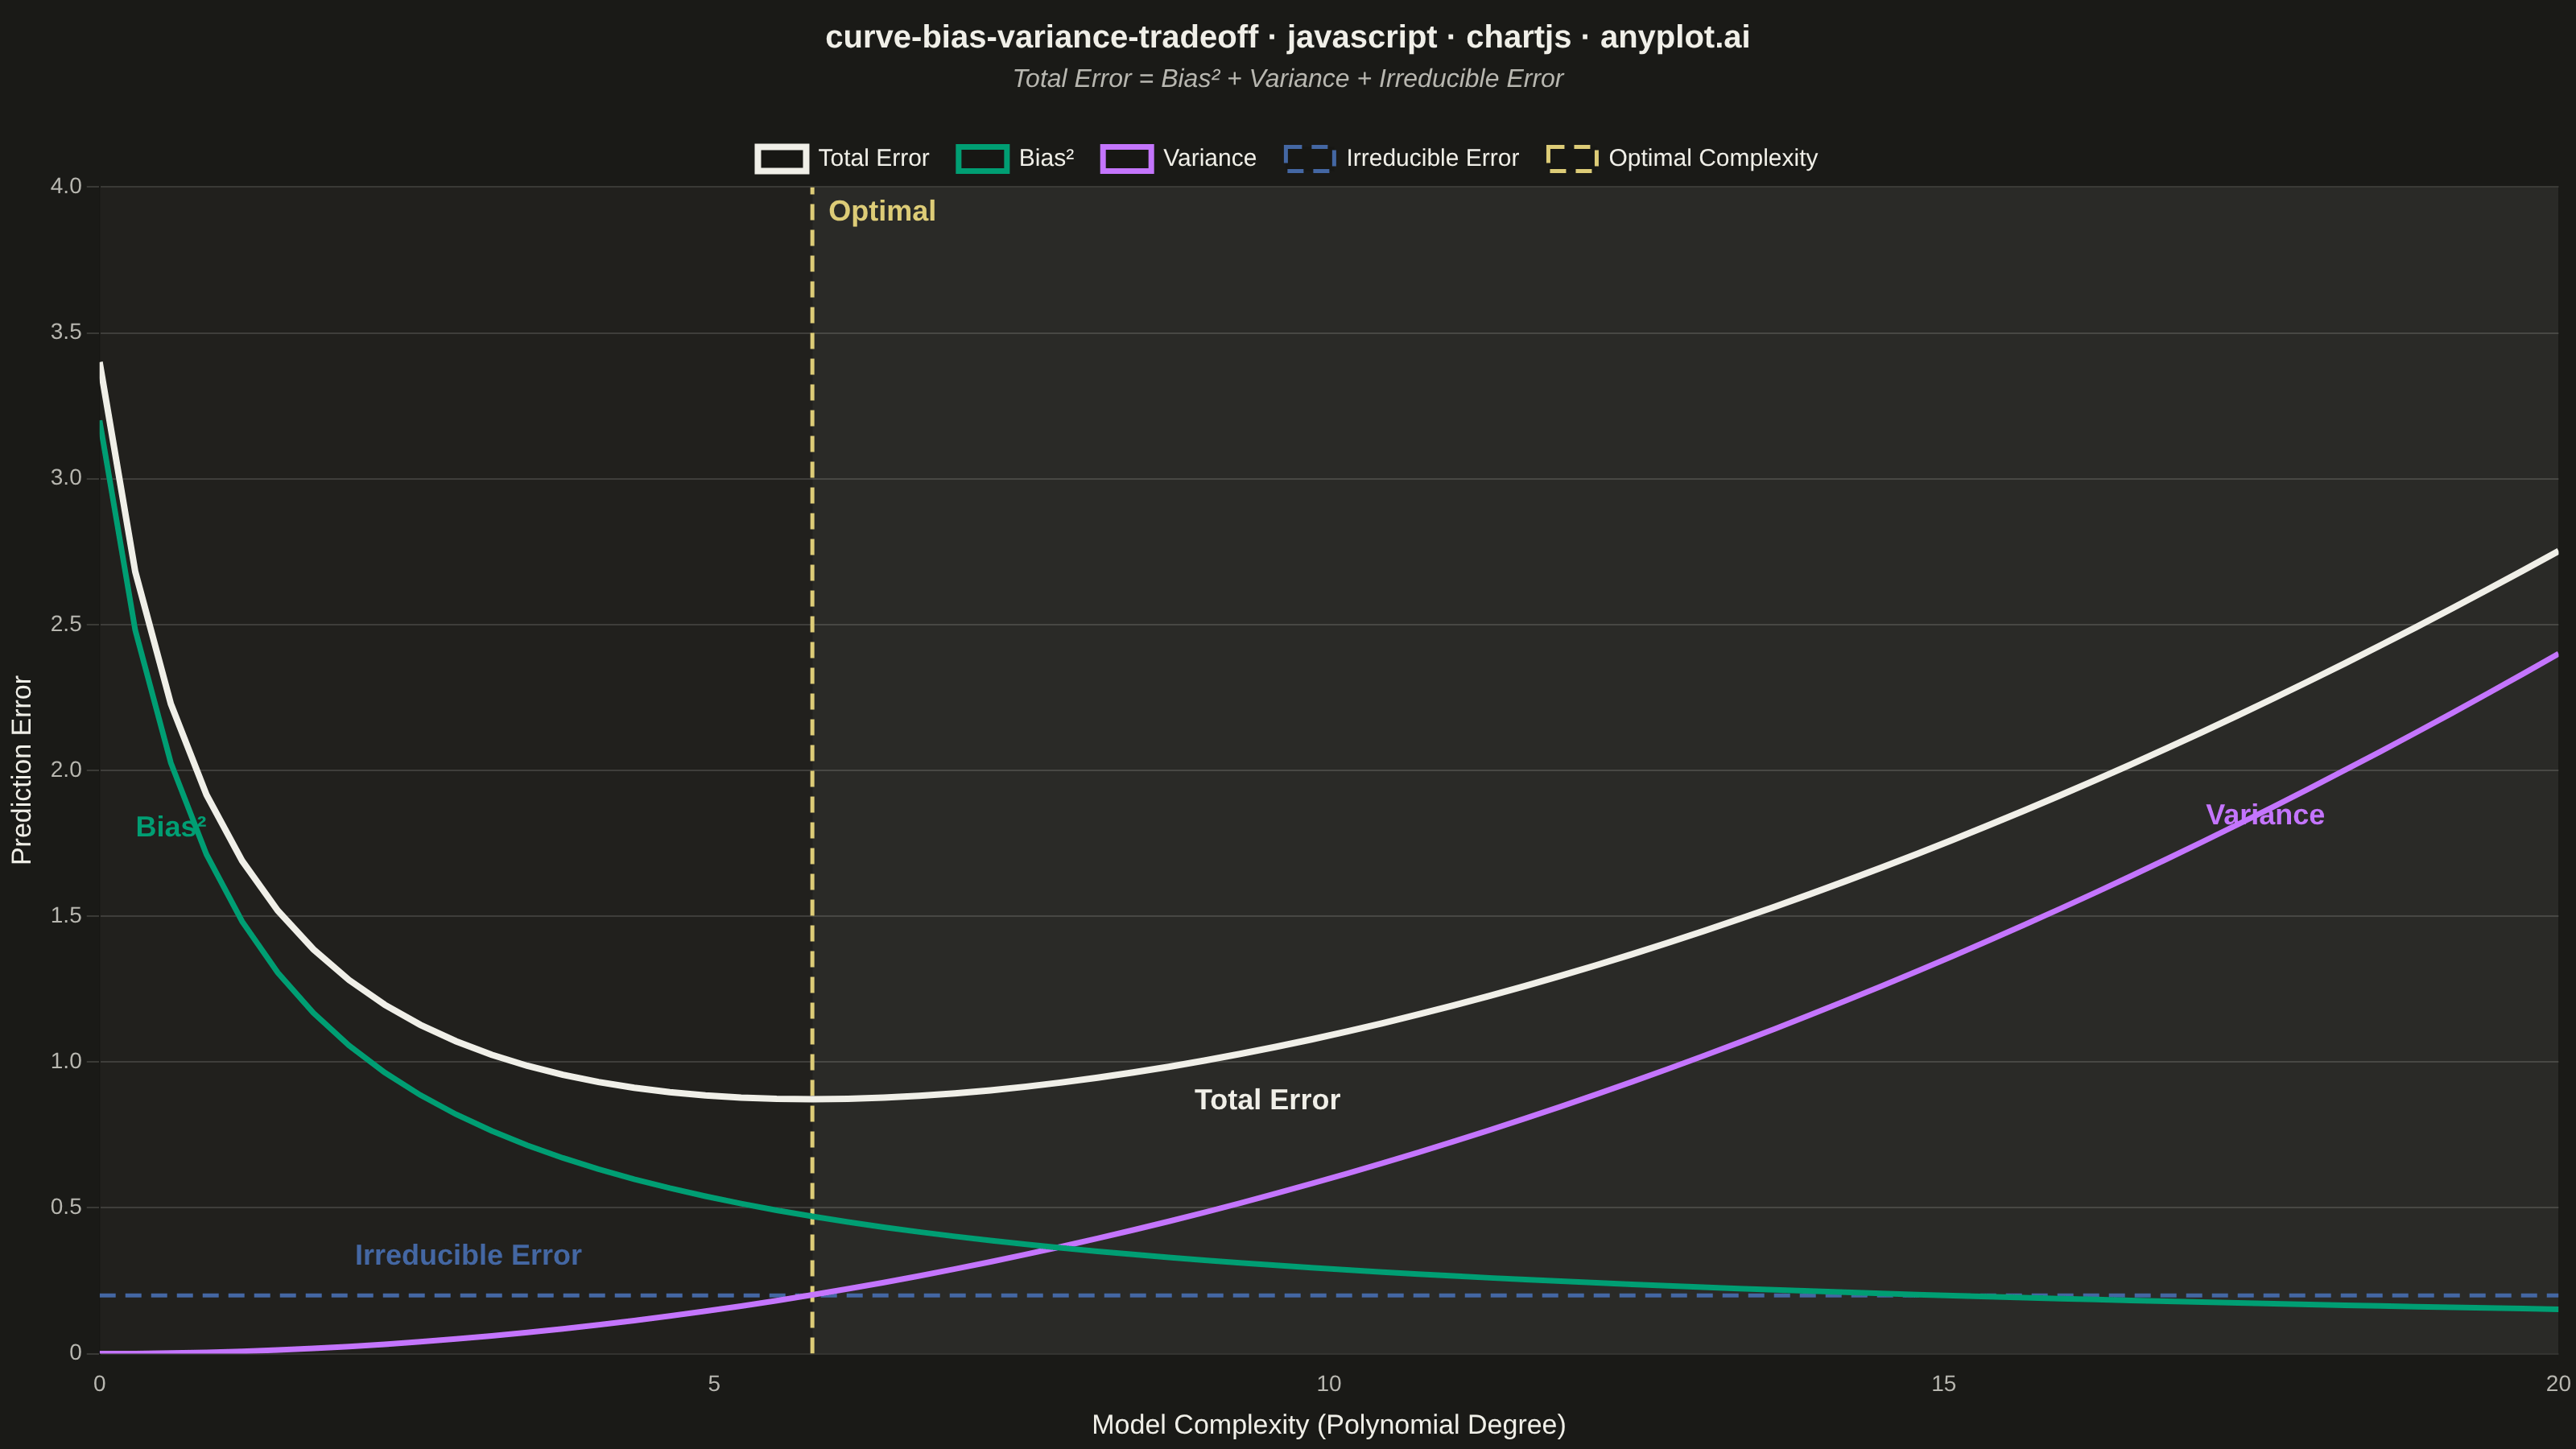
A theoretical visualization of the bias-variance tradeoff showing how total prediction error decomposes into bias squared, variance, and irreducible noise as a function of model complexity. The plot displays multiple curves: bias squared (decreasing with complexity), variance (increasing with complexity), irreducible error (constant), and total error (U-shaped). This is one of the most fundamental conceptual plots in machine learning for understanding model selection, overfitting, and underfitting.
// anyplot.ai
// curve-bias-variance-tradeoff: Bias-Variance Tradeoff Curve
// Library: chartjs 4.4.7 | JavaScript 22.23.2
// Quality: 91/100 | Created: 2026-08-24

const t = window.ANYPLOT_TOKENS;

// --- Data (in-memory, deterministic) ----------------------------------------
// Theoretical curves — bias squared decreases with complexity, variance
// increases, irreducible error is a flat noise floor, total error is their sum.
const N = 70;
const X_MIN = 0;
const X_MAX = 20;
const IRREDUCIBLE_ERROR = 0.2;

const complexity = Array.from({ length: N }, (_, i) => X_MIN + (i * (X_MAX - X_MIN)) / (N - 1));
const biasSquared = complexity.map((x) => 3.2 / (1 + x));
const variance = complexity.map((x) => 0.006 * x * x);
const irreducible = complexity.map(() => IRREDUCIBLE_ERROR);
const totalError = complexity.map((x, i) => biasSquared[i] + variance[i] + irreducible[i]);

// Optimal complexity = argmin(total error)
let optimalIndex = 0;
for (let i = 1; i < N; i++) {
  if (totalError[i] < totalError[optimalIndex]) optimalIndex = i;
}
const optimalX = complexity[optimalIndex];

const yMax = Math.ceil(Math.max(...biasSquared, ...totalError) * 1.15 * 10) / 10;

// Nearest sample index for a given x — used to place direct curve labels.
const indexAt = (x) => Math.round(((x - X_MIN) * (N - 1)) / (X_MAX - X_MIN));

const biasPoints = complexity.map((x, i) => ({ x, y: biasSquared[i] }));
const variancePoints = complexity.map((x, i) => ({ x, y: variance[i] }));
const irreduciblePoints = complexity.map((x, i) => ({ x, y: irreducible[i] }));
const totalPoints = complexity.map((x, i) => ({ x, y: totalError[i] }));

// --- Mount -------------------------------------------------------------------
const canvas = document.createElement("canvas");
document.getElementById("container").appendChild(canvas);

// --- Zone shading (underfitting left of optimum, overfitting right) ----------
// Chrome-colored wash (no new hue introduced) — context, not data.
const underfitZone = {
  label: "Underfitting Zone",
  data: [
    { x: X_MIN, y: yMax },
    { x: optimalX, y: yMax },
  ],
  fill: "origin",
  backgroundColor: `${t.ink}08`,
  borderWidth: 0,
  pointRadius: 0,
  tension: 0,
  order: 3,
};
const overfitZone = {
  label: "Overfitting Zone",
  data: [
    { x: optimalX, y: yMax },
    { x: X_MAX, y: yMax },
  ],
  fill: "origin",
  backgroundColor: `${t.ink}14`,
  borderWidth: 0,
  pointRadius: 0,
  tension: 0,
  order: 3,
};

// --- Optimal-complexity reference line ----------------------------------------
const optimalLine = {
  label: "Optimal Complexity",
  data: [
    { x: optimalX, y: 0 },
    { x: optimalX, y: yMax },
  ],
  fill: false,
  borderColor: t.amber,
  borderWidth: 2.5,
  borderDash: [10, 6],
  pointRadius: 0,
  tension: 0,
  order: 2,
};

// --- Curve datasets — Imprint palette in canonical order + neutral anchor ----
const biasDataset = {
  label: "Bias²",
  data: biasPoints,
  fill: false,
  borderColor: t.palette[0],
  borderWidth: 3.5,
  pointRadius: 0,
  tension: 0,
  order: 1,
};
const varianceDataset = {
  label: "Variance",
  data: variancePoints,
  fill: false,
  borderColor: t.palette[1],
  borderWidth: 3.5,
  pointRadius: 0,
  tension: 0,
  order: 1,
};
const irreducibleDataset = {
  label: "Irreducible Error",
  data: irreduciblePoints,
  fill: false,
  borderColor: t.palette[2],
  borderWidth: 2.5,
  borderDash: [10, 6],
  pointRadius: 0,
  tension: 0,
  order: 1,
};
const totalDataset = {
  label: "Total Error",
  // Total error is the reference sum of the other three — Imprint's
  // theme-adaptive "neutral" anchor (totals / baseline / reference line).
  data: totalPoints,
  fill: false,
  borderColor: t.ink,
  borderWidth: 4,
  pointRadius: 0,
  tension: 0,
  order: 0,
};

// Inline plugin: label each curve directly on the plot + the optimal point
const curveLabels = {
  id: "curveLabels",
  afterDraw(chart) {
    const ctx = chart.ctx;
    const xsc = chart.scales.x;
    const ysc = chart.scales.y;

    const label = (text, x, y, color, dx, dy, align) => {
      ctx.save();
      ctx.font = "600 18px sans-serif";
      ctx.fillStyle = color;
      ctx.textAlign = align;
      ctx.textBaseline = "middle";
      ctx.fillText(text, xsc.getPixelForValue(x) + dx, ysc.getPixelForValue(y) + dy);
      ctx.restore();
    };

    label("Bias²", 1, biasSquared[indexAt(1)], t.palette[0], -10, -16, "right");
    label("Variance", 17, variance[indexAt(17)], t.palette[1], 10, -16, "left");
    label("Irreducible Error", 3, IRREDUCIBLE_ERROR, t.palette[2], 0, -24, "center");
    label("Total Error", 9.5, totalError[indexAt(9.5)], t.ink, 0, 34, "center");
    label("Optimal", optimalX, yMax, t.amber, 10, 16, "left");
  },
};

// --- Chart -------------------------------------------------------------------
new Chart(canvas, {
  type: "line",
  plugins: [curveLabels],
  data: {
    datasets: [underfitZone, overfitZone, optimalLine, biasDataset, varianceDataset, irreducibleDataset, totalDataset],
  },
  options: {
    responsive: true,
    maintainAspectRatio: false,
    animation: false,
    plugins: {
      title: {
        display: true,
        text: "curve-bias-variance-tradeoff · javascript · chartjs · anyplot.ai",
        color: t.ink,
        font: { size: 20 },
        padding: { top: 12, bottom: 4 },
      },
      subtitle: {
        display: true,
        text: "Total Error = Bias² + Variance + Irreducible Error",
        color: t.inkSoft,
        font: { size: 16, style: "italic" },
        padding: { bottom: 14 },
      },
      legend: {
        labels: {
          color: t.ink,
          font: { size: 15 },
          boxWidth: 30,
          padding: 18,
          filter: (item) => !["Underfitting Zone", "Overfitting Zone"].includes(item.text),
        },
      },
    },
    scales: {
      x: {
        type: "linear",
        min: X_MIN,
        max: X_MAX,
        title: {
          display: true,
          text: "Model Complexity (Polynomial Degree)",
          color: t.ink,
          font: { size: 17 },
        },
        ticks: { color: t.inkSoft, font: { size: 14 }, stepSize: 5 },
        grid: { display: false },
      },
      y: {
        type: "linear",
        min: 0,
        max: yMax,
        title: {
          display: true,
          text: "Prediction Error",
          color: t.ink,
          font: { size: 17 },
        },
        ticks: { color: t.inkSoft, font: { size: 14 } },
        grid: { color: t.grid },
      },
    },
  },
});
Runnable source as JSON, for any HTTP client: https://api.anyplot.ai/specs/curve-bias-variance-tradeoff/chartjs/code. Any spec id and library id listed in llms-full.txt fit the same URL shape; every URL below is complete and callable.
{
  "spec_id": "curve-bias-variance-tradeoff",
  "language": "javascript",
  "library": "chartjs",
  "page": "https://anyplot.ai/curve-bias-variance-tradeoff/javascript/chartjs",
  "hub": "https://anyplot.ai/curve-bias-variance-tradeoff",
  "code_json": "https://api.anyplot.ai/specs/curve-bias-variance-tradeoff/chartjs/code",
  "spec_json": "https://api.anyplot.ai/specs/curve-bias-variance-tradeoff",
  "render_light_png": "https://storage.googleapis.com/anyplot-images/plots/curve-bias-variance-tradeoff/javascript/chartjs/plot-light.png",
  "render_dark_png": "https://storage.googleapis.com/anyplot-images/plots/curve-bias-variance-tradeoff/javascript/chartjs/plot-dark.png",
  "interactive_light_html": "https://storage.googleapis.com/anyplot-images/plots/curve-bias-variance-tradeoff/javascript/chartjs/plot-light.html",
  "interactive_dark_html": "https://storage.googleapis.com/anyplot-images/plots/curve-bias-variance-tradeoff/javascript/chartjs/plot-dark.html",
  "quality_score": 91.0,
  "license": "MIT",
  "guide": "https://anyplot.ai/llms.txt"
}
Part of Bias-Variance Tradeoff Curve on anyplot.ai.