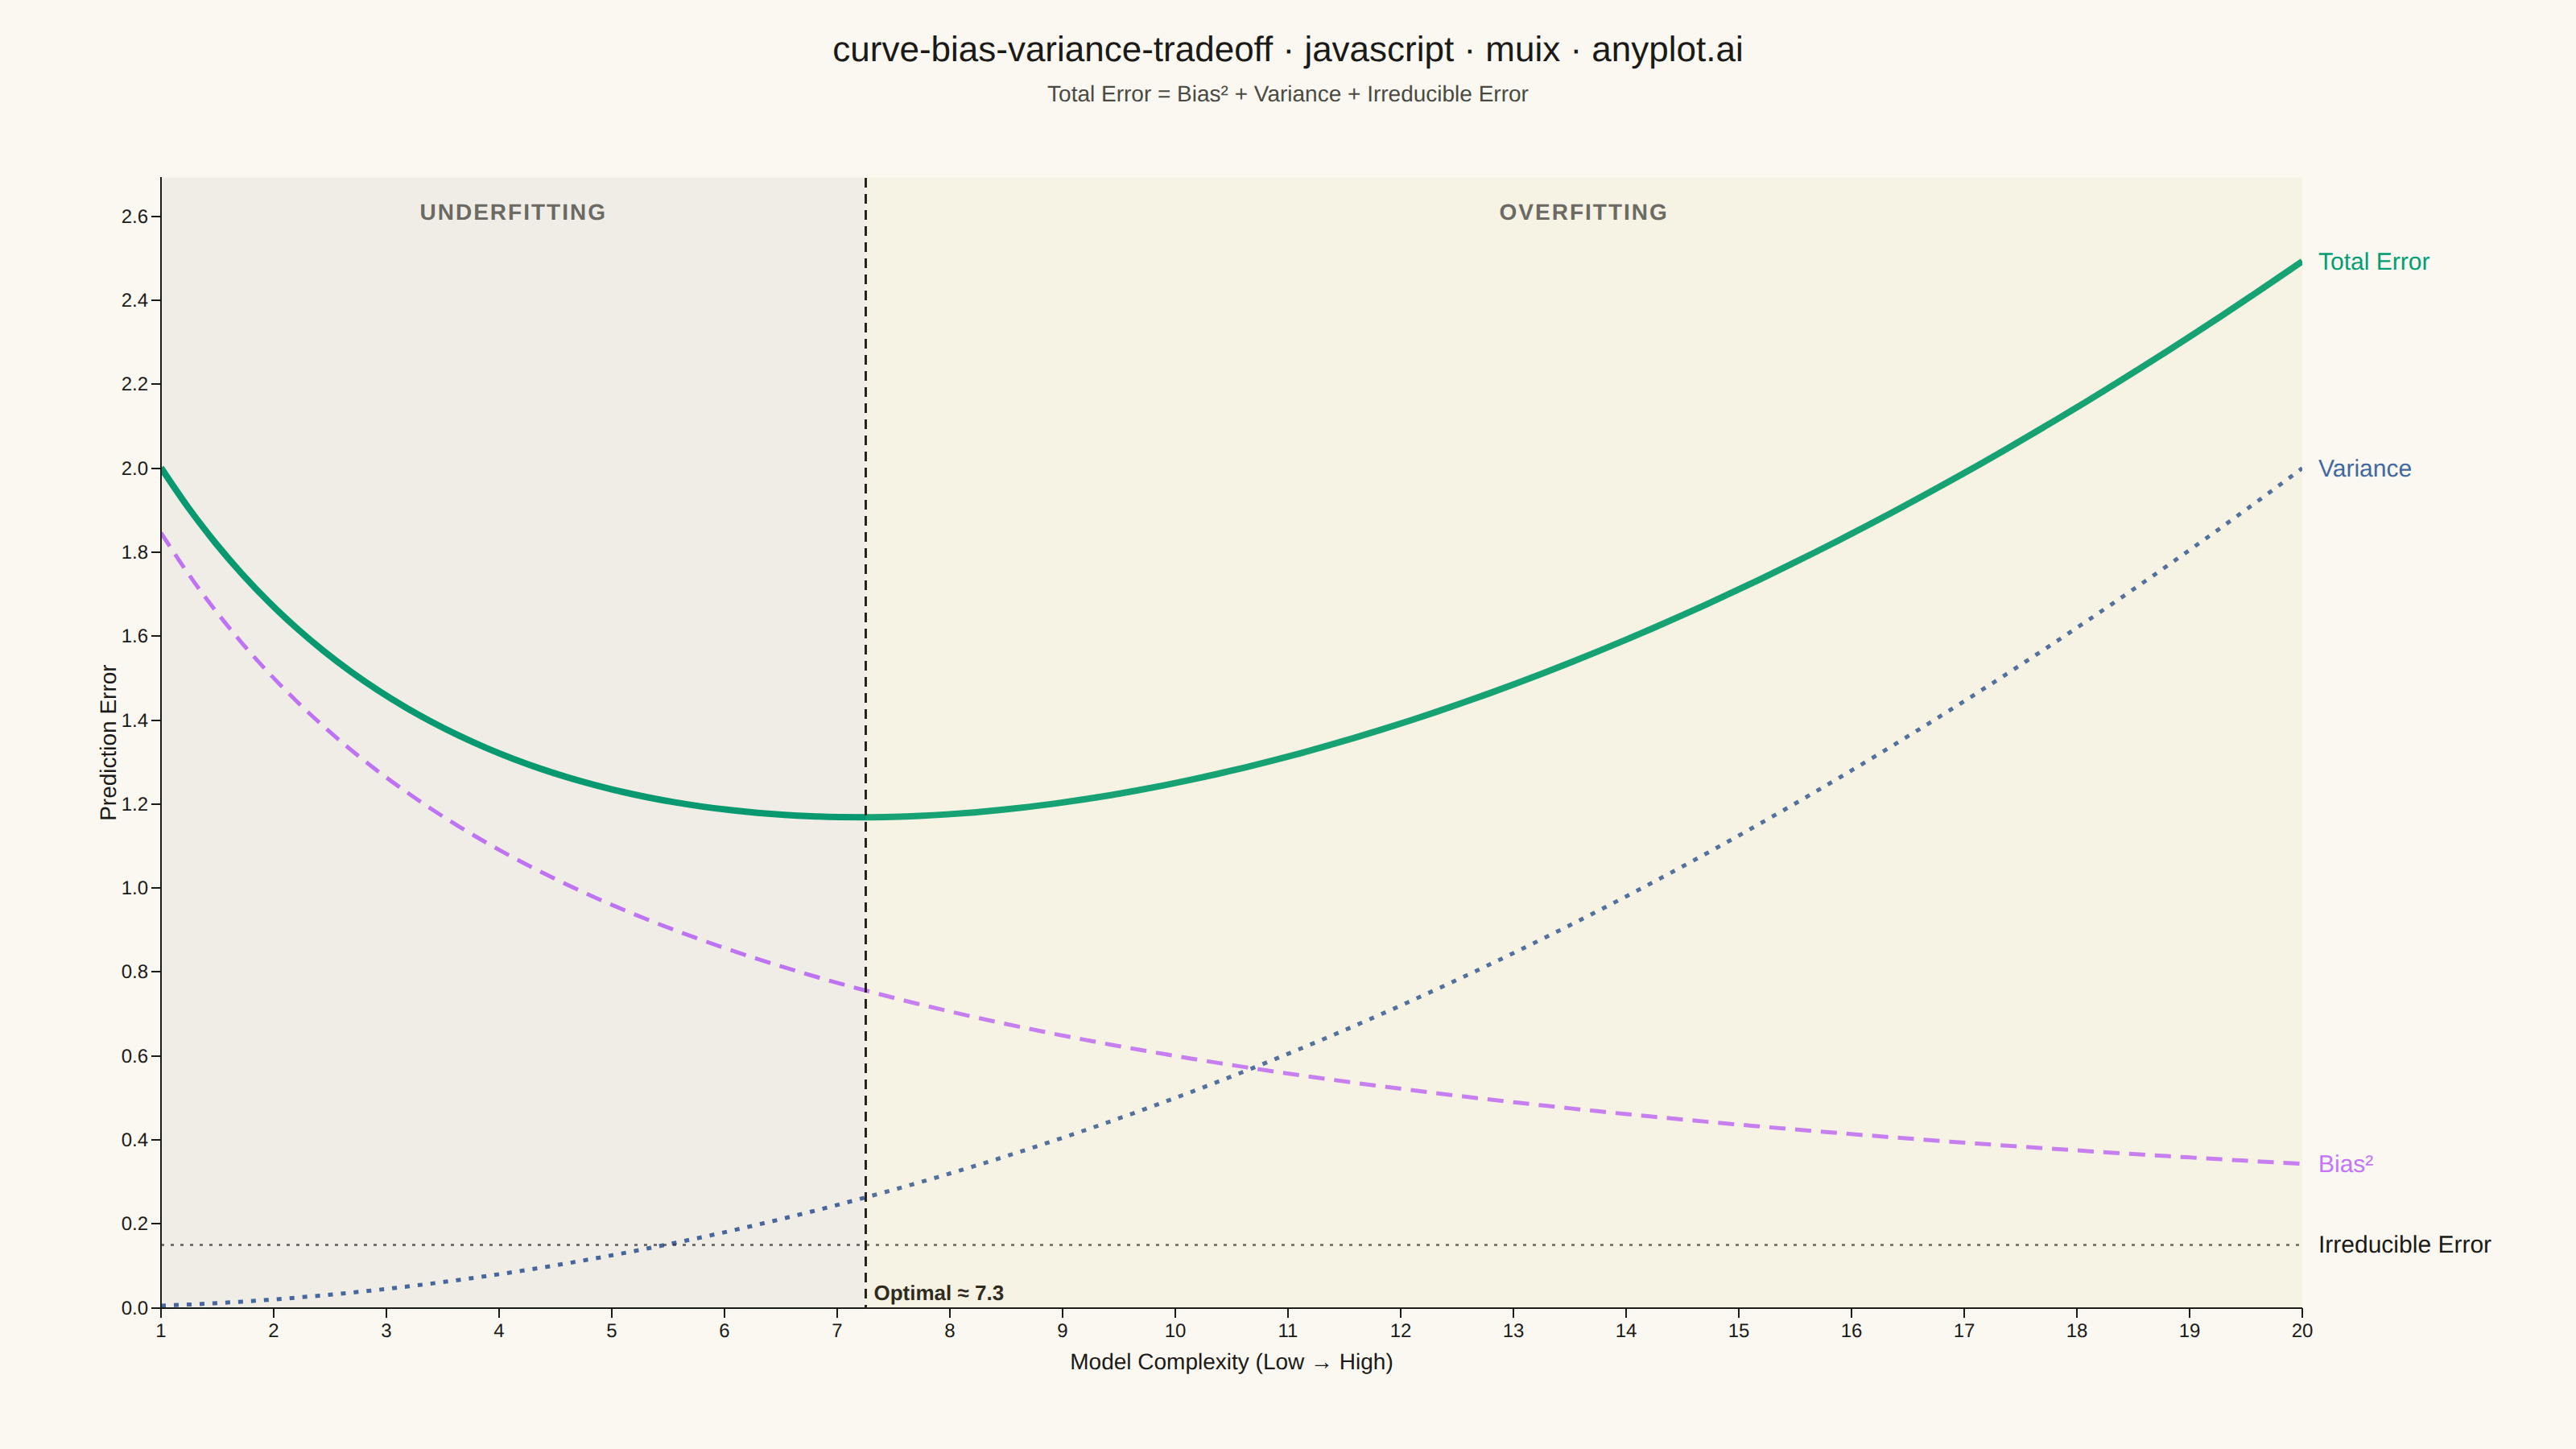
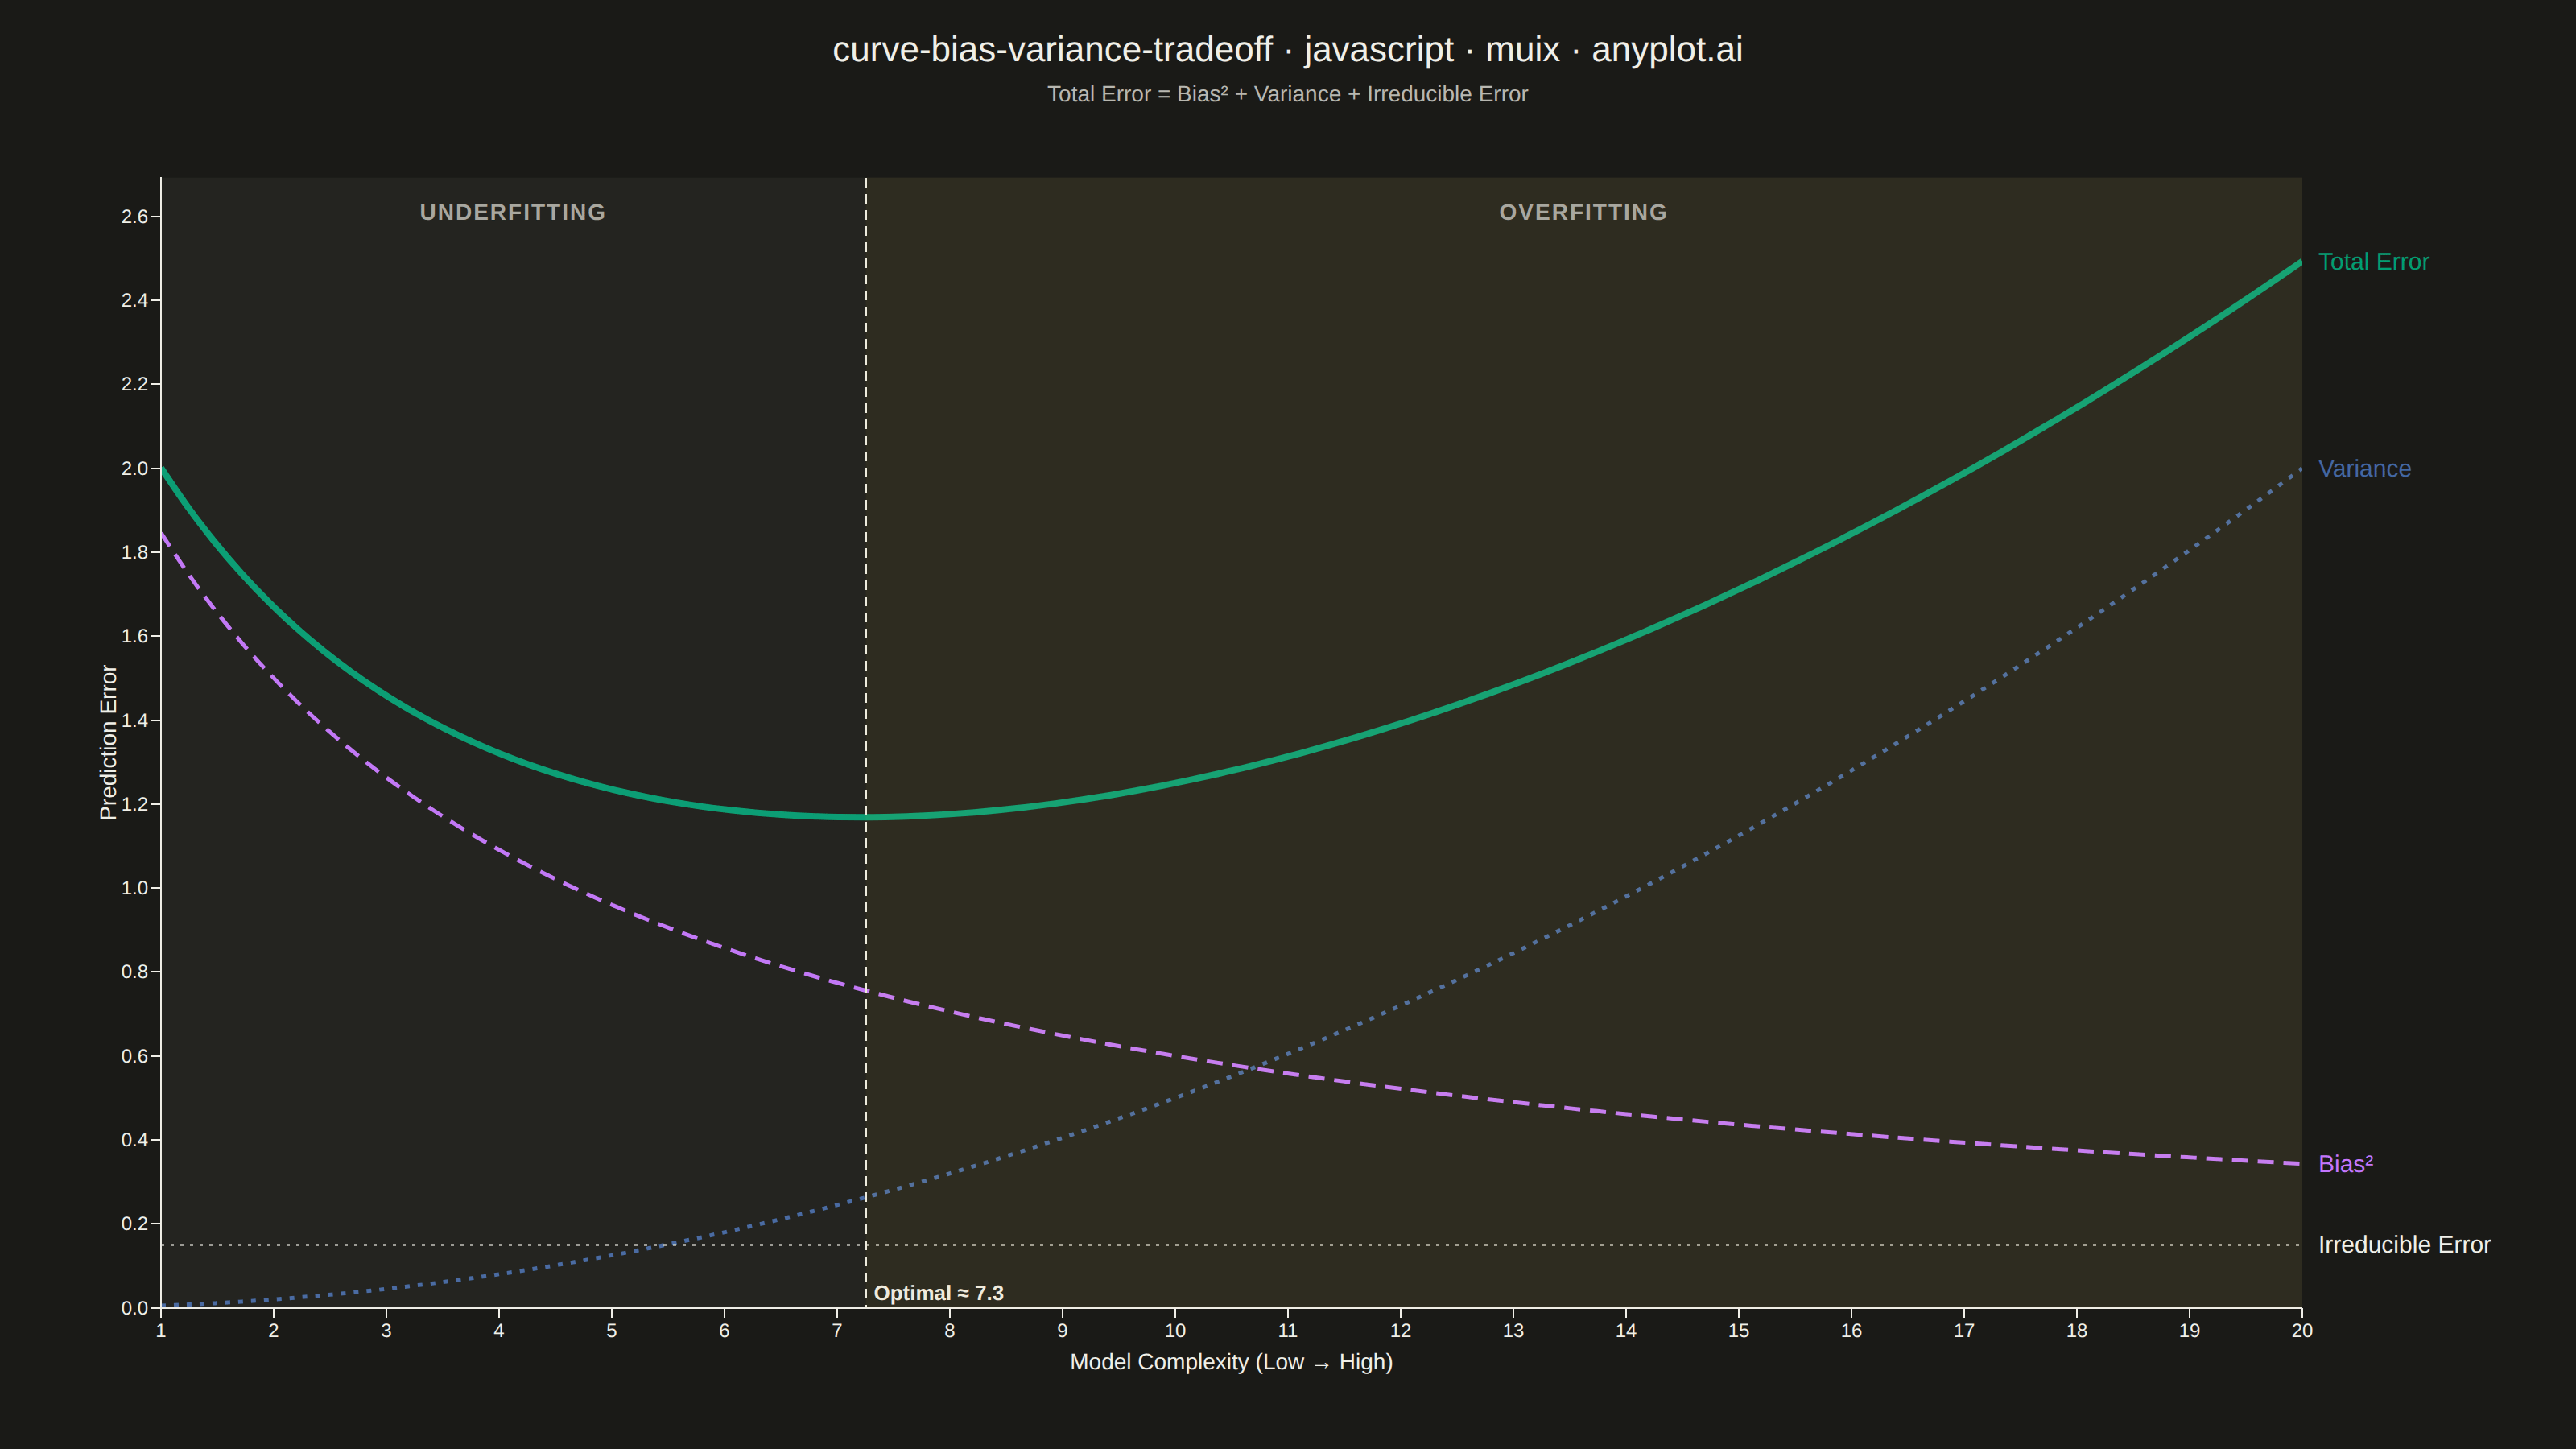
The same plot in 14 other libraries — JavaScript: Chart.js, D3.js, Apache ECharts, Highcharts; Python: Altair, Bokeh, lets-plot, Matplotlib, Plotly, plotnine, Pygal, Seaborn; R: ggplot2; Julia: Makie.jl. Compare all 15 side by side: Bias-Variance Tradeoff Curve in Python, R, Julia and JavaScript.
A theoretical visualization of the bias-variance tradeoff showing how total prediction error decomposes into bias squared, variance, and irreducible noise as a function of model complexity. The plot displays multiple curves: bias squared (decreasing with complexity), variance (increasing with complexity), irreducible error (constant), and total error (U-shaped). This is one of the most fundamental conceptual plots in machine learning for understanding model selection, overfitting, and underfitting.
// anyplot.ai
// curve-bias-variance-tradeoff: Bias-Variance Tradeoff Curve
// Library: muix 7.29.1 | JavaScript 22.23.2
// Quality: 97/100 | Created: 2026-08-24

import { LineChart } from "@mui/x-charts/LineChart";
import { ChartsReferenceLine } from "@mui/x-charts/ChartsReferenceLine";
import { useXScale, useYScale, useDrawingArea } from "@mui/x-charts/hooks";
import Box from "@mui/material/Box";
import Typography from "@mui/material/Typography";

const t = window.ANYPLOT_TOKENS;
// "muted" semantic anchor is not exposed on ANYPLOT_TOKENS — derive per theme
// to match prompts/default-style-guide.md "Theme-adaptive Chrome" table.
const INK_MUTED = window.ANYPLOT_THEME === "dark" ? "#A8A79F" : "#6B6A63";

// --- Data: theoretical error-decomposition curves, not empirical -----------
const N_POINTS = 80;
const COMPLEXITY_MIN = 1;
const COMPLEXITY_MAX = 20;
const modelComplexity = Array.from(
  { length: N_POINTS },
  (_, i) => COMPLEXITY_MIN + (i * (COMPLEXITY_MAX - COMPLEXITY_MIN)) / (N_POINTS - 1),
);

const IRREDUCIBLE_ERROR = 0.15;
const biasSquared = modelComplexity.map((c) => 2.4 / (1 + 0.3 * c));
const variance = modelComplexity.map((c) => 0.005 * c * c);
const irreducibleError = modelComplexity.map(() => IRREDUCIBLE_ERROR);
const totalError = modelComplexity.map((_, i) => biasSquared[i] + variance[i] + IRREDUCIBLE_ERROR);

let optimalIndex = 0;
for (let i = 1; i < totalError.length; i++) {
  if (totalError[i] < totalError[optimalIndex]) optimalIndex = i;
}
const optimalComplexity = modelComplexity[optimalIndex];
const yMax = Math.max(...totalError) * 1.08;

const series = [
  { id: "total", label: "Total Error", data: totalError, color: t.palette[0], curve: "monotoneX" as const, showMark: false },
  { id: "bias", label: "Bias²", data: biasSquared, color: t.palette[1], curve: "monotoneX" as const, showMark: false },
  { id: "variance", label: "Variance", data: variance, color: t.palette[2], curve: "monotoneX" as const, showMark: false },
  // "Irreducible" plays the neutral/baseline semantic role (see default-style-guide.md
  // "Semantic anchors") — a constant reference line, styled to read as part of the chart's ink.
  { id: "irreducible", label: "Irreducible Error", data: irreducibleError, color: t.ink, curve: "linear" as const, showMark: false },
];

const TITLE_HEIGHT = 84;

// --- Overlay: underfit/overfit zones + direct end-of-line curve labels ------
function Annotations() {
  const xScale = useXScale();
  const yScale = useYScale();
  const { left, top, width, height } = useDrawingArea();

  const xOptimal = xScale(optimalComplexity);
  const xMin = left;
  const xMax = left + width;

  const endLabels = [
    { id: "total", value: totalError[totalError.length - 1], color: t.palette[0], text: "Total Error" },
    { id: "variance", value: variance[variance.length - 1], color: t.palette[2], text: "Variance" },
    { id: "bias", value: biasSquared[biasSquared.length - 1], color: t.palette[1], text: "Bias²" },
    { id: "irreducible", value: IRREDUCIBLE_ERROR, color: t.ink, text: "Irreducible Error" },
  ]
    .map((s) => ({ ...s, y: yScale(s.value) }))
    .sort((a, b) => a.y - b.y);

  const MIN_LABEL_GAP = 20;
  for (let i = 1; i < endLabels.length; i++) {
    if (endLabels[i].y - endLabels[i - 1].y < MIN_LABEL_GAP) {
      endLabels[i].y = endLabels[i - 1].y + MIN_LABEL_GAP;
    }
  }

  return (
    <g>
      <rect x={xMin} y={top} width={xOptimal - xMin} height={height} fill={INK_MUTED} opacity={0.07} />
      <rect x={xOptimal} y={top} width={xMax - xOptimal} height={height} fill={t.amber} opacity={0.1} />
      <text x={xMin + (xOptimal - xMin) / 2} y={top + 26} fill={INK_MUTED} fontSize={14} fontWeight={600} letterSpacing={1} textAnchor="middle">
        UNDERFITTING
      </text>
      <text x={xOptimal + (xMax - xOptimal) / 2} y={top + 26} fill={INK_MUTED} fontSize={14} fontWeight={600} letterSpacing={1} textAnchor="middle">
        OVERFITTING
      </text>
      {endLabels.map((s) => (
        <text key={s.id} x={xMax + 10} y={s.y + 5} fill={s.color} fontSize={15} fontWeight={500}>
          {s.text}
        </text>
      ))}
    </g>
  );
}

// --- Chart --------------------------------------------------------------------
export default function Chart() {
  const { width, height } = window.ANYPLOT_SIZE;

  return (
    <Box sx={{ width, height, display: "flex", flexDirection: "column", paddingTop: "18px" }}>
      <Typography sx={{ color: t.ink, fontSize: 22, fontWeight: 500, textAlign: "center", lineHeight: 1.2 }}>
        curve-bias-variance-tradeoff · javascript · muix · anyplot.ai
      </Typography>
      <Typography sx={{ color: t.inkSoft, fontSize: 14, textAlign: "center", marginTop: "4px" }}>
        Total Error = Bias² + Variance + Irreducible Error
      </Typography>
      <LineChart
        width={width}
        height={height - TITLE_HEIGHT}
        skipAnimation
        series={series}
        xAxis={[{
          data: modelComplexity,
          scaleType: "linear",
          label: "Model Complexity (Low → High)",
          min: COMPLEXITY_MIN,
          max: COMPLEXITY_MAX,
        }]}
        yAxis={[{ label: "Prediction Error", min: 0, max: yMax }]}
        margin={{ left: 100, right: 170, top: 34, bottom: 80 }}
        slotProps={{ legend: { hidden: true } }}
        sx={{
          "& .MuiChartsAxis-tickLabel": { fontSize: "14px" },
          "& .MuiChartsAxis-label": { fontSize: "16px" },
          "& .MuiLineElement-series-total": { strokeWidth: 4 },
          "& .MuiLineElement-series-bias": { strokeWidth: 2.5, strokeDasharray: "10 6" },
          "& .MuiLineElement-series-variance": { strokeWidth: 2.5, strokeDasharray: "3 5" },
          "& .MuiLineElement-series-irreducible": { strokeWidth: 1.5, strokeDasharray: "2 4", opacity: 0.6 },
        }}
      >
        <ChartsReferenceLine
          x={optimalComplexity}
          label={`Optimal ≈ ${optimalComplexity.toFixed(1)}`}
          labelAlign="end"
          lineStyle={{ stroke: t.ink, strokeDasharray: "6 4", strokeWidth: 1.5 }}
          labelStyle={{ fill: t.ink, fontSize: 13, fontWeight: 600 }}
        />
        <Annotations />
      </LineChart>
    </Box>
  );
}
Runnable source as JSON, for any HTTP client: https://api.anyplot.ai/specs/curve-bias-variance-tradeoff/muix/code. Any spec id and library id listed in llms-full.txt fit the same URL shape; every URL below is complete and callable.
{
  "spec_id": "curve-bias-variance-tradeoff",
  "language": "javascript",
  "library": "muix",
  "page": "https://anyplot.ai/curve-bias-variance-tradeoff/javascript/muix",
  "hub": "https://anyplot.ai/curve-bias-variance-tradeoff",
  "code_json": "https://api.anyplot.ai/specs/curve-bias-variance-tradeoff/muix/code",
  "spec_json": "https://api.anyplot.ai/specs/curve-bias-variance-tradeoff",
  "render_light_png": "https://storage.googleapis.com/anyplot-images/plots/curve-bias-variance-tradeoff/javascript/muix/plot-light.png",
  "render_dark_png": "https://storage.googleapis.com/anyplot-images/plots/curve-bias-variance-tradeoff/javascript/muix/plot-dark.png",
  "interactive_light_html": "https://storage.googleapis.com/anyplot-images/plots/curve-bias-variance-tradeoff/javascript/muix/plot-light.html",
  "interactive_dark_html": "https://storage.googleapis.com/anyplot-images/plots/curve-bias-variance-tradeoff/javascript/muix/plot-dark.html",
  "quality_score": 97.0,
  "license": "MIT",
  "guide": "https://anyplot.ai/llms.txt"
}
Part of Bias-Variance Tradeoff Curve on anyplot.ai.