The same plot in 14 other libraries — JavaScript: Chart.js, D3.js, Apache ECharts, MUI X Charts; Python: Altair, Bokeh, lets-plot, Matplotlib, Plotly, plotnine, Pygal, Seaborn; R: ggplot2; Julia: Makie.jl. Compare all 15 side by side: Bias-Variance Tradeoff Curve in Python, R, Julia and JavaScript.
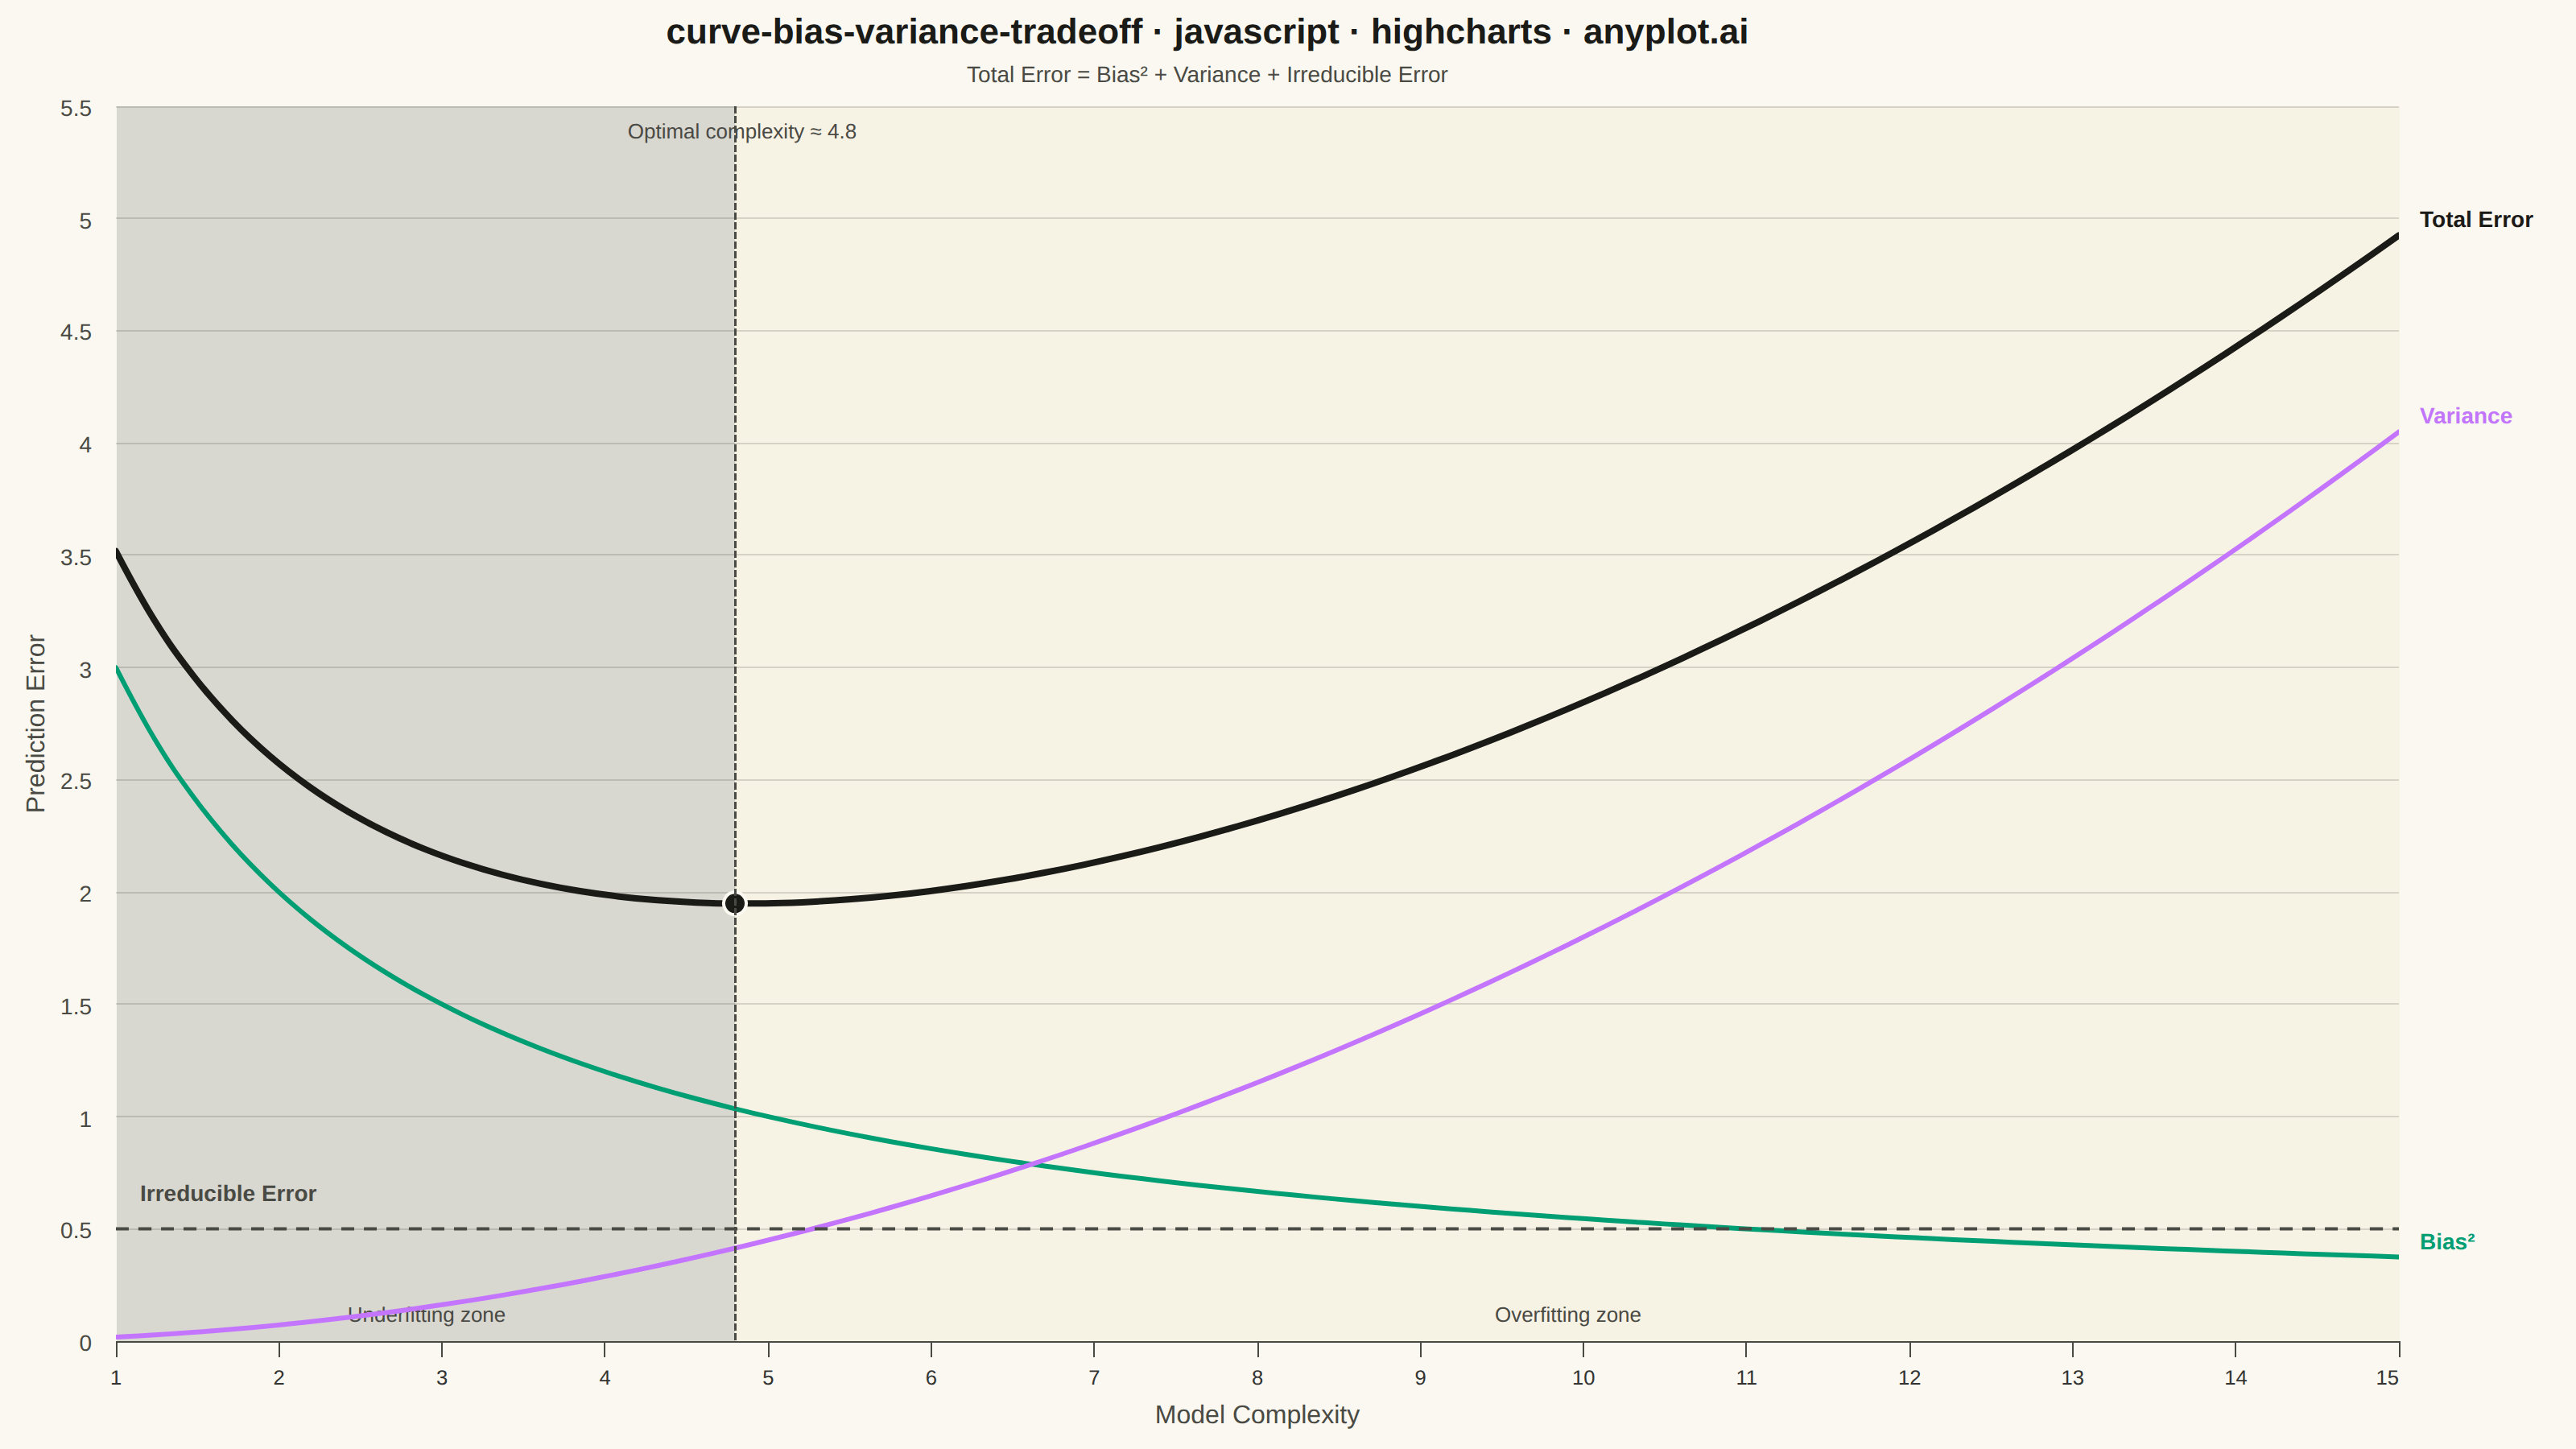
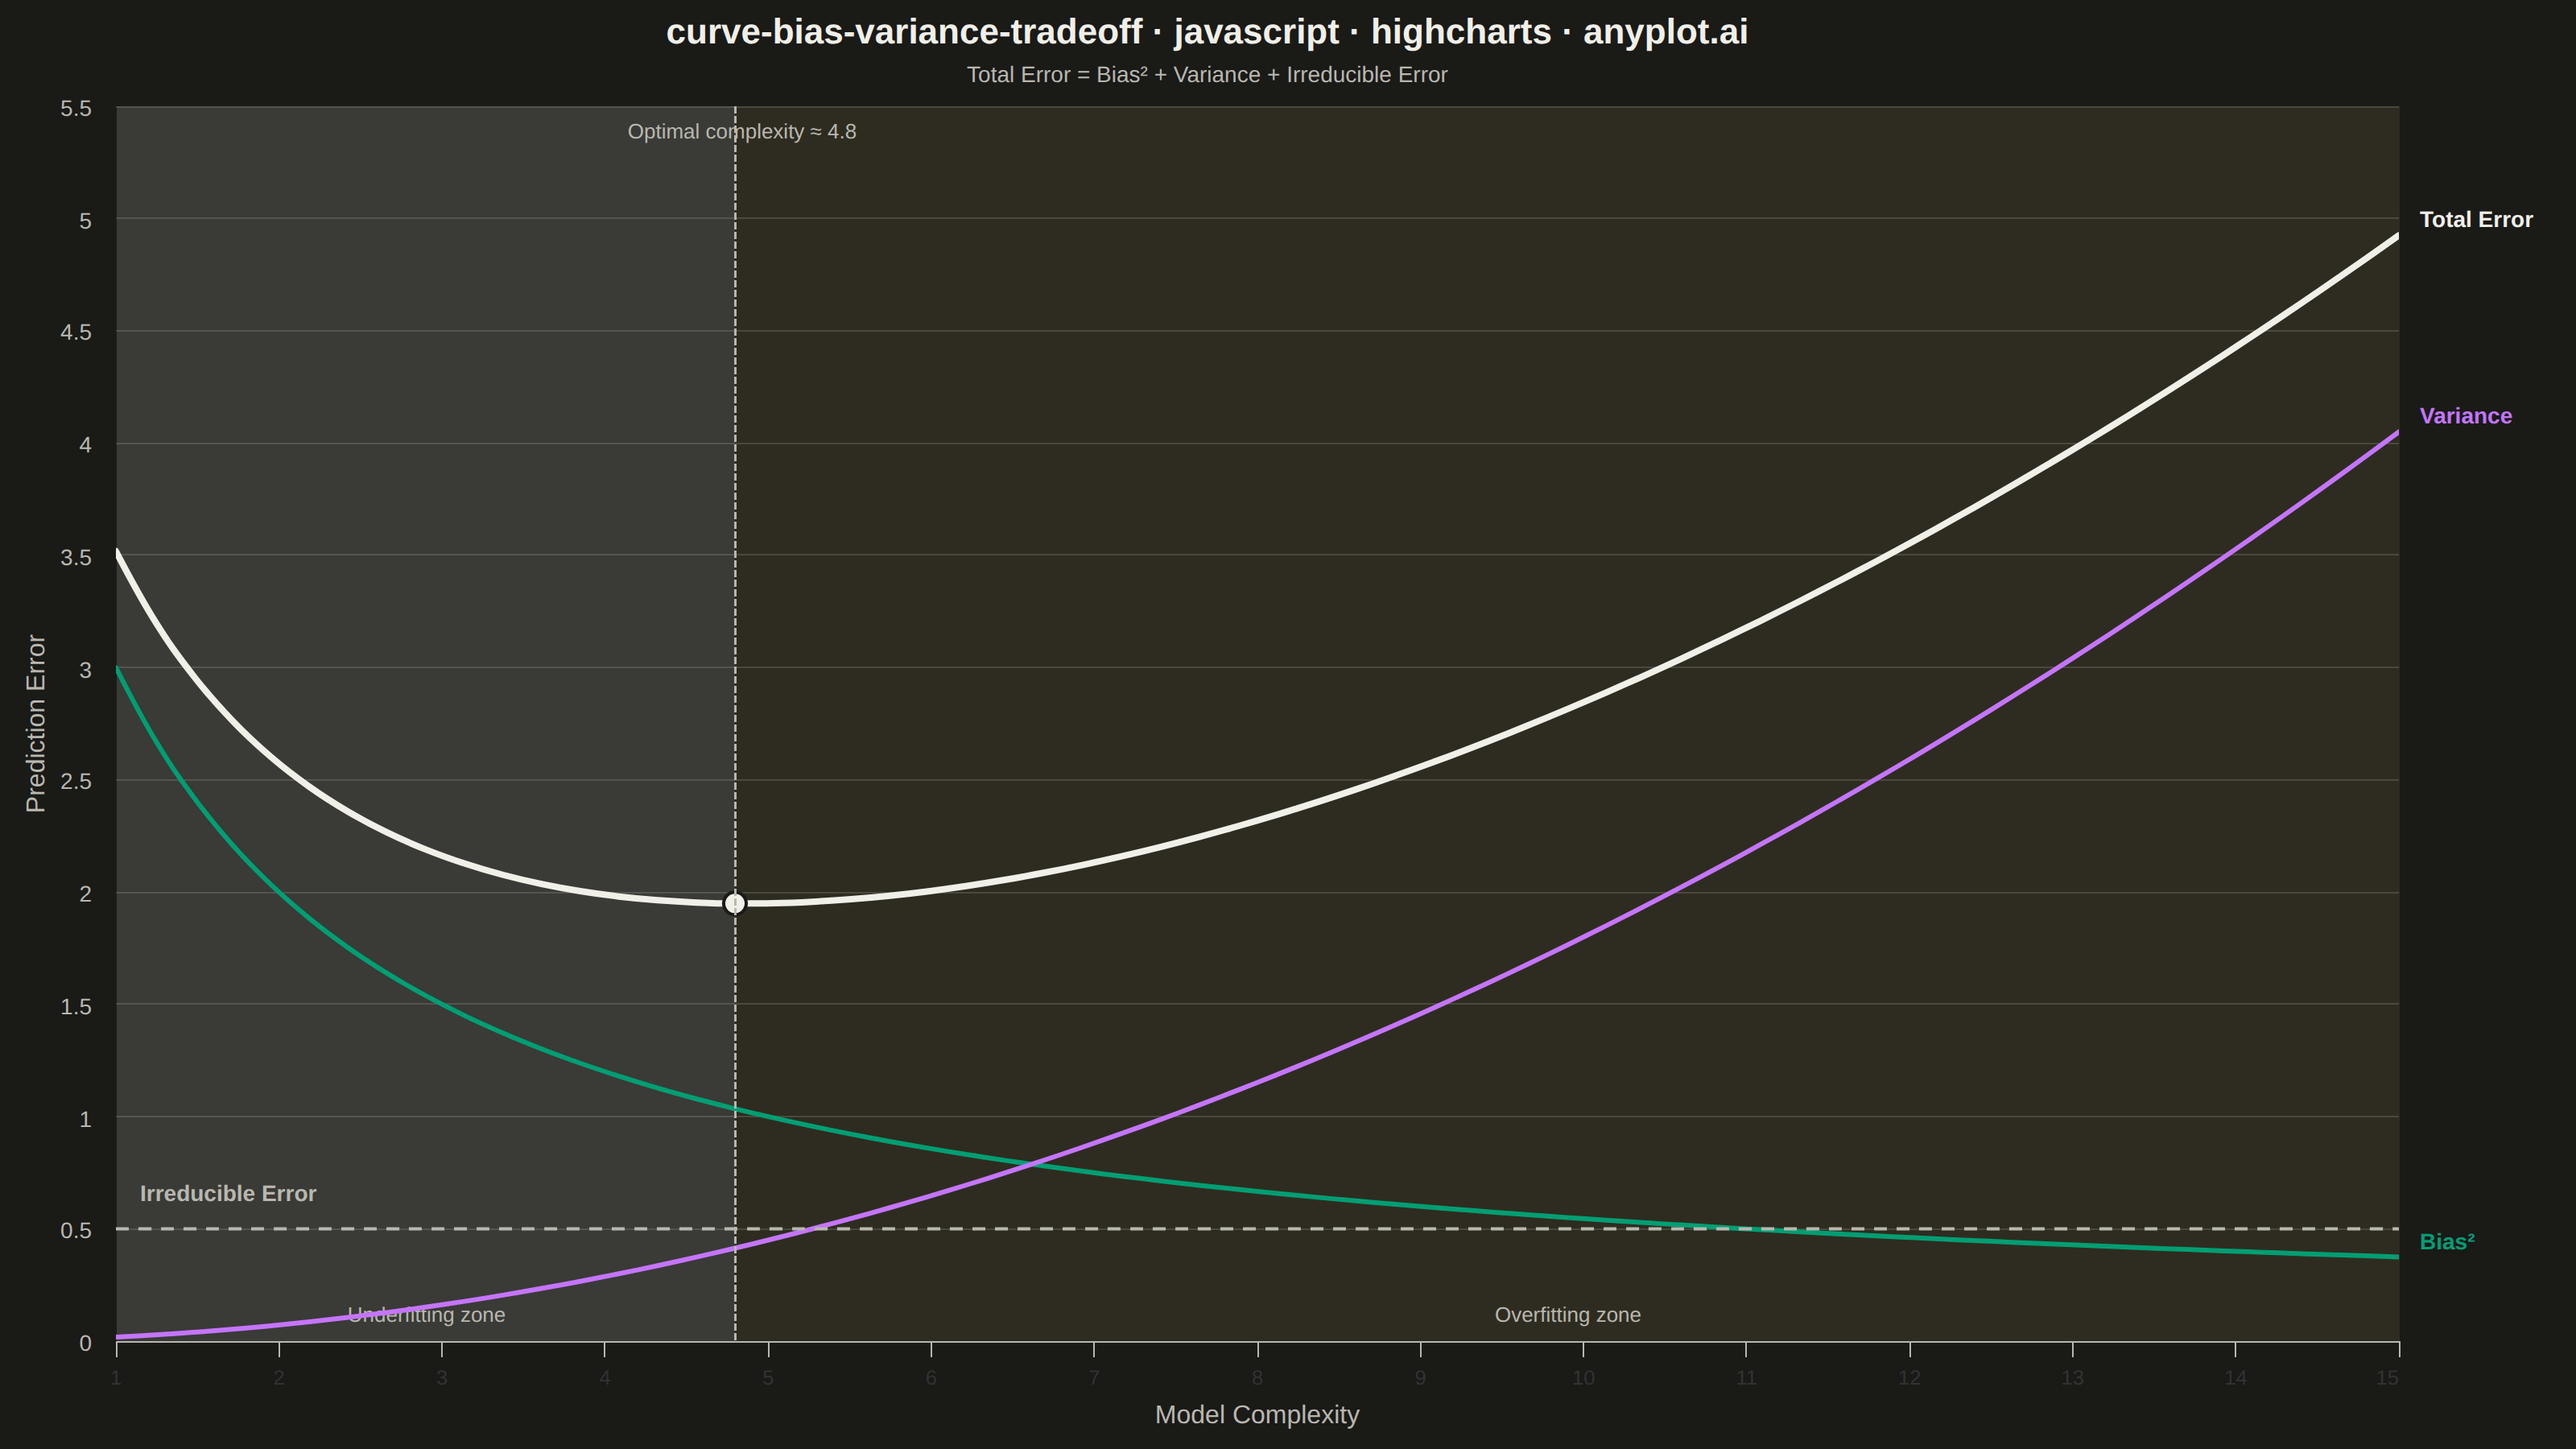
A theoretical visualization of the bias-variance tradeoff showing how total prediction error decomposes into bias squared, variance, and irreducible noise as a function of model complexity. The plot displays multiple curves: bias squared (decreasing with complexity), variance (increasing with complexity), irreducible error (constant), and total error (U-shaped). This is one of the most fundamental conceptual plots in machine learning for understanding model selection, overfitting, and underfitting.
// anyplot.ai
// curve-bias-variance-tradeoff: Bias-Variance Tradeoff Curve
// Library: highcharts 12.6.0 | JavaScript 22.23.2
// Quality: 91/100 | Created: 2026-08-24

const t = window.ANYPLOT_TOKENS;
const hexToRgba = (hex, alpha) => {
  const n = parseInt(hex.slice(1), 16);
  return `rgba(${(n >> 16) & 255},${(n >> 8) & 255},${n & 255},${alpha})`;
};

// --- Data (theoretical curves, deterministic) -------------------------------
// Model complexity stands in for e.g. polynomial degree or tree depth.
const N = 60;
const complexity = Array.from({ length: N }, (_, i) => 1 + (i * 14) / (N - 1));

const biasSquared = complexity.map((c) => 6 / (1 + c));
const variance = complexity.map((c) => 0.018 * c * c);
const irreducibleValue = 0.5;
const irreducibleError = complexity.map(() => irreducibleValue);
const totalError = complexity.map(
  (_, i) => biasSquared[i] + variance[i] + irreducibleValue,
);

let optimalIdx = 0;
totalError.forEach((v, i) => {
  if (v < totalError[optimalIdx]) optimalIdx = i;
});
const optimalComplexity = complexity[optimalIdx];
const lastIdx = N - 1;

// [x, y] pairs so each value lands at its real complexity coordinate.
const asPairs = (ys) => complexity.map((x, i) => [x, ys[i]]);

// --- Chart -------------------------------------------------------------------
Highcharts.chart("container", {
  chart: {
    type: "spline",
    backgroundColor: "transparent",
    animation: false,
    spacingRight: 110,
    style: { fontFamily: "inherit" },
  },
  credits: { enabled: false },
  colors: t.palette,
  title: {
    text: "curve-bias-variance-tradeoff · javascript · highcharts · anyplot.ai",
    style: { color: t.ink, fontSize: "22px", fontWeight: "600" },
  },
  subtitle: {
    text: "Total Error = Bias² + Variance + Irreducible Error",
    style: { color: t.inkSoft, fontSize: "14px" },
  },
  xAxis: {
    min: 1,
    max: 15,
    lineColor: t.inkSoft,
    tickColor: t.inkSoft,
    gridLineColor: t.grid,
    title: {
      text: "Model Complexity",
      style: { color: t.inkSoft, fontSize: "16px" },
    },
    plotBands: [
      {
        from: 1,
        to: optimalComplexity,
        color: t.grid,
        label: {
          text: "Underfitting zone",
          align: "center",
          verticalAlign: "bottom",
          y: -12,
          style: { color: t.inkSoft, fontSize: "13px" },
        },
      },
      {
        from: optimalComplexity,
        to: 15,
        color: hexToRgba(t.amber, 0.1),
        label: {
          text: "Overfitting zone",
          align: "center",
          verticalAlign: "bottom",
          y: -12,
          style: { color: t.inkSoft, fontSize: "13px" },
        },
      },
    ],
    plotLines: [
      {
        value: optimalComplexity,
        color: t.inkSoft,
        width: 1.5,
        dashStyle: "ShortDash",
        zIndex: 4,
        label: {
          text: `Optimal complexity ≈ ${optimalComplexity.toFixed(1)}`,
          rotation: 0,
          align: "center",
          y: 20,
          style: { color: t.inkSoft, fontSize: "13px" },
        },
      },
    ],
  },
  yAxis: {
    min: 0,
    title: {
      text: "Prediction Error",
      style: { color: t.inkSoft, fontSize: "16px" },
    },
    gridLineColor: t.grid,
    labels: { style: { color: t.inkSoft, fontSize: "14px" } },
  },
  legend: { enabled: false },
  tooltip: { enabled: false },
  plotOptions: {
    series: {
      animation: false,
      marker: { enabled: false },
      lineWidth: 3,
      enableMouseTracking: false,
      dataLabels: {
        enabled: true,
        crop: false,
        overflow: "allow",
        align: "left",
        x: 8,
        y: 2,
        style: { fontSize: "14px", fontWeight: "600", textOutline: "none" },
        formatter: function () {
          return this.point.index === lastIdx ? this.series.name : null;
        },
      },
    },
  },
  series: [
    {
      name: "Bias²",
      data: asPairs(biasSquared),
      color: t.palette[0],
      dataLabels: { style: { color: t.palette[0] } },
    },
    {
      name: "Variance",
      data: asPairs(variance),
      color: t.palette[1],
      dataLabels: { style: { color: t.palette[1] } },
    },
    {
      name: "Irreducible Error",
      data: asPairs(irreducibleError),
      color: t.inkSoft,
      dashStyle: "Dash",
      lineWidth: 2,
      dataLabels: {
        style: { color: t.inkSoft },
        align: "left",
        x: 10,
        y: -10,
        formatter: function () {
          return this.point.index === 0 ? this.series.name : null;
        },
      },
    },
    {
      name: "Total Error",
      data: asPairs(totalError),
      color: t.ink,
      lineWidth: 4,
      zIndex: 3,
      dataLabels: { style: { color: t.ink } },
    },
    {
      type: "scatter",
      name: "Optimal complexity",
      data: [[optimalComplexity, totalError[optimalIdx]]],
      color: t.ink,
      marker: {
        enabled: true,
        symbol: "circle",
        radius: 7,
        fillColor: t.ink,
        lineColor: t.pageBg,
        lineWidth: 2,
      },
      dataLabels: { enabled: false },
      zIndex: 5,
    },
  ],
});
Runnable source as JSON, for any HTTP client: https://api.anyplot.ai/specs/curve-bias-variance-tradeoff/highcharts/code. Any spec id and library id listed in llms-full.txt fit the same URL shape; every URL below is complete and callable.
{
  "spec_id": "curve-bias-variance-tradeoff",
  "language": "javascript",
  "library": "highcharts",
  "page": "https://anyplot.ai/curve-bias-variance-tradeoff/javascript/highcharts",
  "hub": "https://anyplot.ai/curve-bias-variance-tradeoff",
  "code_json": "https://api.anyplot.ai/specs/curve-bias-variance-tradeoff/highcharts/code",
  "spec_json": "https://api.anyplot.ai/specs/curve-bias-variance-tradeoff",
  "render_light_png": "https://storage.googleapis.com/anyplot-images/plots/curve-bias-variance-tradeoff/javascript/highcharts/plot-light.png",
  "render_dark_png": "https://storage.googleapis.com/anyplot-images/plots/curve-bias-variance-tradeoff/javascript/highcharts/plot-dark.png",
  "interactive_light_html": "https://storage.googleapis.com/anyplot-images/plots/curve-bias-variance-tradeoff/javascript/highcharts/plot-light.html",
  "interactive_dark_html": "https://storage.googleapis.com/anyplot-images/plots/curve-bias-variance-tradeoff/javascript/highcharts/plot-dark.html",
  "quality_score": 91.0,
  "license": "MIT",
  "guide": "https://anyplot.ai/llms.txt"
}
Part of Bias-Variance Tradeoff Curve on anyplot.ai.