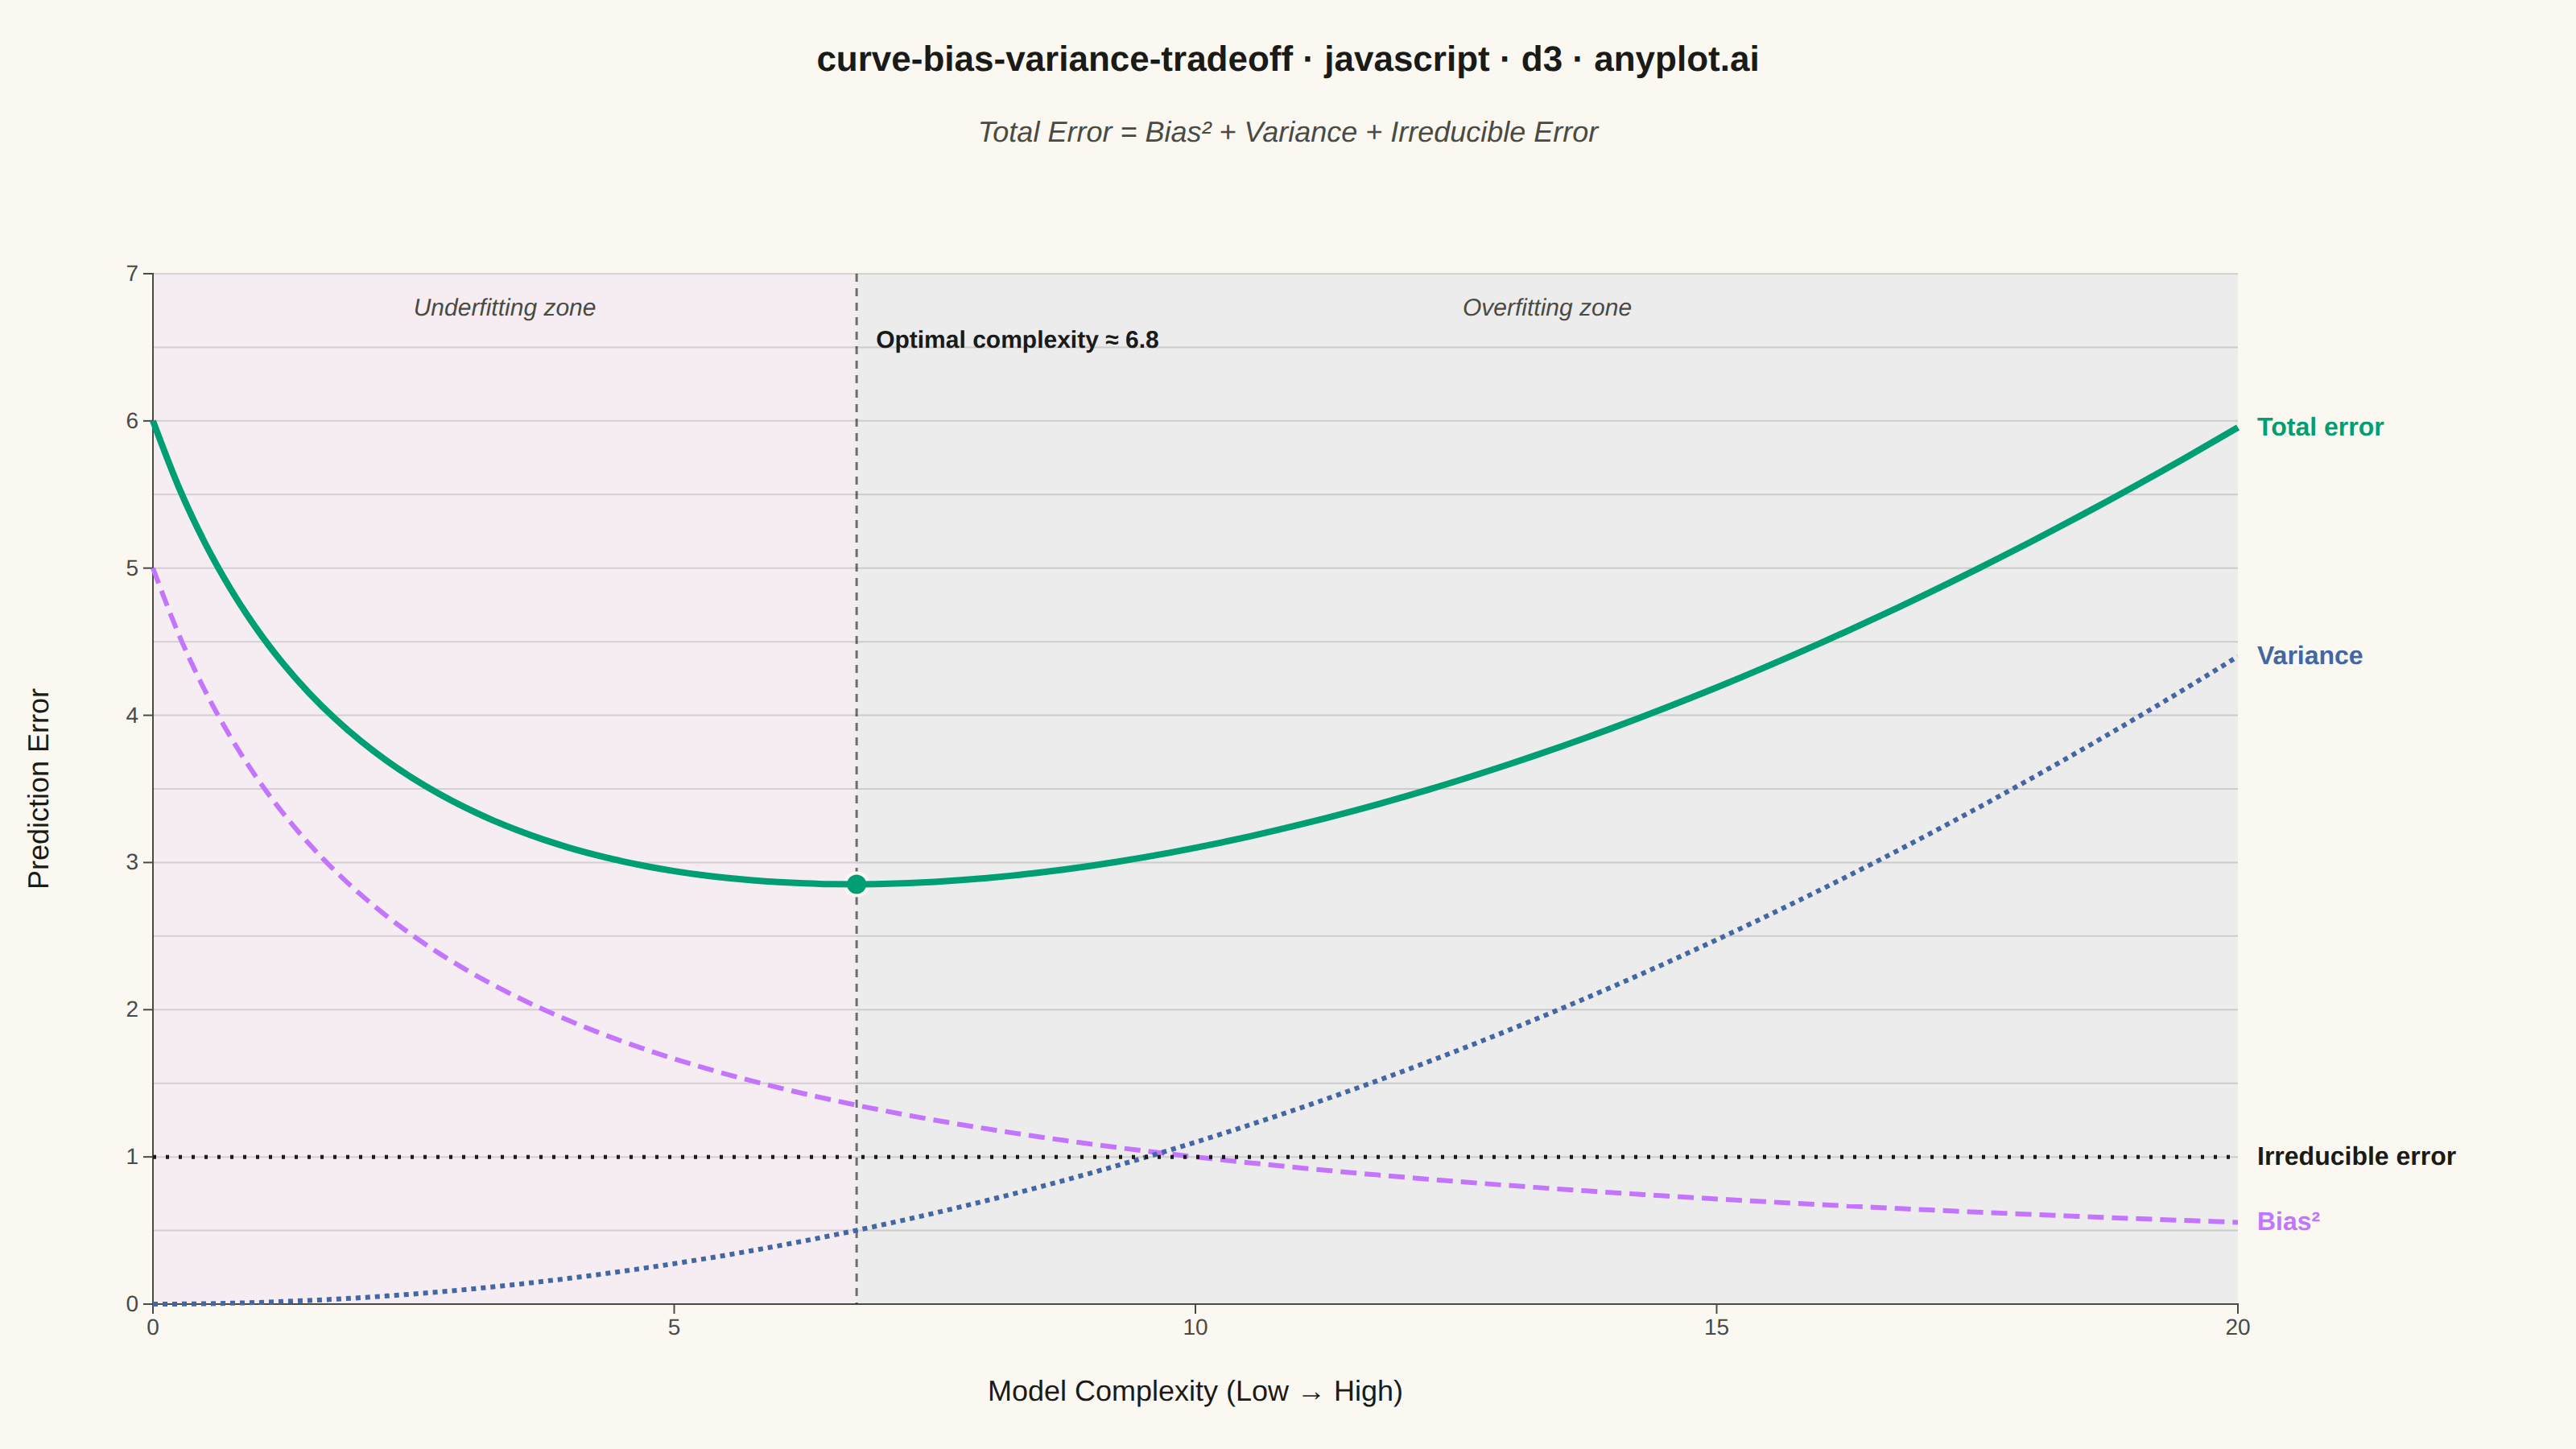
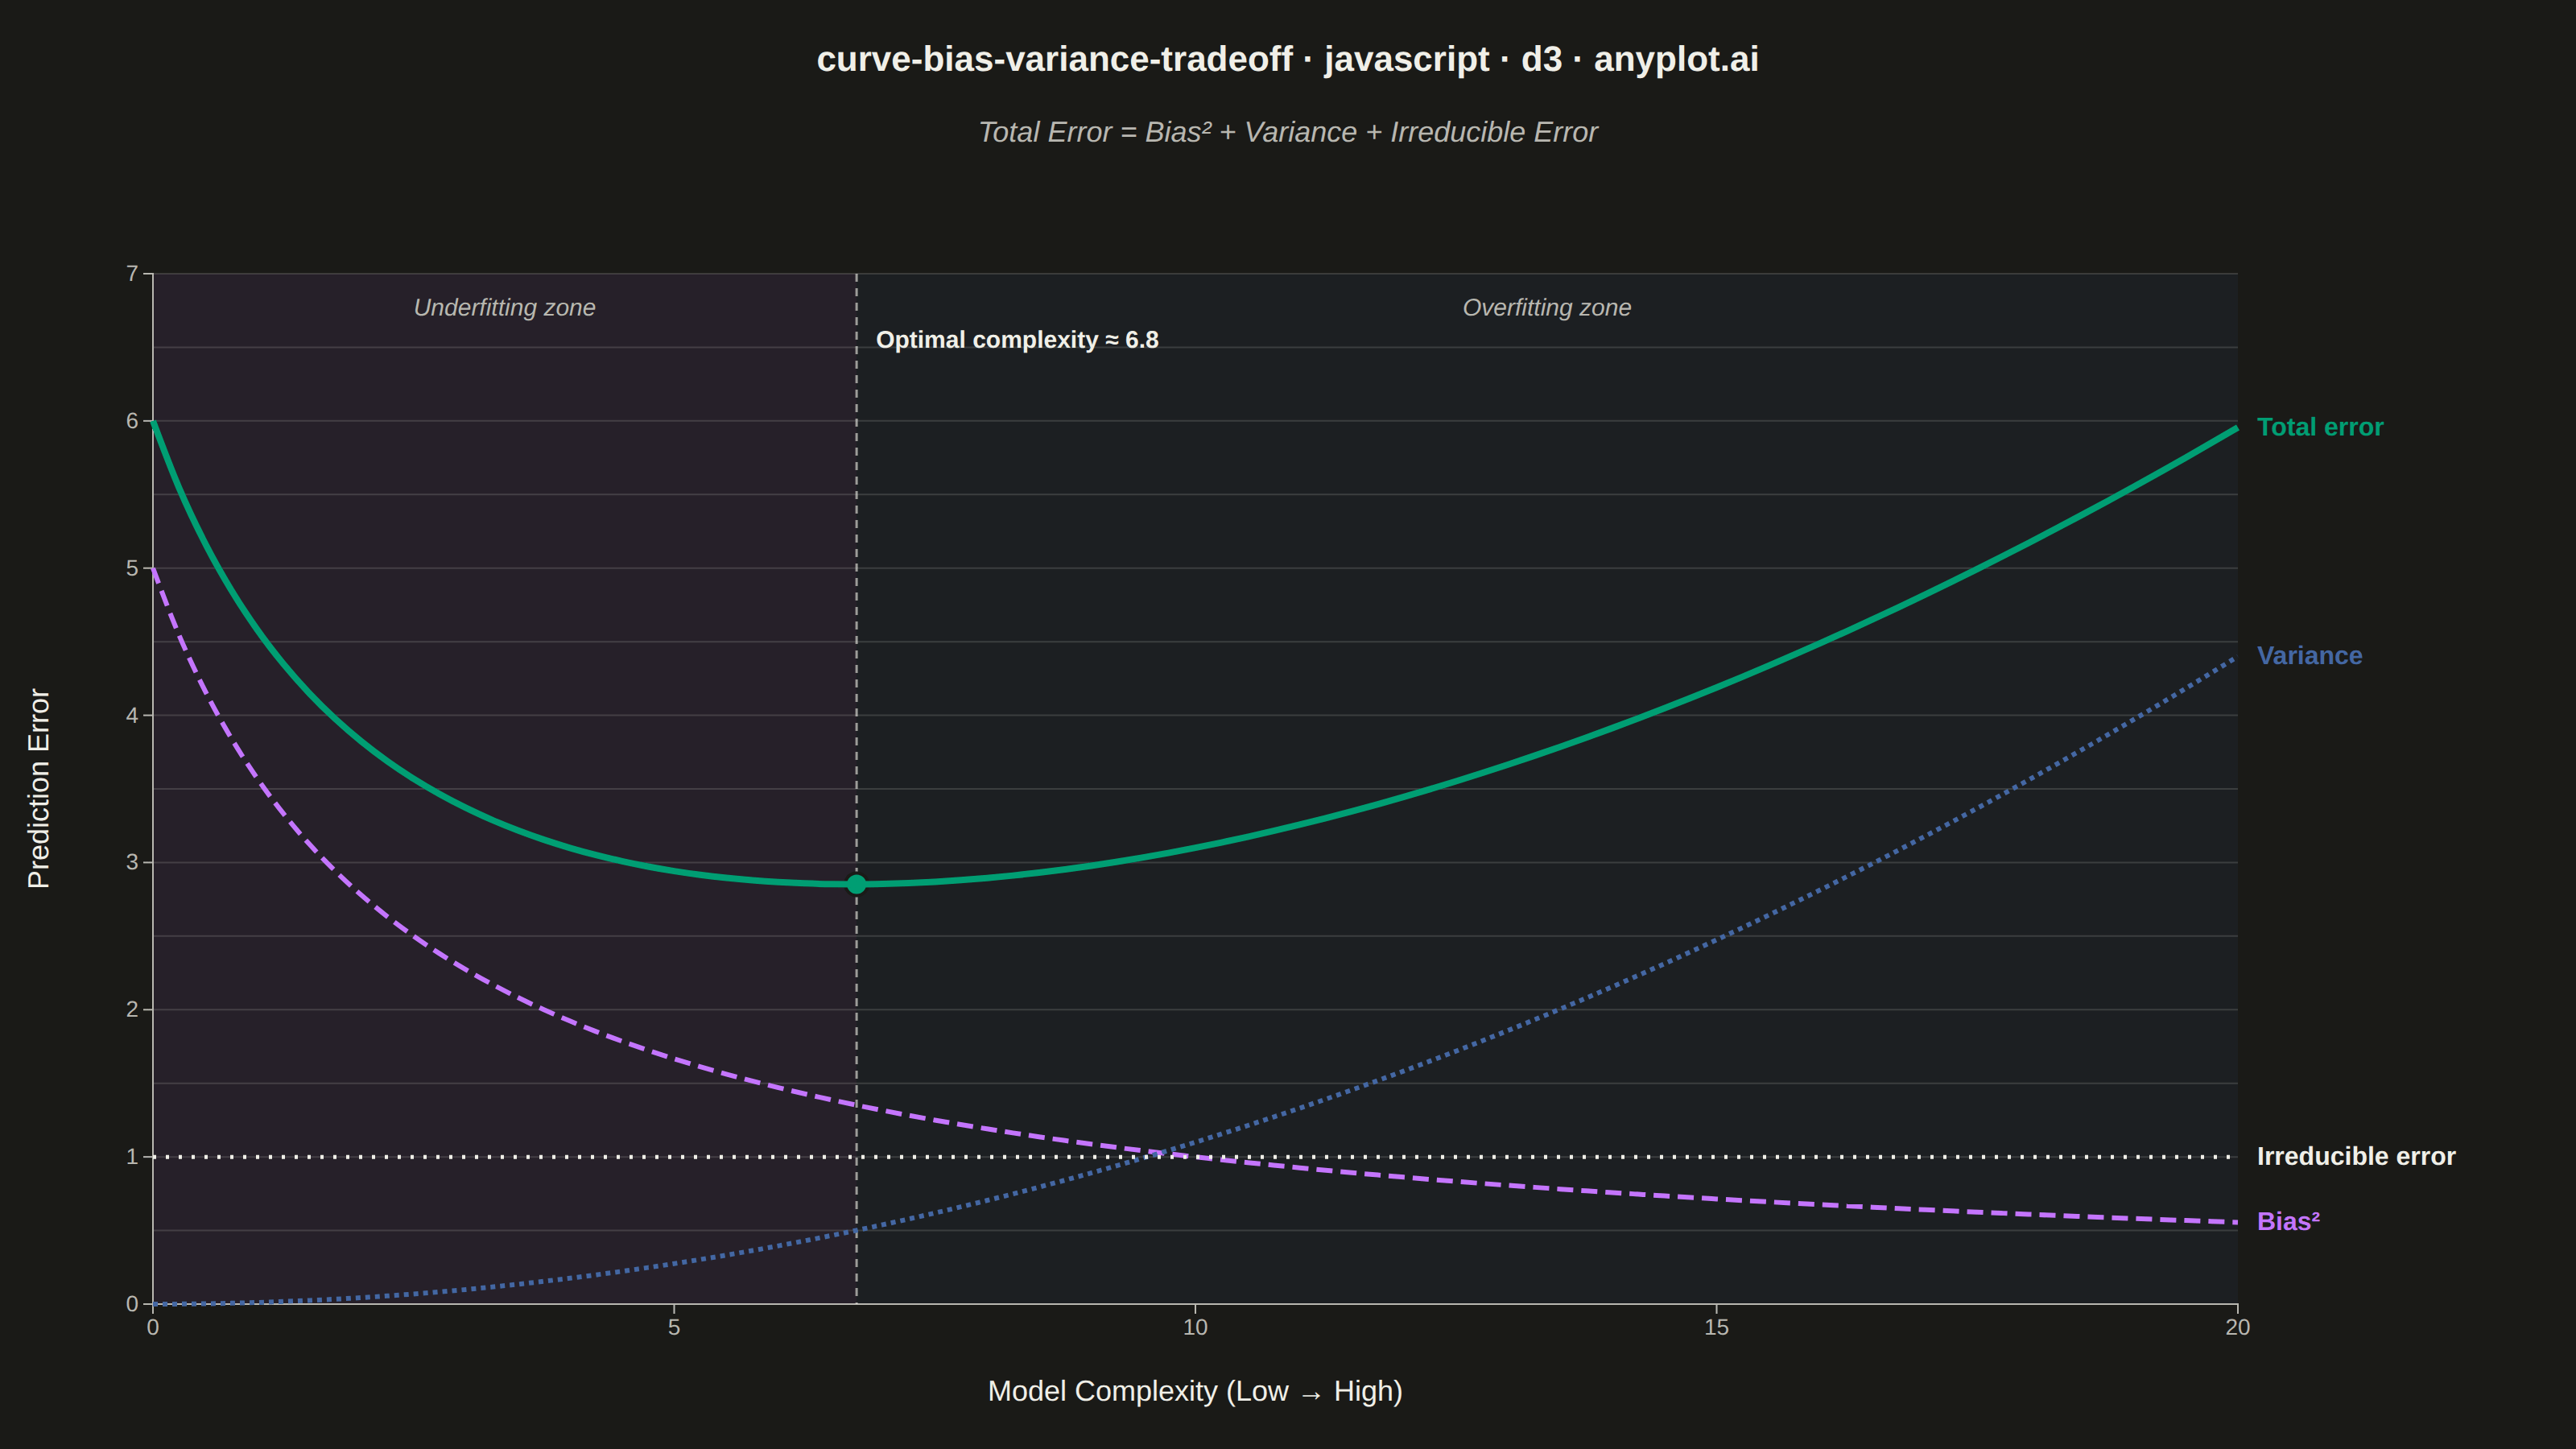
The same plot in 14 other libraries — JavaScript: Chart.js, Apache ECharts, Highcharts, MUI X Charts; Python: Altair, Bokeh, lets-plot, Matplotlib, Plotly, plotnine, Pygal, Seaborn; R: ggplot2; Julia: Makie.jl. Compare all 15 side by side: Bias-Variance Tradeoff Curve in Python, R, Julia and JavaScript.
A theoretical visualization of the bias-variance tradeoff showing how total prediction error decomposes into bias squared, variance, and irreducible noise as a function of model complexity. The plot displays multiple curves: bias squared (decreasing with complexity), variance (increasing with complexity), irreducible error (constant), and total error (U-shaped). This is one of the most fundamental conceptual plots in machine learning for understanding model selection, overfitting, and underfitting.
// anyplot.ai
// curve-bias-variance-tradeoff: Bias-Variance Tradeoff Curve
// Library: d3 7.9.0 | JavaScript 22.23.2
// Quality: 93/100 | Created: 2026-08-24

//# anyplot-orientation: landscape

const t = window.ANYPLOT_TOKENS;
const { width, height } = window.ANYPLOT_SIZE;
const margin = { top: 170, right: 210, bottom: 90, left: 95 };
const iw = width - margin.left - margin.right;
const ih = height - margin.top - margin.bottom;

// --- Data (theoretical decomposition, deterministic) -------------------------
const modelComplexity = d3.range(0, 20.001, 0.25);
const biasSquared = modelComplexity.map((c) => 5 / (1 + 0.4 * c));
const variance = modelComplexity.map((c) => 0.011 * c * c);
const irreducibleError = modelComplexity.map(() => 1.0);
const totalError = modelComplexity.map(
  (c, i) => biasSquared[i] + variance[i] + irreducibleError[i]
);

let optimalIdx = 0;
for (let i = 1; i < totalError.length; i++) {
  if (totalError[i] < totalError[optimalIdx]) optimalIdx = i;
}
const optimalComplexity = modelComplexity[optimalIdx];
const optimalError = totalError[optimalIdx];

// --- Scales --------------------------------------------------------------------
const x = d3.scaleLinear().domain([0, 20]).range([0, iw]);
const y = d3.scaleLinear().domain([0, d3.max(totalError) * 1.1]).nice().range([ih, 0]);

// --- SVG mount -------------------------------------------------------------------
const svg = d3.select("#container").append("svg").attr("width", width).attr("height", height);
const g = svg.append("g").attr("transform", `translate(${margin.left},${margin.top})`);

// --- Underfitting / overfitting zones (drawn first, behind everything) -----------
g.append("rect")
  .attr("x", 0).attr("y", 0)
  .attr("width", x(optimalComplexity)).attr("height", ih)
  .attr("fill", t.palette[1]).attr("opacity", 0.08);

g.append("rect")
  .attr("x", x(optimalComplexity)).attr("y", 0)
  .attr("width", iw - x(optimalComplexity)).attr("height", ih)
  .attr("fill", t.palette[2]).attr("opacity", 0.08);

g.append("text")
  .attr("x", x(optimalComplexity) / 2).attr("y", 26)
  .attr("text-anchor", "middle")
  .attr("fill", t.inkSoft).style("font-size", "15px").style("font-style", "italic")
  .text("Underfitting zone");

g.append("text")
  .attr("x", x(optimalComplexity) + (iw - x(optimalComplexity)) / 2).attr("y", 26)
  .attr("text-anchor", "middle")
  .attr("fill", t.inkSoft).style("font-size", "15px").style("font-style", "italic")
  .text("Overfitting zone");

// --- Y-axis grid (subtle, full-width) ---------------------------------------------
const grid = g.append("g").call(d3.axisLeft(y).tickSize(-iw).tickFormat(""));
grid.selectAll("line").attr("stroke", t.grid);
grid.select(".domain").remove();

// --- Axes ----------------------------------------------------------------------
const xAxis = g.append("g").attr("transform", `translate(0,${ih})`).call(d3.axisBottom(x).ticks(5));
const yAxis = g.append("g").call(d3.axisLeft(y).ticks(6));
for (const ax of [xAxis, yAxis]) {
  ax.selectAll("text").attr("fill", t.inkSoft).style("font-size", "14px");
  ax.selectAll("line").attr("stroke", t.inkSoft);
  ax.select(".domain").attr("stroke", t.inkSoft);
}

// --- Optimal-complexity marker ---------------------------------------------------
g.append("line")
  .attr("x1", x(optimalComplexity)).attr("x2", x(optimalComplexity))
  .attr("y1", 0).attr("y2", ih)
  .attr("stroke", t.ink).attr("stroke-width", 1.5)
  .attr("stroke-dasharray", "5,4").attr("opacity", 0.6);

g.append("circle")
  .attr("cx", x(optimalComplexity)).attr("cy", y(optimalError)).attr("r", 7)
  .attr("fill", t.palette[0]).attr("stroke", t.pageBg).attr("stroke-width", 2);

const optimalAnchor = optimalComplexity > 12 ? "end" : "start";
g.append("text")
  .attr("x", x(optimalComplexity) + (optimalAnchor === "end" ? -12 : 12)).attr("y", 46)
  .attr("text-anchor", optimalAnchor)
  .attr("fill", t.ink).style("font-size", "15px").style("font-weight", "600")
  .text(`Optimal complexity ≈ ${optimalComplexity.toFixed(1)}`);

// --- Curves ----------------------------------------------------------------------
const line = d3.line().x((d) => x(d.c)).y((d) => y(d.v)).curve(d3.curveMonotoneX);
const toSeries = (arr) => modelComplexity.map((c, i) => ({ c, v: arr[i] }));

const curves = [
  { label: "Bias²", data: toSeries(biasSquared), color: t.palette[1], width: 3, dash: "10,5" },
  { label: "Variance", data: toSeries(variance), color: t.palette[2], width: 3, dash: "3,3" },
  { label: "Irreducible error", data: toSeries(irreducibleError), color: t.ink, width: 2.5, dash: "2,6" },
  { label: "Total error", data: toSeries(totalError), color: t.palette[0], width: 4, dash: "none" },
];

for (const s of curves) {
  const path = g.append("path")
    .datum(s.data)
    .attr("fill", "none")
    .attr("stroke", s.color)
    .attr("stroke-width", s.width)
    .attr("d", line);
  if (s.dash !== "none") path.attr("stroke-dasharray", s.dash);
}

// --- Direct end-of-line labels (collision-avoided) --------------------------------
const endLabels = curves
  .map((s) => ({ label: s.label, color: s.color, y: y(s.data[s.data.length - 1].v) }))
  .sort((a, b) => a.y - b.y);

const minGap = 22;
for (let i = 1; i < endLabels.length; i++) {
  if (endLabels[i].y - endLabels[i - 1].y < minGap) {
    endLabels[i].y = endLabels[i - 1].y + minGap;
  }
}

g.selectAll(".end-label")
  .data(endLabels)
  .join("text")
  .attr("x", iw + 12).attr("y", (d) => d.y + 5)
  .attr("fill", (d) => d.color).style("font-size", "16px").style("font-weight", "600")
  .text((d) => d.label);

// --- Formula annotation -----------------------------------------------------------
svg.append("text")
  .attr("x", width / 2).attr("y", 88).attr("text-anchor", "middle")
  .attr("fill", t.inkSoft).style("font-size", "18px").style("font-style", "italic")
  .text("Total Error = Bias² + Variance + Irreducible Error");

// --- Axis labels -------------------------------------------------------------------
g.append("text")
  .attr("x", iw / 2).attr("y", ih + 60).attr("text-anchor", "middle")
  .attr("fill", t.ink).style("font-size", "18px")
  .text("Model Complexity (Low → High)");

g.append("text")
  .attr("transform", "rotate(-90)")
  .attr("x", -ih / 2).attr("y", -65).attr("text-anchor", "middle")
  .attr("fill", t.ink).style("font-size", "18px")
  .text("Prediction Error");

// --- Title ------------------------------------------------------------------------
const titleText = "curve-bias-variance-tradeoff · javascript · d3 · anyplot.ai";
const titleRatio = titleText.length > 67 ? 67 / titleText.length : 1;
const titleFontSize = Math.round(22 * titleRatio);
svg.append("text")
  .attr("x", width / 2).attr("y", 44).attr("text-anchor", "middle")
  .attr("fill", t.ink).style("font-size", `${titleFontSize}px`).style("font-weight", "600")
  .text(titleText);
Runnable source as JSON, for any HTTP client: https://api.anyplot.ai/specs/curve-bias-variance-tradeoff/d3/code. Any spec id and library id listed in llms-full.txt fit the same URL shape; every URL below is complete and callable.
{
  "spec_id": "curve-bias-variance-tradeoff",
  "language": "javascript",
  "library": "d3",
  "page": "https://anyplot.ai/curve-bias-variance-tradeoff/javascript/d3",
  "hub": "https://anyplot.ai/curve-bias-variance-tradeoff",
  "code_json": "https://api.anyplot.ai/specs/curve-bias-variance-tradeoff/d3/code",
  "spec_json": "https://api.anyplot.ai/specs/curve-bias-variance-tradeoff",
  "render_light_png": "https://storage.googleapis.com/anyplot-images/plots/curve-bias-variance-tradeoff/javascript/d3/plot-light.png",
  "render_dark_png": "https://storage.googleapis.com/anyplot-images/plots/curve-bias-variance-tradeoff/javascript/d3/plot-dark.png",
  "interactive_light_html": "https://storage.googleapis.com/anyplot-images/plots/curve-bias-variance-tradeoff/javascript/d3/plot-light.html",
  "interactive_dark_html": "https://storage.googleapis.com/anyplot-images/plots/curve-bias-variance-tradeoff/javascript/d3/plot-dark.html",
  "quality_score": 93.0,
  "license": "MIT",
  "guide": "https://anyplot.ai/llms.txt"
}
Part of Bias-Variance Tradeoff Curve on anyplot.ai.