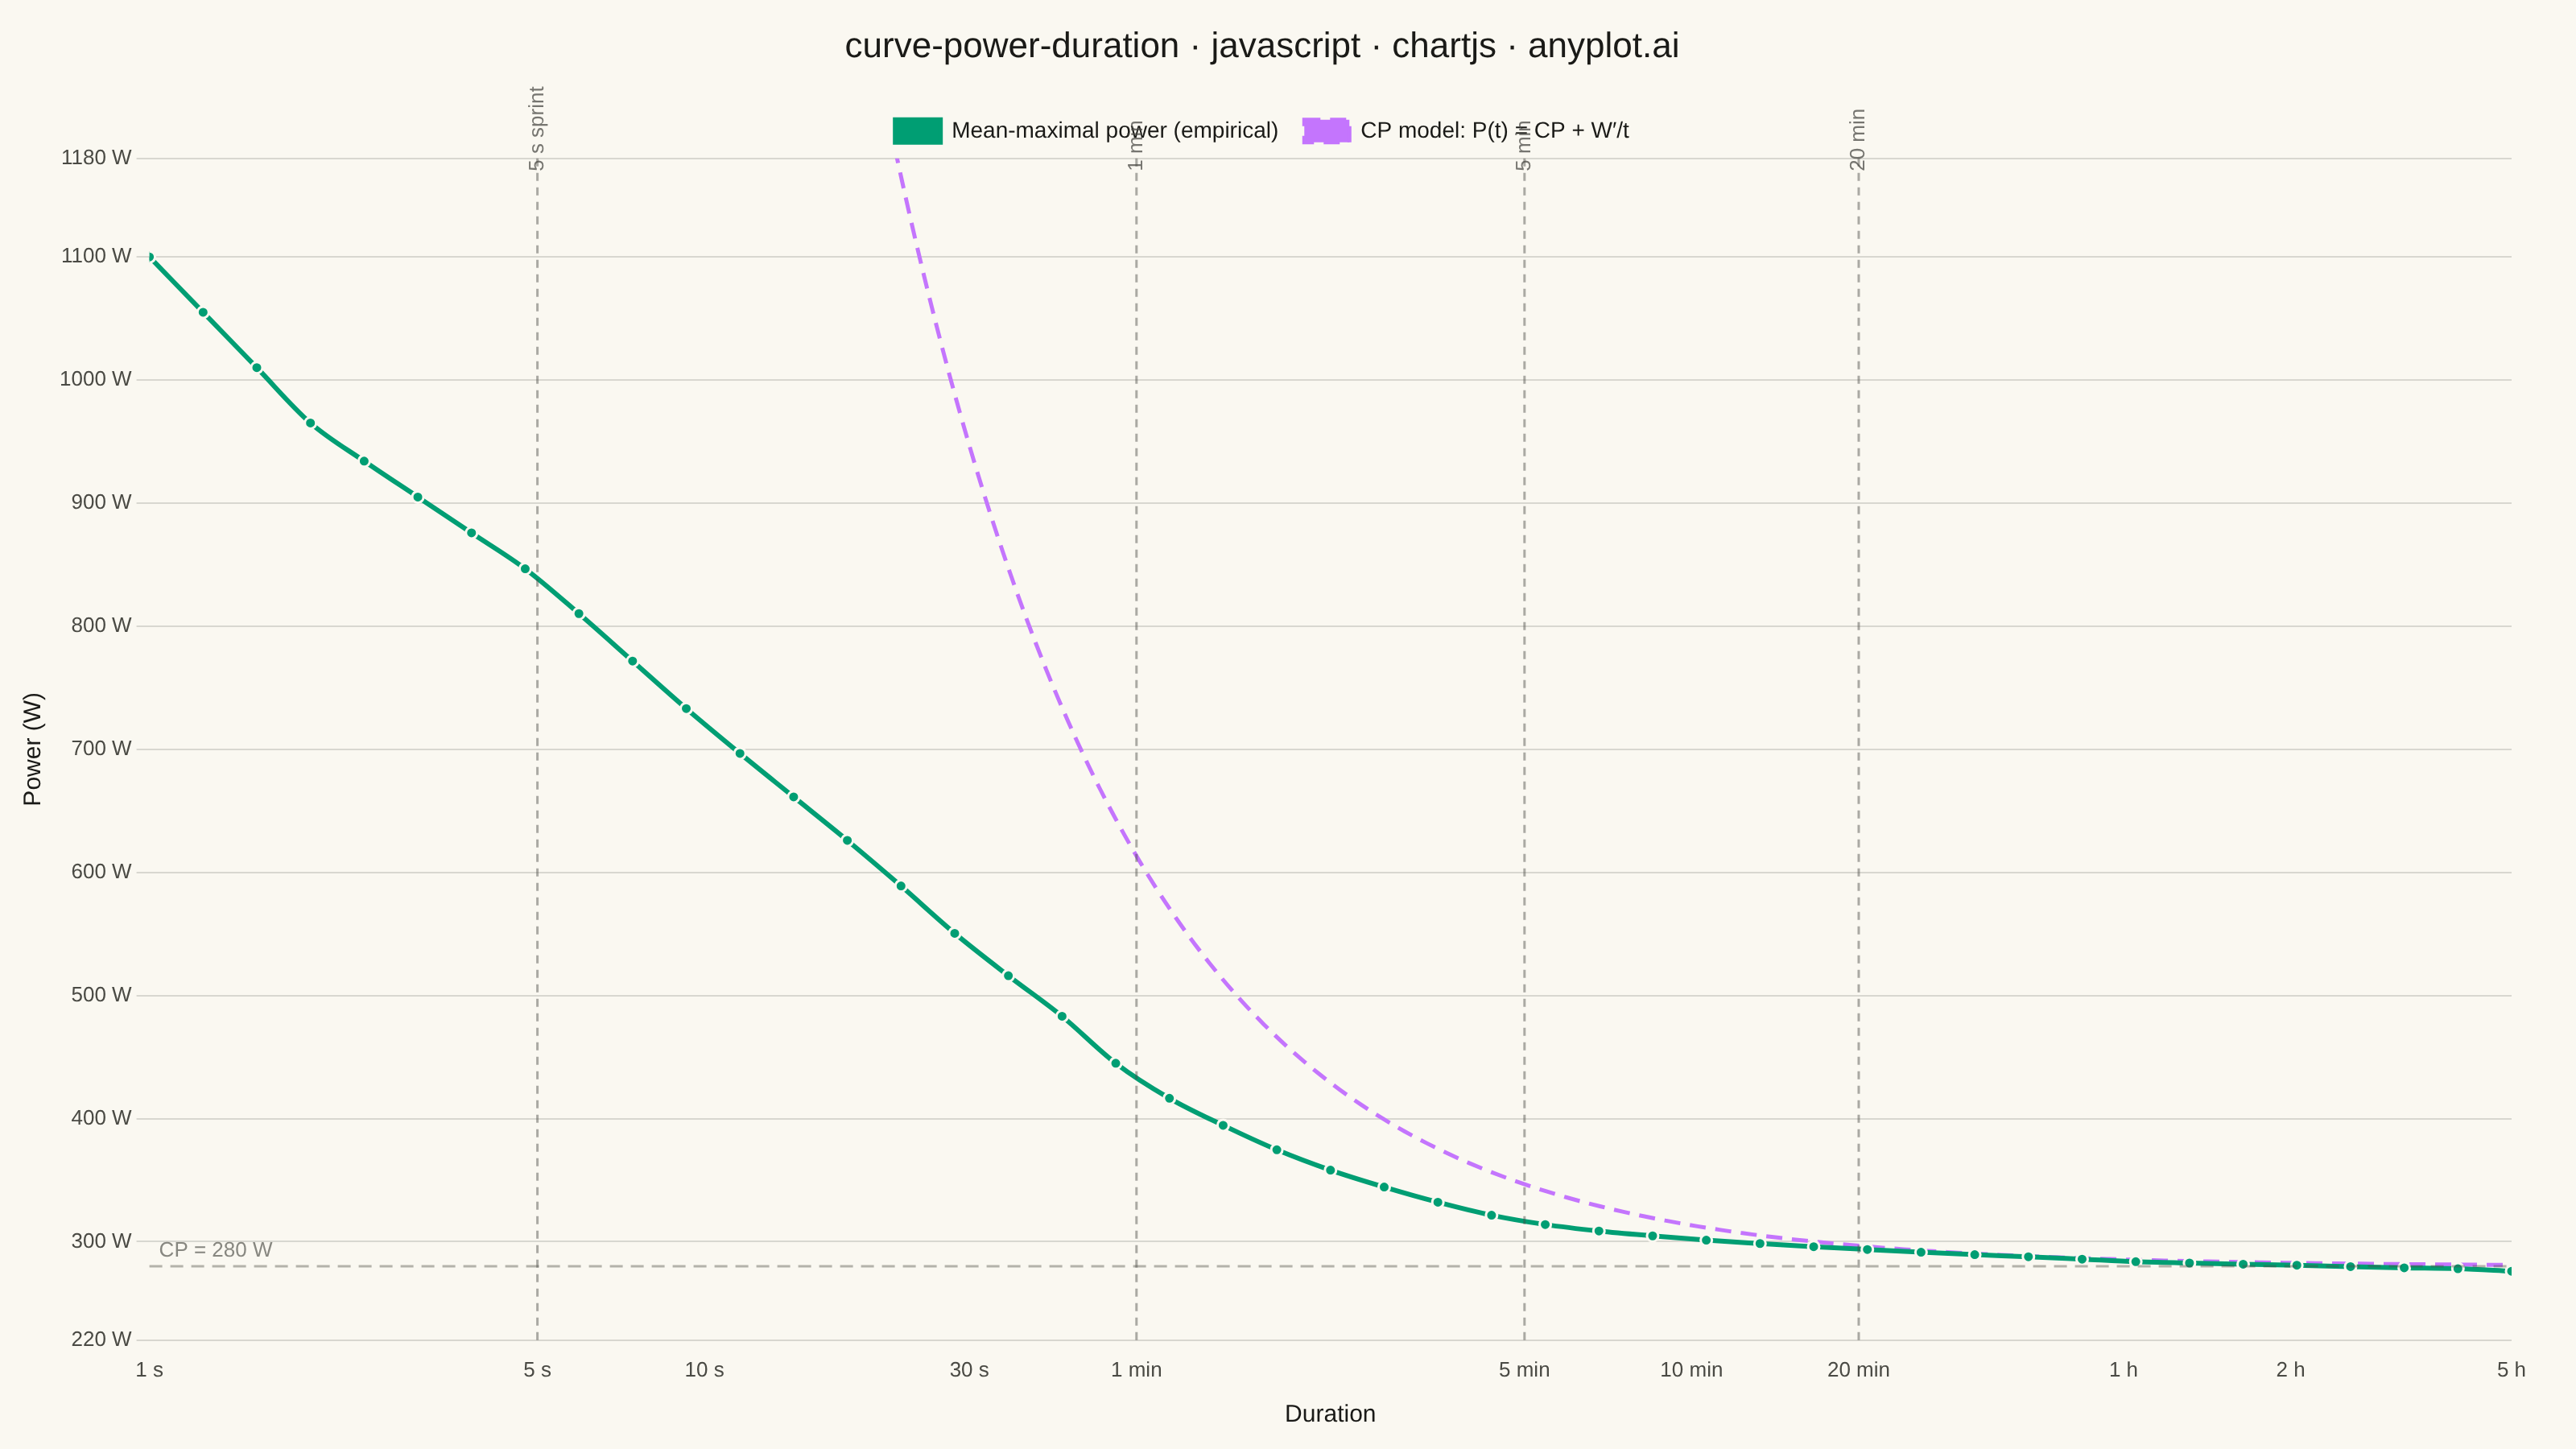
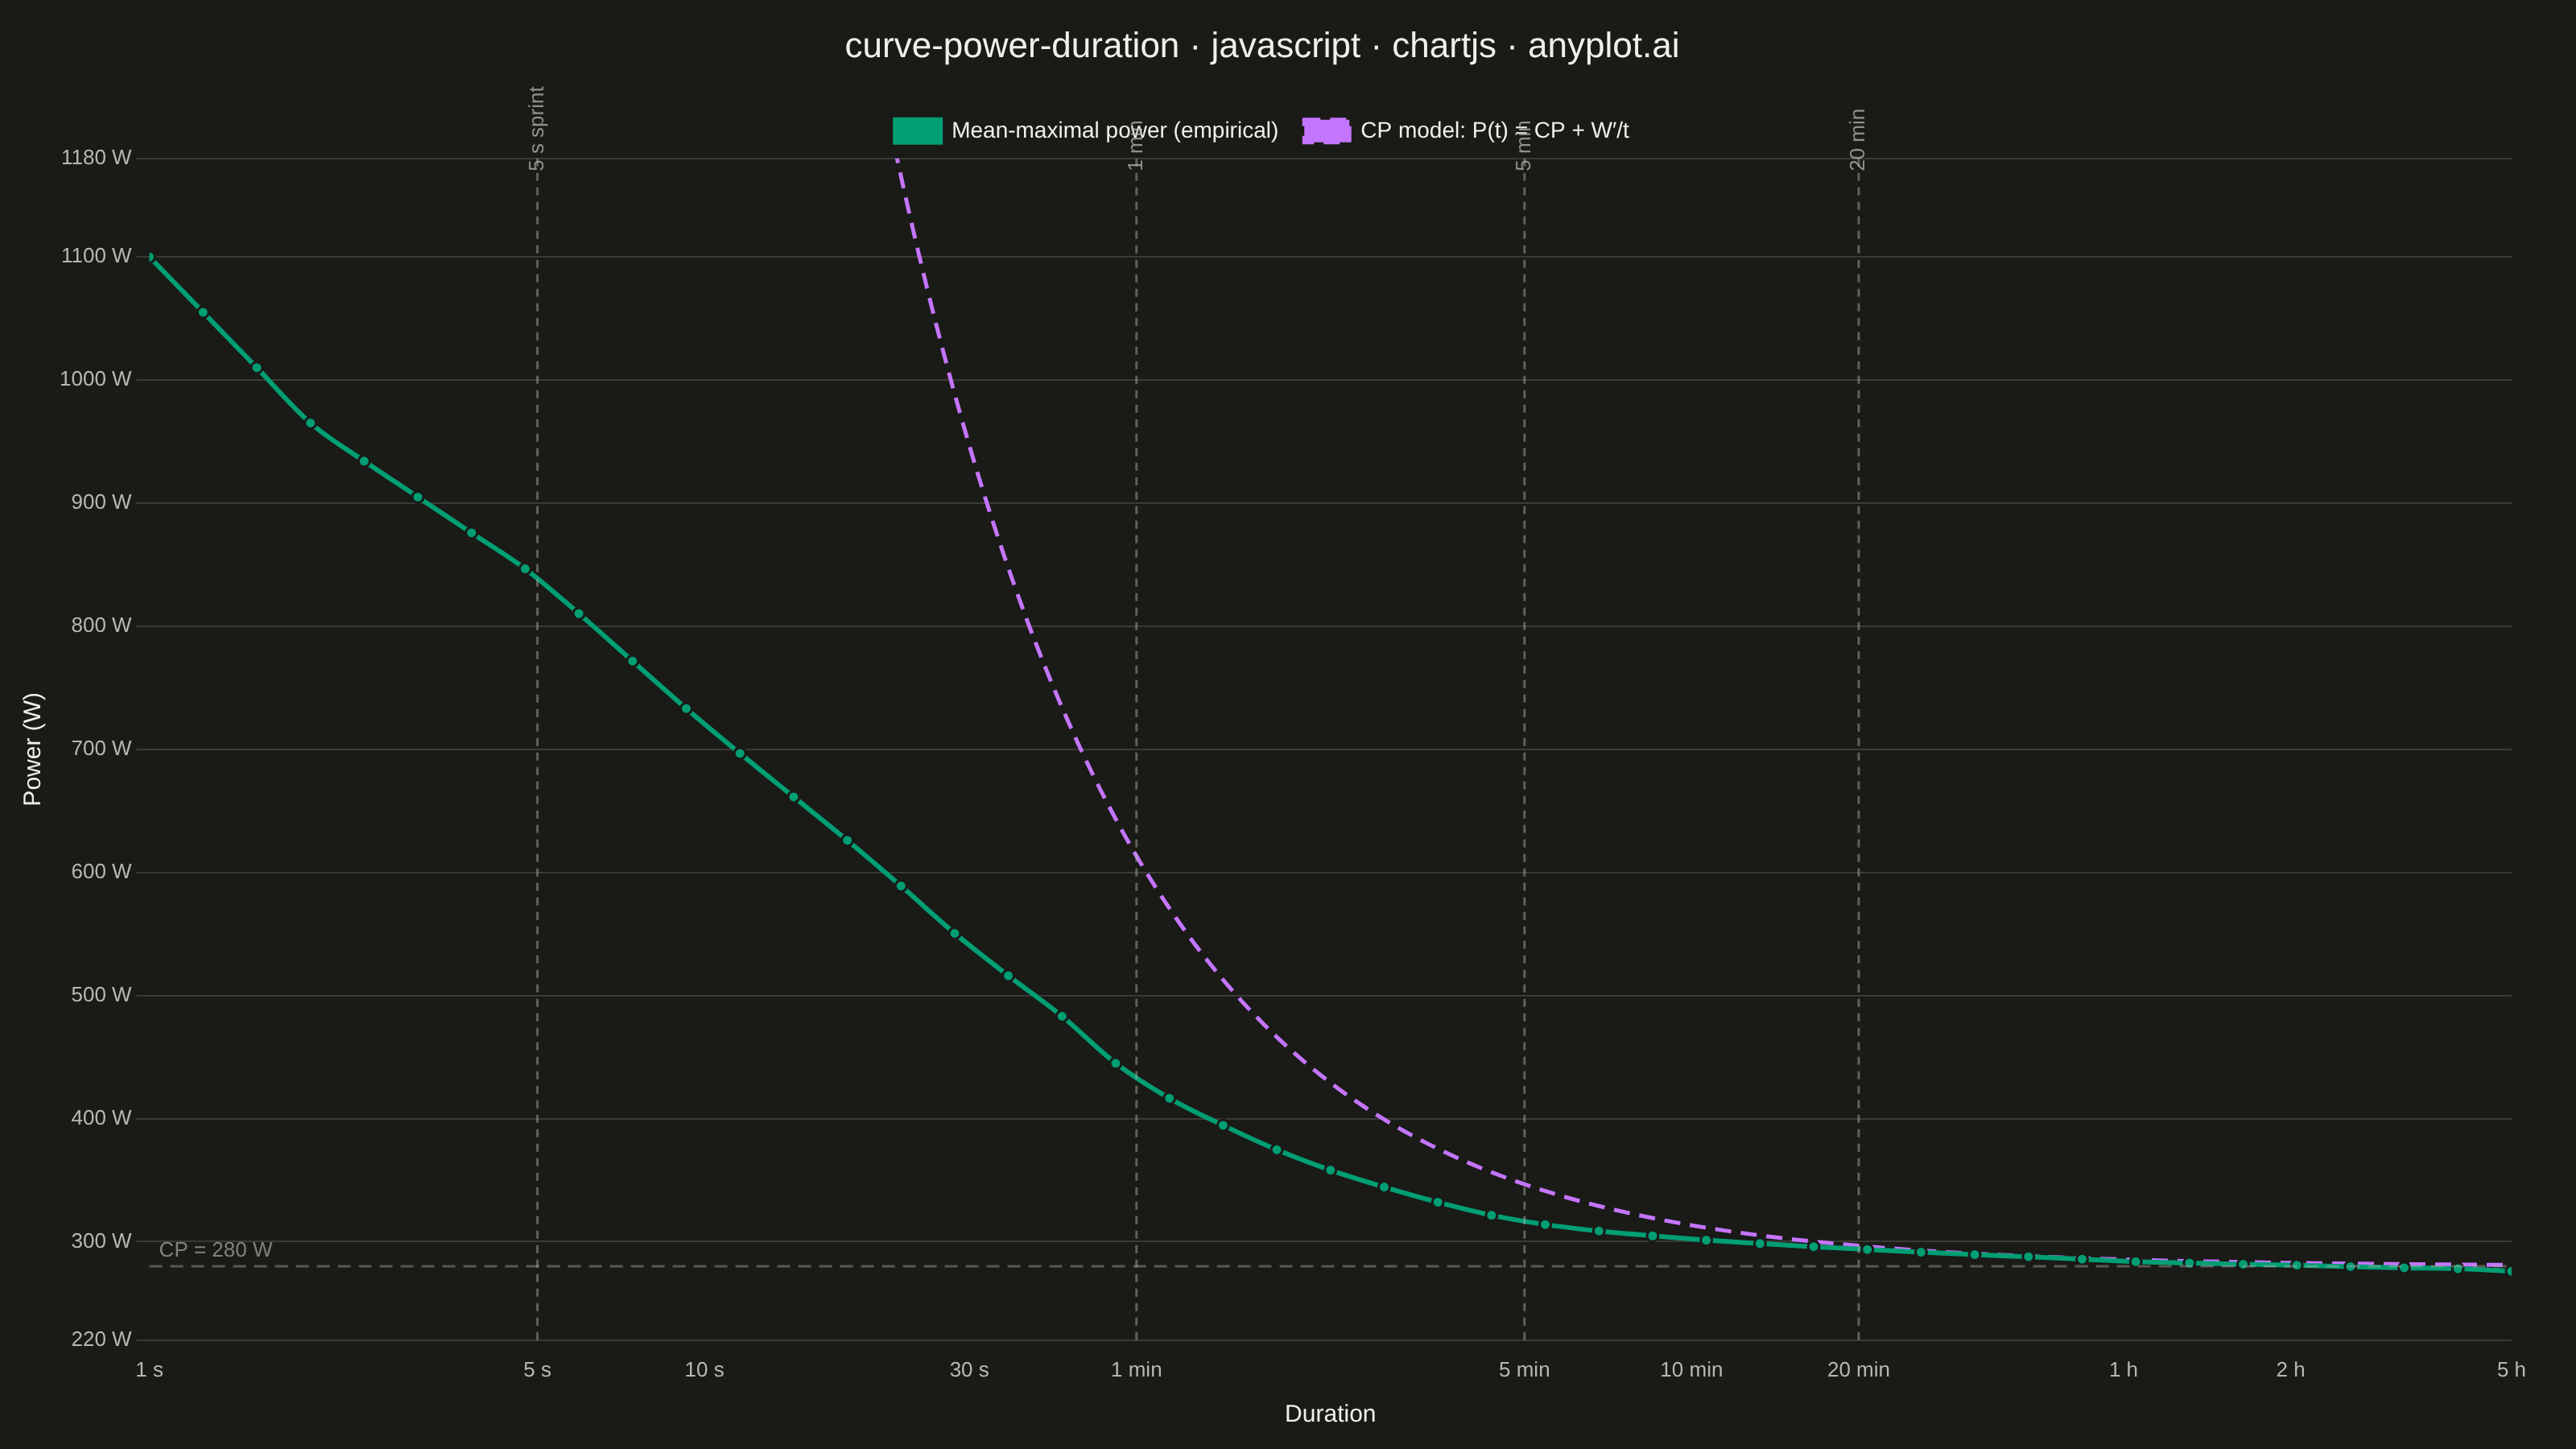
A power duration curve plots an athlete's best mean-maximal power output (watts) against effort duration on a logarithmic time axis spanning roughly 1 second to several hours. Each point answers "what is the highest average power this rider could sustain for exactly this long?", producing a characteristic monotonically decreasing decay curve. A critical power (CP) model is fitted and overlaid, decomposing performance into an aerobic asymptote (CP) and a finite anaerobic work capacity (W′). The chart is a cornerstone of cycling and endurance sports analytics for profiling rider strengths, tracking fitness, and setting training zones.
// anyplot.ai
// curve-power-duration: Mean-Maximal Power Duration Curve
// Library: chartjs 4.4.7 | JavaScript 22.22.3
// Quality: 92/100 | Created: 2026-06-13

//# anyplot-orientation: landscape

const tokens = window.ANYPLOT_TOKENS;

// --- Data -------------------------------------------------------------------
const CP = 280;         // Critical power (W) — aerobic asymptote
const W_PRIME = 20000;  // Anaerobic work capacity (J)

// Key empirical data for a well-trained cyclist (CP ≈ 280 W, W′ ≈ 20 000 J)
// Monotonically non-increasing mean-maximal power at each duration
const KEY_PD = [
  [1, 1100], [2, 960], [5, 840], [10, 720],
  [20, 610], [30, 540], [45, 480], [60, 430],
  [90, 390], [120, 365], [180, 340], [240, 325],
  [300, 316], [420, 308], [600, 302], [900, 297],
  [1200, 294], [1800, 290], [2700, 287], [3600, 284],
  [5400, 282], [7200, 281], [10800, 279], [14400, 278], [18000, 276],
];

// Interpolate empirical power at duration t using log-space linear interpolation
function empPower(t) {
  const logT = Math.log10(t);
  for (let i = 0; i < KEY_PD.length - 1; i++) {
    const [t0, p0] = KEY_PD[i];
    const [t1, p1] = KEY_PD[i + 1];
    if (t >= t0 && t <= t1) {
      const alpha = (logT - Math.log10(t0)) / (Math.log10(t1) - Math.log10(t0));
      return p0 + (p1 - p0) * alpha;
    }
  }
  return t < KEY_PD[0][0] ? KEY_PD[0][1] : KEY_PD[KEY_PD.length - 1][1];
}

// Generate n log-spaced values from lo to hi
function logspace(n, lo, hi) {
  return Array.from({ length: n }, (_, i) =>
    Math.pow(10, Math.log10(lo) + (Math.log10(hi) - Math.log10(lo)) * i / (n - 1))
  );
}

// 45 log-spaced durations for the empirical curve
const empiricalData = logspace(45, 1, 18000).map(d => ({ x: d, y: empPower(d) }));

// CP model P(t) = CP + W′/t — starts at t ≈ 22 s where it enters the visible y range
const modelData = logspace(150, 22, 18000).map(d => ({ x: d, y: CP + W_PRIME / d }));

// Reference durations for vertical annotation markers
const REF_MARKS = [
  { t: 5,    label: '5 s sprint' },
  { t: 60,   label: '1 min'      },
  { t: 300,  label: '5 min'      },
  { t: 1200, label: '20 min'     },
];

// --- Mount ------------------------------------------------------------------
const canvas = document.createElement('canvas');
document.getElementById('container').appendChild(canvas);

// --- Annotation plugin: reference lines + CP asymptote ---------------------
const annotPlugin = {
  id: 'pdAnnotations',
  afterDraw(chart) {
    const ctx = chart.ctx;
    const { left, right, top, bottom } = chart.chartArea;
    const xScale = chart.scales.x;
    const yScale = chart.scales.y;

    // Vertical dashed reference duration lines with rotated labels
    REF_MARKS.forEach(({ t: tVal, label }) => {
      const px = xScale.getPixelForValue(tVal);
      if (px < left || px > right) return;

      ctx.save();
      ctx.strokeStyle = tokens.inkSoft;
      ctx.lineWidth = 1.5;
      ctx.setLineDash([5, 4]);
      ctx.globalAlpha = 0.45;
      ctx.beginPath();
      ctx.moveTo(px, top);
      ctx.lineTo(px, bottom);
      ctx.stroke();
      ctx.restore();

      // Rotated label drawn inside the chart area near the top
      ctx.save();
      ctx.translate(px, top + 8);
      ctx.rotate(-Math.PI / 2);
      ctx.font = '13px "Inter", "Helvetica Neue", sans-serif';
      ctx.fillStyle = tokens.inkSoft;
      ctx.textAlign = 'left';
      ctx.textBaseline = 'middle';
      ctx.globalAlpha = 0.75;
      ctx.fillText(label, 0, 0);
      ctx.restore();
    });

    // Horizontal CP asymptote at 280 W
    const cpPy = yScale.getPixelForValue(CP);
    ctx.save();
    ctx.strokeStyle = tokens.inkSoft;
    ctx.lineWidth = 1.5;
    ctx.setLineDash([8, 5]);
    ctx.globalAlpha = 0.4;
    ctx.beginPath();
    ctx.moveTo(left, cpPy);
    ctx.lineTo(right, cpPy);
    ctx.stroke();

    ctx.globalAlpha = 0.65;
    ctx.font = '13px "Inter", "Helvetica Neue", sans-serif';
    ctx.fillStyle = tokens.inkSoft;
    ctx.textAlign = 'left';
    ctx.textBaseline = 'bottom';
    ctx.fillText(`CP = ${CP} W`, left + 6, cpPy - 3);
    ctx.restore();
  },
};

// --- Chart ------------------------------------------------------------------
new Chart(canvas, {
  type: 'scatter',
  data: {
    datasets: [
      {
        label: 'Mean-maximal power (empirical)',
        data: empiricalData,
        showLine: true,
        fill: false,
        borderColor: tokens.palette[0],
        backgroundColor: tokens.palette[0],
        borderWidth: 3,
        pointRadius: 3.5,
        pointHoverRadius: 6,
        pointBackgroundColor: tokens.palette[0],
        pointBorderColor: tokens.pageBg,
        pointBorderWidth: 1.5,
        cubicInterpolationMode: 'monotone',
      },
      {
        label: 'CP model: P(t) = CP + W′/t',
        data: modelData,
        showLine: true,
        fill: false,
        borderColor: tokens.palette[1],
        backgroundColor: tokens.palette[1],
        borderWidth: 2.5,
        borderDash: [10, 6],
        pointRadius: 0,
        cubicInterpolationMode: 'monotone',
      },
    ],
  },
  options: {
    responsive: true,
    maintainAspectRatio: false,
    animation: false,
    layout: {
      padding: { top: 12, right: 40, bottom: 8, left: 8 },
    },
    plugins: {
      title: {
        display: true,
        text: 'curve-power-duration · javascript · chartjs · anyplot.ai',
        color: tokens.ink,
        font: { size: 22, weight: '500' },
        padding: { top: 4, bottom: 16 },
      },
      legend: {
        labels: {
          color: tokens.ink,
          font: { size: 14 },
          boxWidth: 28,
          padding: 16,
        },
      },
    },
    scales: {
      x: {
        type: 'logarithmic',
        min: 1,
        max: 18000,
        title: {
          display: true,
          text: 'Duration',
          color: tokens.ink,
          font: { size: 15, weight: '500' },
          padding: { top: 8 },
        },
        afterBuildTicks(axis) {
          axis.ticks = [1, 5, 10, 30, 60, 300, 600, 1200, 3600, 7200, 18000]
            .map(v => ({ value: v }));
        },
        ticks: {
          color: tokens.inkSoft,
          font: { size: 13 },
          callback(value) {
            const MAP = {
              1: '1 s', 5: '5 s', 10: '10 s', 30: '30 s',
              60: '1 min', 300: '5 min', 600: '10 min',
              1200: '20 min', 3600: '1 h', 7200: '2 h',
              18000: '5 h',
            };
            return MAP[Math.round(value)] || null;
          },
        },
        border: { display: false },
        grid: { display: false },
      },
      y: {
        type: 'linear',
        min: 220,
        max: 1180,
        title: {
          display: true,
          text: 'Power (W)',
          color: tokens.ink,
          font: { size: 15, weight: '500' },
          padding: { right: 8 },
        },
        ticks: {
          color: tokens.inkSoft,
          font: { size: 13 },
          stepSize: 100,
          callback(value) {
            return `${value} W`;
          },
        },
        border: { display: false },
        grid: { color: tokens.grid },
      },
    },
  },
  plugins: [annotPlugin],
});
Runnable source as JSON, for any HTTP client: https://api.anyplot.ai/specs/curve-power-duration/chartjs/code. Any spec id and library id listed in llms-full.txt fit the same URL shape; every URL below is complete and callable.
{
  "spec_id": "curve-power-duration",
  "language": "javascript",
  "library": "chartjs",
  "page": "https://anyplot.ai/curve-power-duration/javascript/chartjs",
  "hub": "https://anyplot.ai/curve-power-duration",
  "code_json": "https://api.anyplot.ai/specs/curve-power-duration/chartjs/code",
  "spec_json": "https://api.anyplot.ai/specs/curve-power-duration",
  "render_light_png": "https://storage.googleapis.com/anyplot-images/plots/curve-power-duration/javascript/chartjs/plot-light.png",
  "render_dark_png": "https://storage.googleapis.com/anyplot-images/plots/curve-power-duration/javascript/chartjs/plot-dark.png",
  "interactive_light_html": "https://storage.googleapis.com/anyplot-images/plots/curve-power-duration/javascript/chartjs/plot-light.html",
  "interactive_dark_html": "https://storage.googleapis.com/anyplot-images/plots/curve-power-duration/javascript/chartjs/plot-dark.html",
  "quality_score": 92.0,
  "license": "MIT",
  "guide": "https://anyplot.ai/llms.txt"
}
Part of Mean-Maximal Power Duration Curve on anyplot.ai.