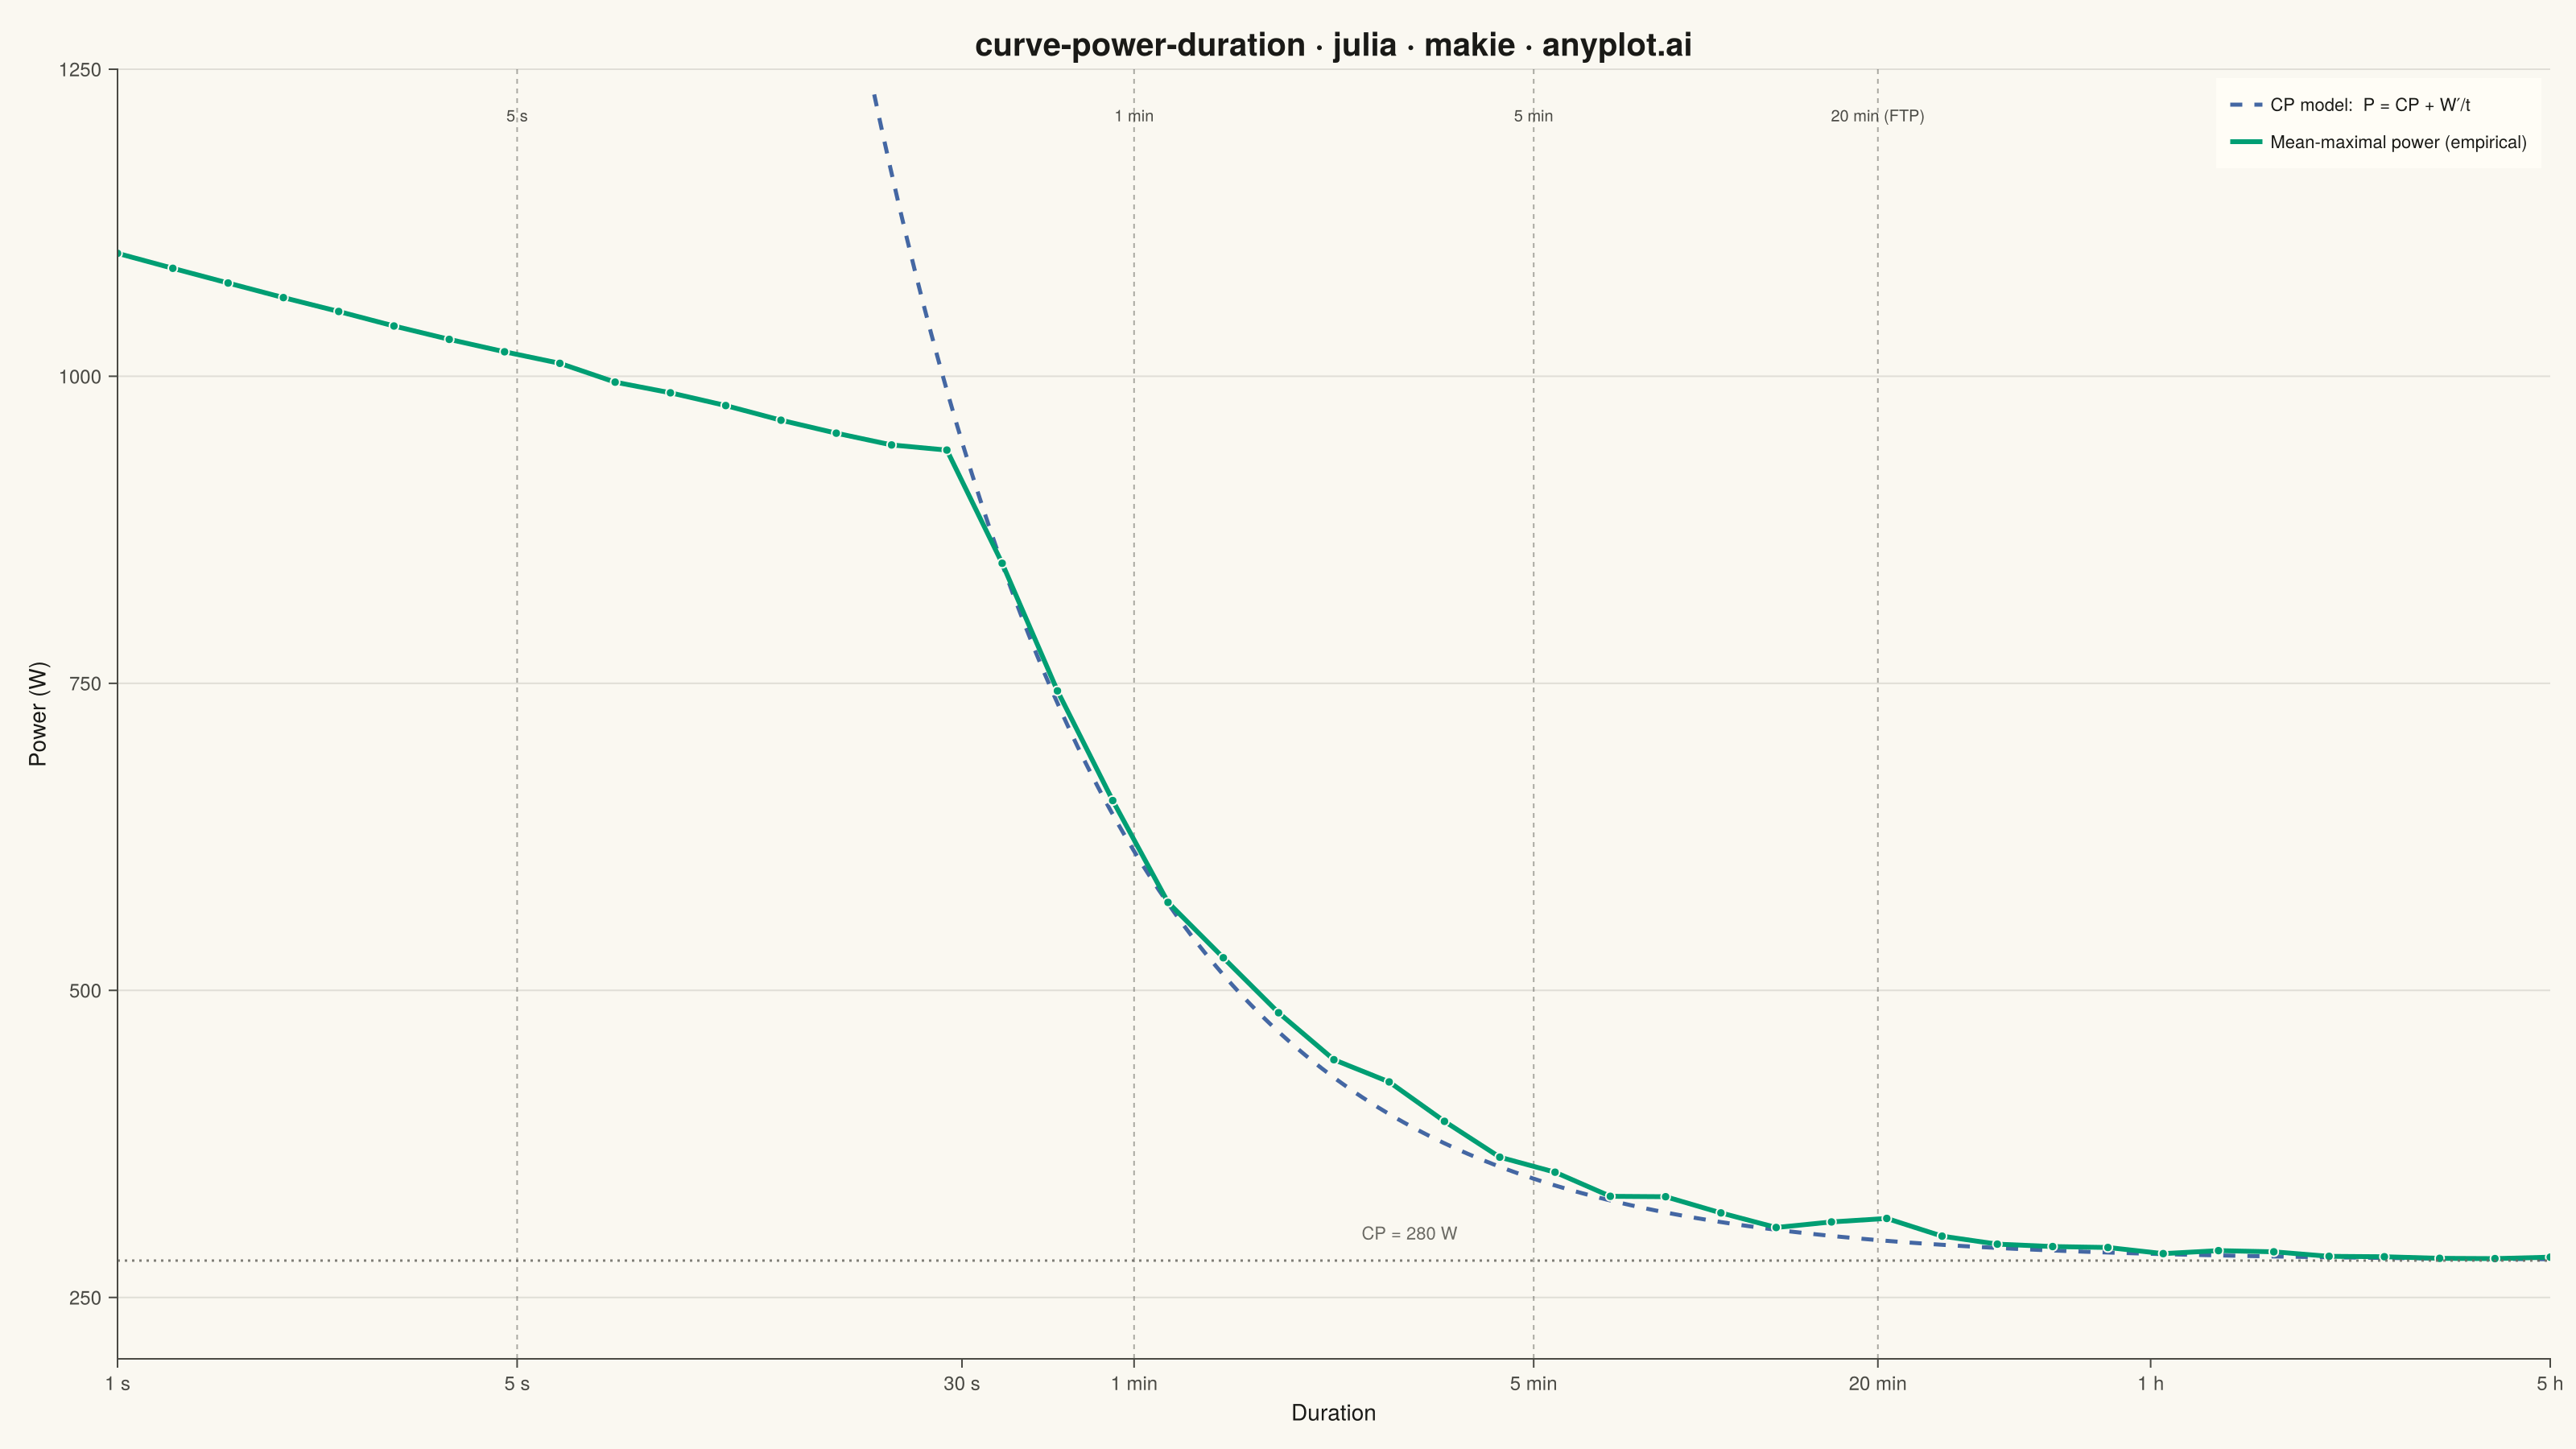
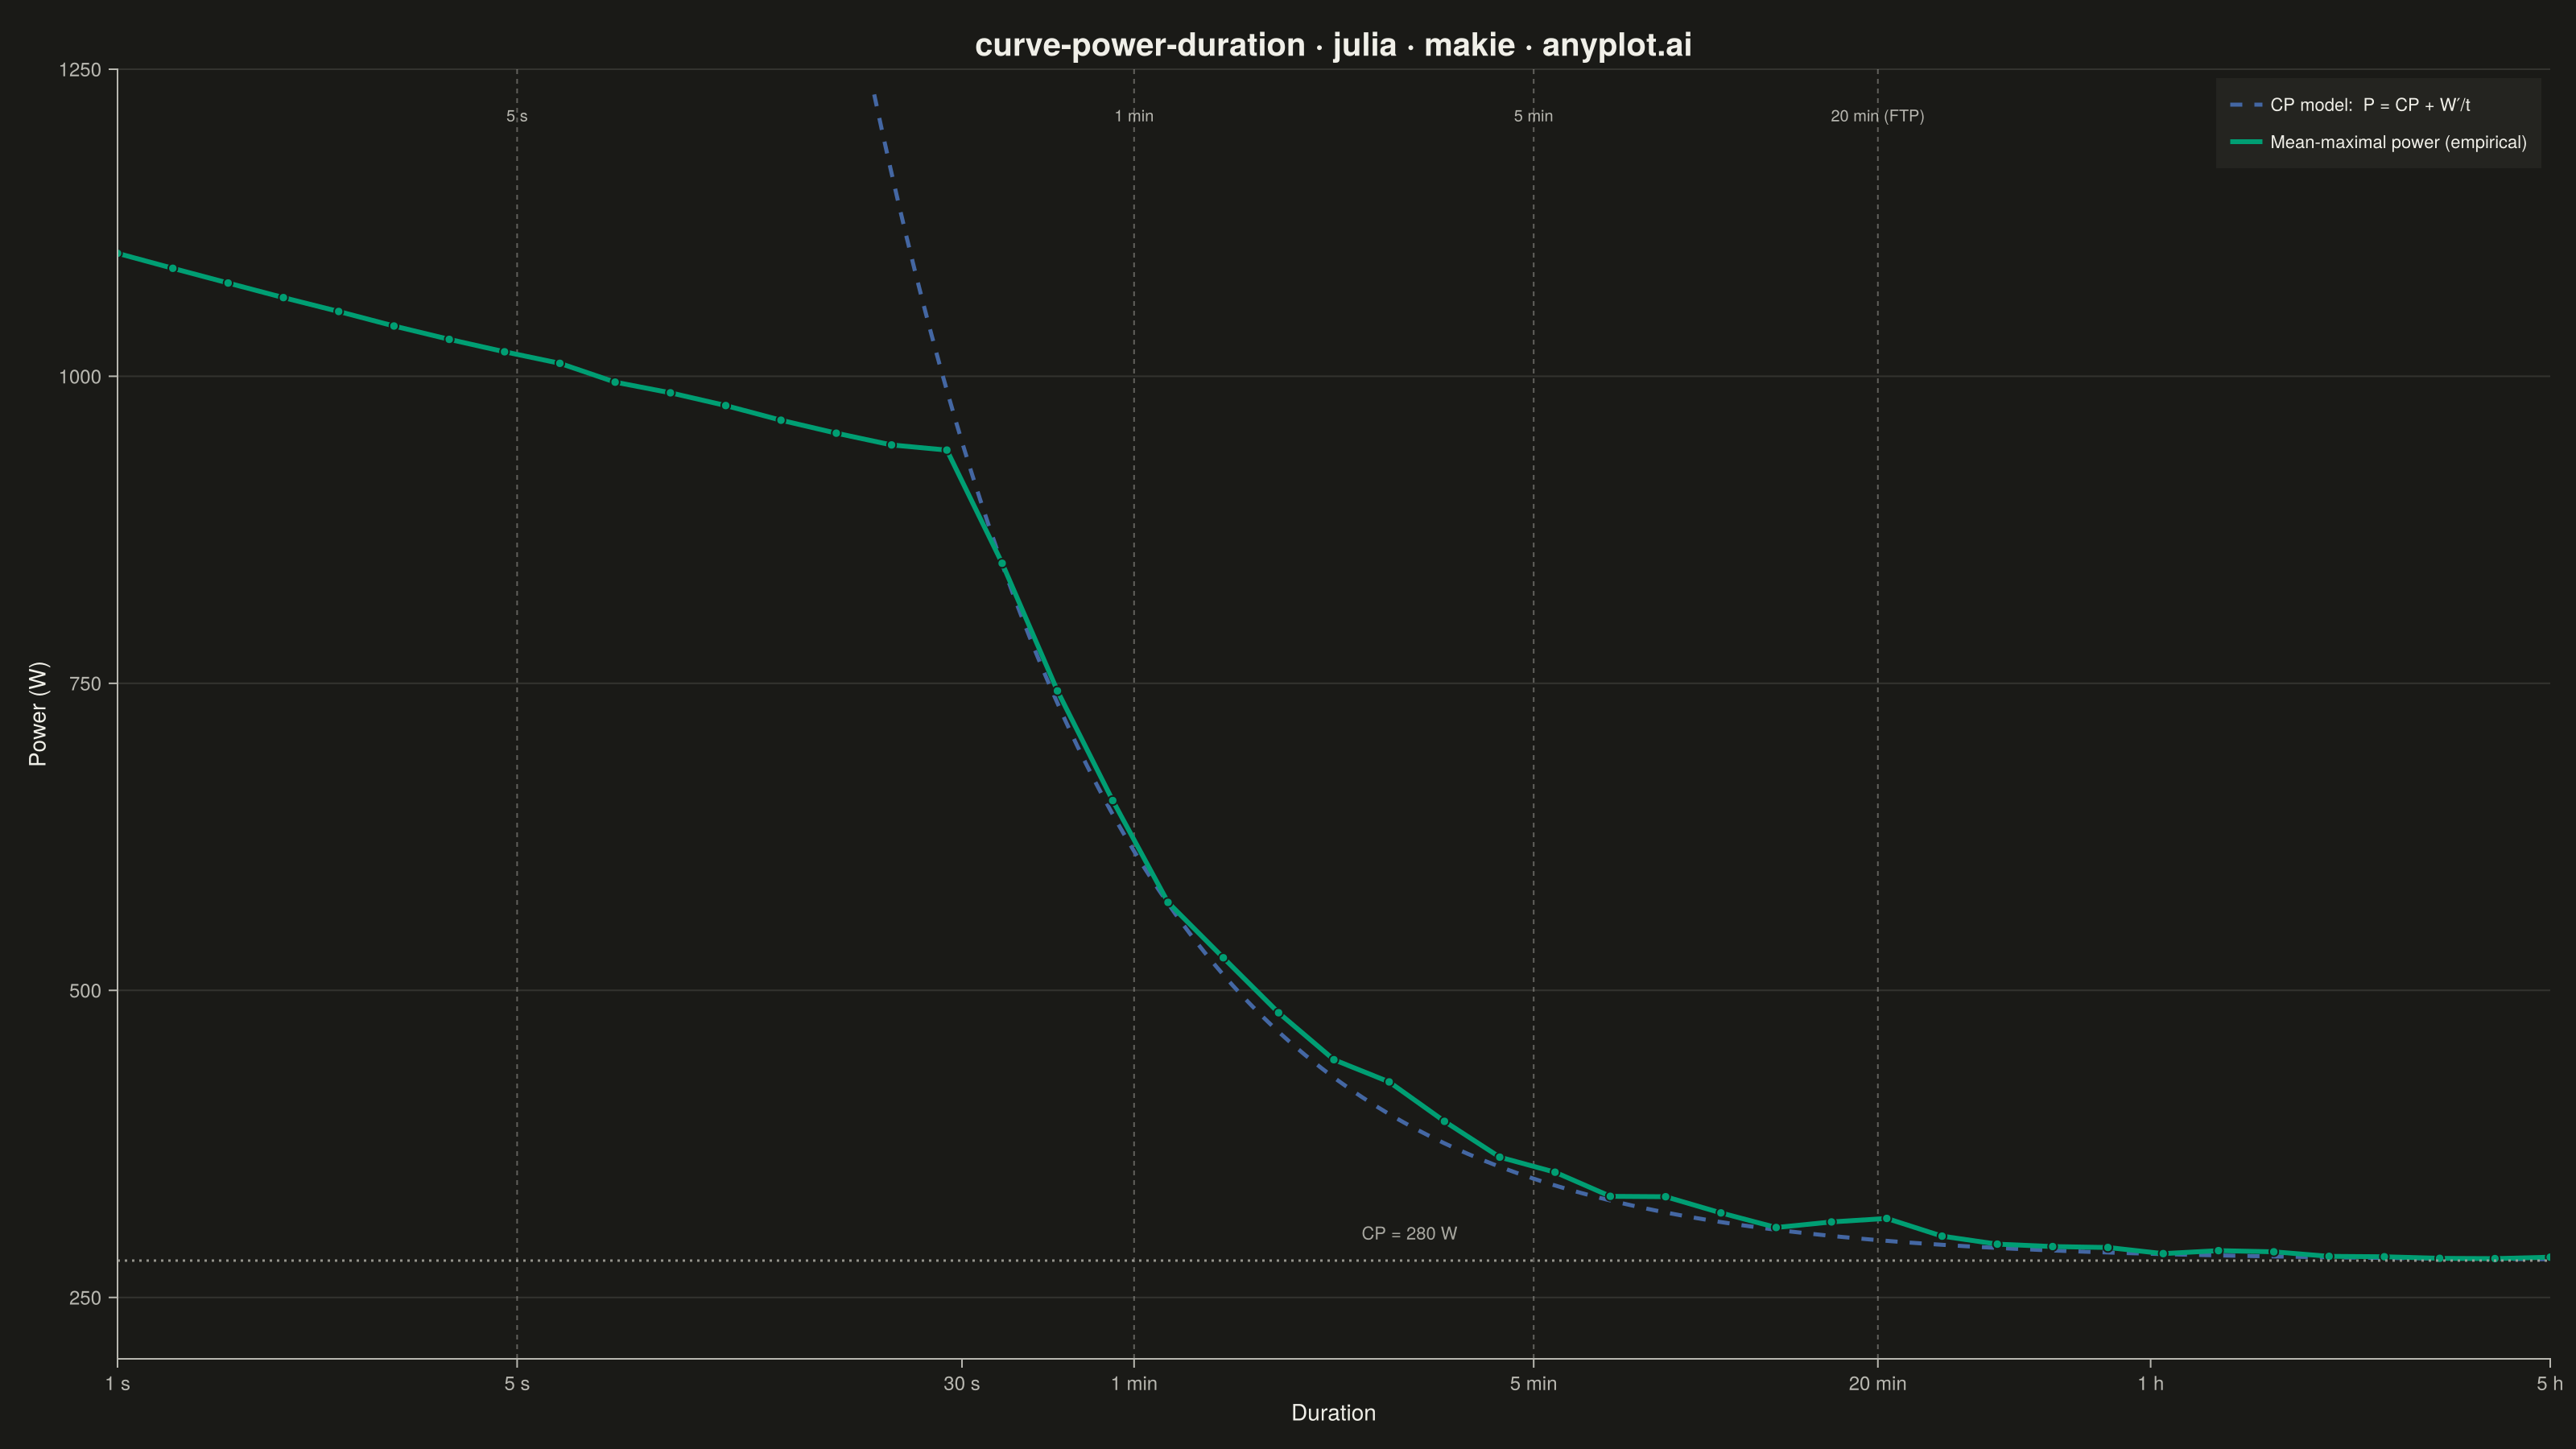
A power duration curve plots an athlete's best mean-maximal power output (watts) against effort duration on a logarithmic time axis spanning roughly 1 second to several hours. Each point answers "what is the highest average power this rider could sustain for exactly this long?", producing a characteristic monotonically decreasing decay curve. A critical power (CP) model is fitted and overlaid, decomposing performance into an aerobic asymptote (CP) and a finite anaerobic work capacity (W′). The chart is a cornerstone of cycling and endurance sports analytics for profiling rider strengths, tracking fitness, and setting training zones.
# anyplot.ai
# curve-power-duration: Mean-Maximal Power Duration Curve
# Library: makie 0.22.10 | Julia 1.11.9
# Quality: 90/100 | Created: 2026-06-13

using CairoMakie
using Colors
using Random

Random.seed!(42)

# Theme tokens
const THEME       = get(ENV, "ANYPLOT_THEME", "light")
const PAGE_BG     = THEME == "light" ? colorant"#FAF8F1" : colorant"#1A1A17"
const ELEVATED_BG = THEME == "light" ? colorant"#FFFDF6" : colorant"#242420"
const INK         = THEME == "light" ? colorant"#1A1A17" : colorant"#F0EFE8"
const INK_SOFT    = THEME == "light" ? colorant"#4A4A44" : colorant"#B8B7B0"
const INK_MUTED   = THEME == "light" ? colorant"#6B6A63" : colorant"#A8A79F"

const IMPRINT_PALETTE = [
    colorant"#009E73",  # 1 — brand green (Imprint palette — always first series)
    colorant"#C475FD",  # 2 — lavender
    colorant"#4467A3",  # 3 — blue
    colorant"#BD8233",  # 4 — ochre
    colorant"#AE3030",  # 5 — matte red
    colorant"#2ABCCD",  # 6 — cyan
    colorant"#954477",  # 7 — rose
    colorant"#99B314",  # 8 — lime
]

# Critical power parameters — well-trained cyclist
const CP      = 280.0    # W  — aerobic asymptote (critical power)
const W_PRIME = 20_000.0 # J  — anaerobic work capacity (W′)
const P_MAX   = 1_100.0  # W  — neuromuscular peak at 1 s

# Empirical mean-maximal power: 45 log-spaced efforts from 1 s to 5 h
const n_emp   = 45
const dur_emp = exp.(range(log(1.0), log(18_000.0); length = n_emp))

# At short durations the neuromuscular cap (P_MAX) limits power below the CP model;
# from ~32 s onwards the CP model governs. Use min() to model this crossover.
base_emp        = [min(P_MAX * t^(-0.05), CP + W_PRIME / t) for t in dur_emp]
scatter_weights = [exp(-((log(t) - log(300.0))^2) / (2.0 * log(8.0)^2)) for t in dur_emp]
empirical_mmp   = base_emp .+ abs.(randn(n_emp)) .* 12.0 .* scatter_weights

# CP model line — dense curve (300 points) for smooth rendering
const n_model     = 300
const dur_model   = exp.(range(log(1.0), log(18_000.0); length = n_model))
const model_power = [CP + W_PRIME / t for t in dur_model]

# Display range — clip the model's off-chart divergence at very short durations
const Y_MIN = 200.0
const Y_MAX = 1_250.0
model_mask = model_power .<= Y_MAX
mt = dur_model[model_mask]
mp = model_power[model_mask]

# Reference durations specified in the spec
const ref_dur    = [5.0, 60.0, 300.0, 1_200.0]
const ref_labels = ["5 s", "1 min", "5 min", "20 min (FTP)"]

fig = Figure(
    size            = (1600, 900),
    fontsize        = 14,
    backgroundcolor = PAGE_BG,
)

ax = Axis(
    fig[1, 1];
    title             = "curve-power-duration · julia · makie · anyplot.ai",
    titlesize         = 20,
    titlecolor        = INK,
    xlabel            = "Duration",
    ylabel            = "Power (W)",
    xlabelsize        = 14,
    ylabelsize        = 14,
    xlabelcolor       = INK,
    ylabelcolor       = INK,
    xticklabelsize    = 12,
    yticklabelsize    = 12,
    xticklabelcolor   = INK_SOFT,
    yticklabelcolor   = INK_SOFT,
    xtickcolor        = INK_SOFT,
    ytickcolor        = INK_SOFT,
    backgroundcolor   = PAGE_BG,
    topspinevisible   = false,
    rightspinevisible = false,
    leftspinecolor    = INK_SOFT,
    bottomspinecolor  = INK_SOFT,
    xscale            = log10,
    xgridvisible      = false,
    ygridvisible      = true,
    ygridcolor        = (INK, 0.12),
    xminorgridvisible = false,
    yminorgridvisible = false,
)

xlims!(ax, 1.0, 18_000.0)
ylims!(ax, Y_MIN, Y_MAX)

# Reference duration vertical lines (drawn first so data layers render on top)
for dur in ref_dur
    vlines!(ax, [dur]; color = (INK_SOFT, 0.45), linewidth = 1.0, linestyle = :dash)
end

# W′ reserve zone — band! fill between CP asymptote and model line (Makie-native primitive)
band!(ax, mt, fill(CP, length(mt)), mp;
    color = (IMPRINT_PALETTE[3], 0.08),
)

# Area fill under MMP curve — band! adds depth and makes the primary data the focal point
band!(ax, dur_emp, fill(Y_MIN, n_emp), empirical_mmp;
    color = (IMPRINT_PALETTE[1], 0.08),
)

# CP model overlay (dashed, Imprint position 3 — blue)
lines!(ax, mt, mp;
    color     = IMPRINT_PALETTE[3],
    linewidth = 2.5,
    linestyle = :dash,
    label     = "CP model:  P = CP + W′/t",
)

# Empirical MMP curve (solid, Imprint position 1 — brand green)
lines!(ax, dur_emp, empirical_mmp;
    color     = IMPRINT_PALETTE[1],
    linewidth = 3.0,
    label     = "Mean-maximal power (empirical)",
)
scatter!(ax, dur_emp, empirical_mmp;
    color       = IMPRINT_PALETTE[1],
    markersize  = 8,
    strokewidth = 1,
    strokecolor = PAGE_BG,
)

# CP asymptote horizontal line (dotted, muted)
hlines!(ax, [CP]; color = (INK_MUTED, 0.85), linewidth = 1.5, linestyle = :dot)

# CP asymptote label
text!(ax, 150.0, CP + 14;
    text     = "CP = $(Int(CP)) W",
    color    = INK_MUTED,
    fontsize = 12,
    align    = (:left, :bottom),
)

# Reference duration labels at the top of each vertical marker
for (dur, lbl) in zip(ref_dur, ref_labels)
    text!(ax, dur, Y_MAX - 30;
        text     = lbl,
        color    = INK_SOFT,
        fontsize = 12,
        align    = (:center, :top),
    )
end

# Human-readable x-axis tick labels (log scale, data-space positions)
ax.xticks = (
    [1.0, 5.0, 30.0, 60.0, 300.0, 1_200.0, 3_600.0, 18_000.0],
    ["1 s", "5 s", "30 s", "1 min", "5 min", "20 min", "1 h", "5 h"],
)

axislegend(ax;
    position        = :rt,
    framevisible    = true,
    framecolor      = (INK_SOFT, 0.4),
    backgroundcolor = ELEVATED_BG,
    labelcolor      = INK,
    padding         = (10, 10, 8, 8),
    labelsize       = 12,
    patchsize       = (24, 8),
    rowgap          = 4,
)

save("plot-$(THEME).png", fig; px_per_unit = 2)
Runnable source as JSON, for any HTTP client: https://api.anyplot.ai/specs/curve-power-duration/makie/code. Any spec id and library id listed in llms-full.txt fit the same URL shape; every URL below is complete and callable.
{
  "spec_id": "curve-power-duration",
  "language": "julia",
  "library": "makie",
  "page": "https://anyplot.ai/curve-power-duration/julia/makie",
  "hub": "https://anyplot.ai/curve-power-duration",
  "code_json": "https://api.anyplot.ai/specs/curve-power-duration/makie/code",
  "spec_json": "https://api.anyplot.ai/specs/curve-power-duration",
  "render_light_png": "https://storage.googleapis.com/anyplot-images/plots/curve-power-duration/julia/makie/plot-light.png",
  "render_dark_png": "https://storage.googleapis.com/anyplot-images/plots/curve-power-duration/julia/makie/plot-dark.png",
  "quality_score": 90.0,
  "license": "MIT",
  "guide": "https://anyplot.ai/llms.txt"
}
Part of Mean-Maximal Power Duration Curve on anyplot.ai.