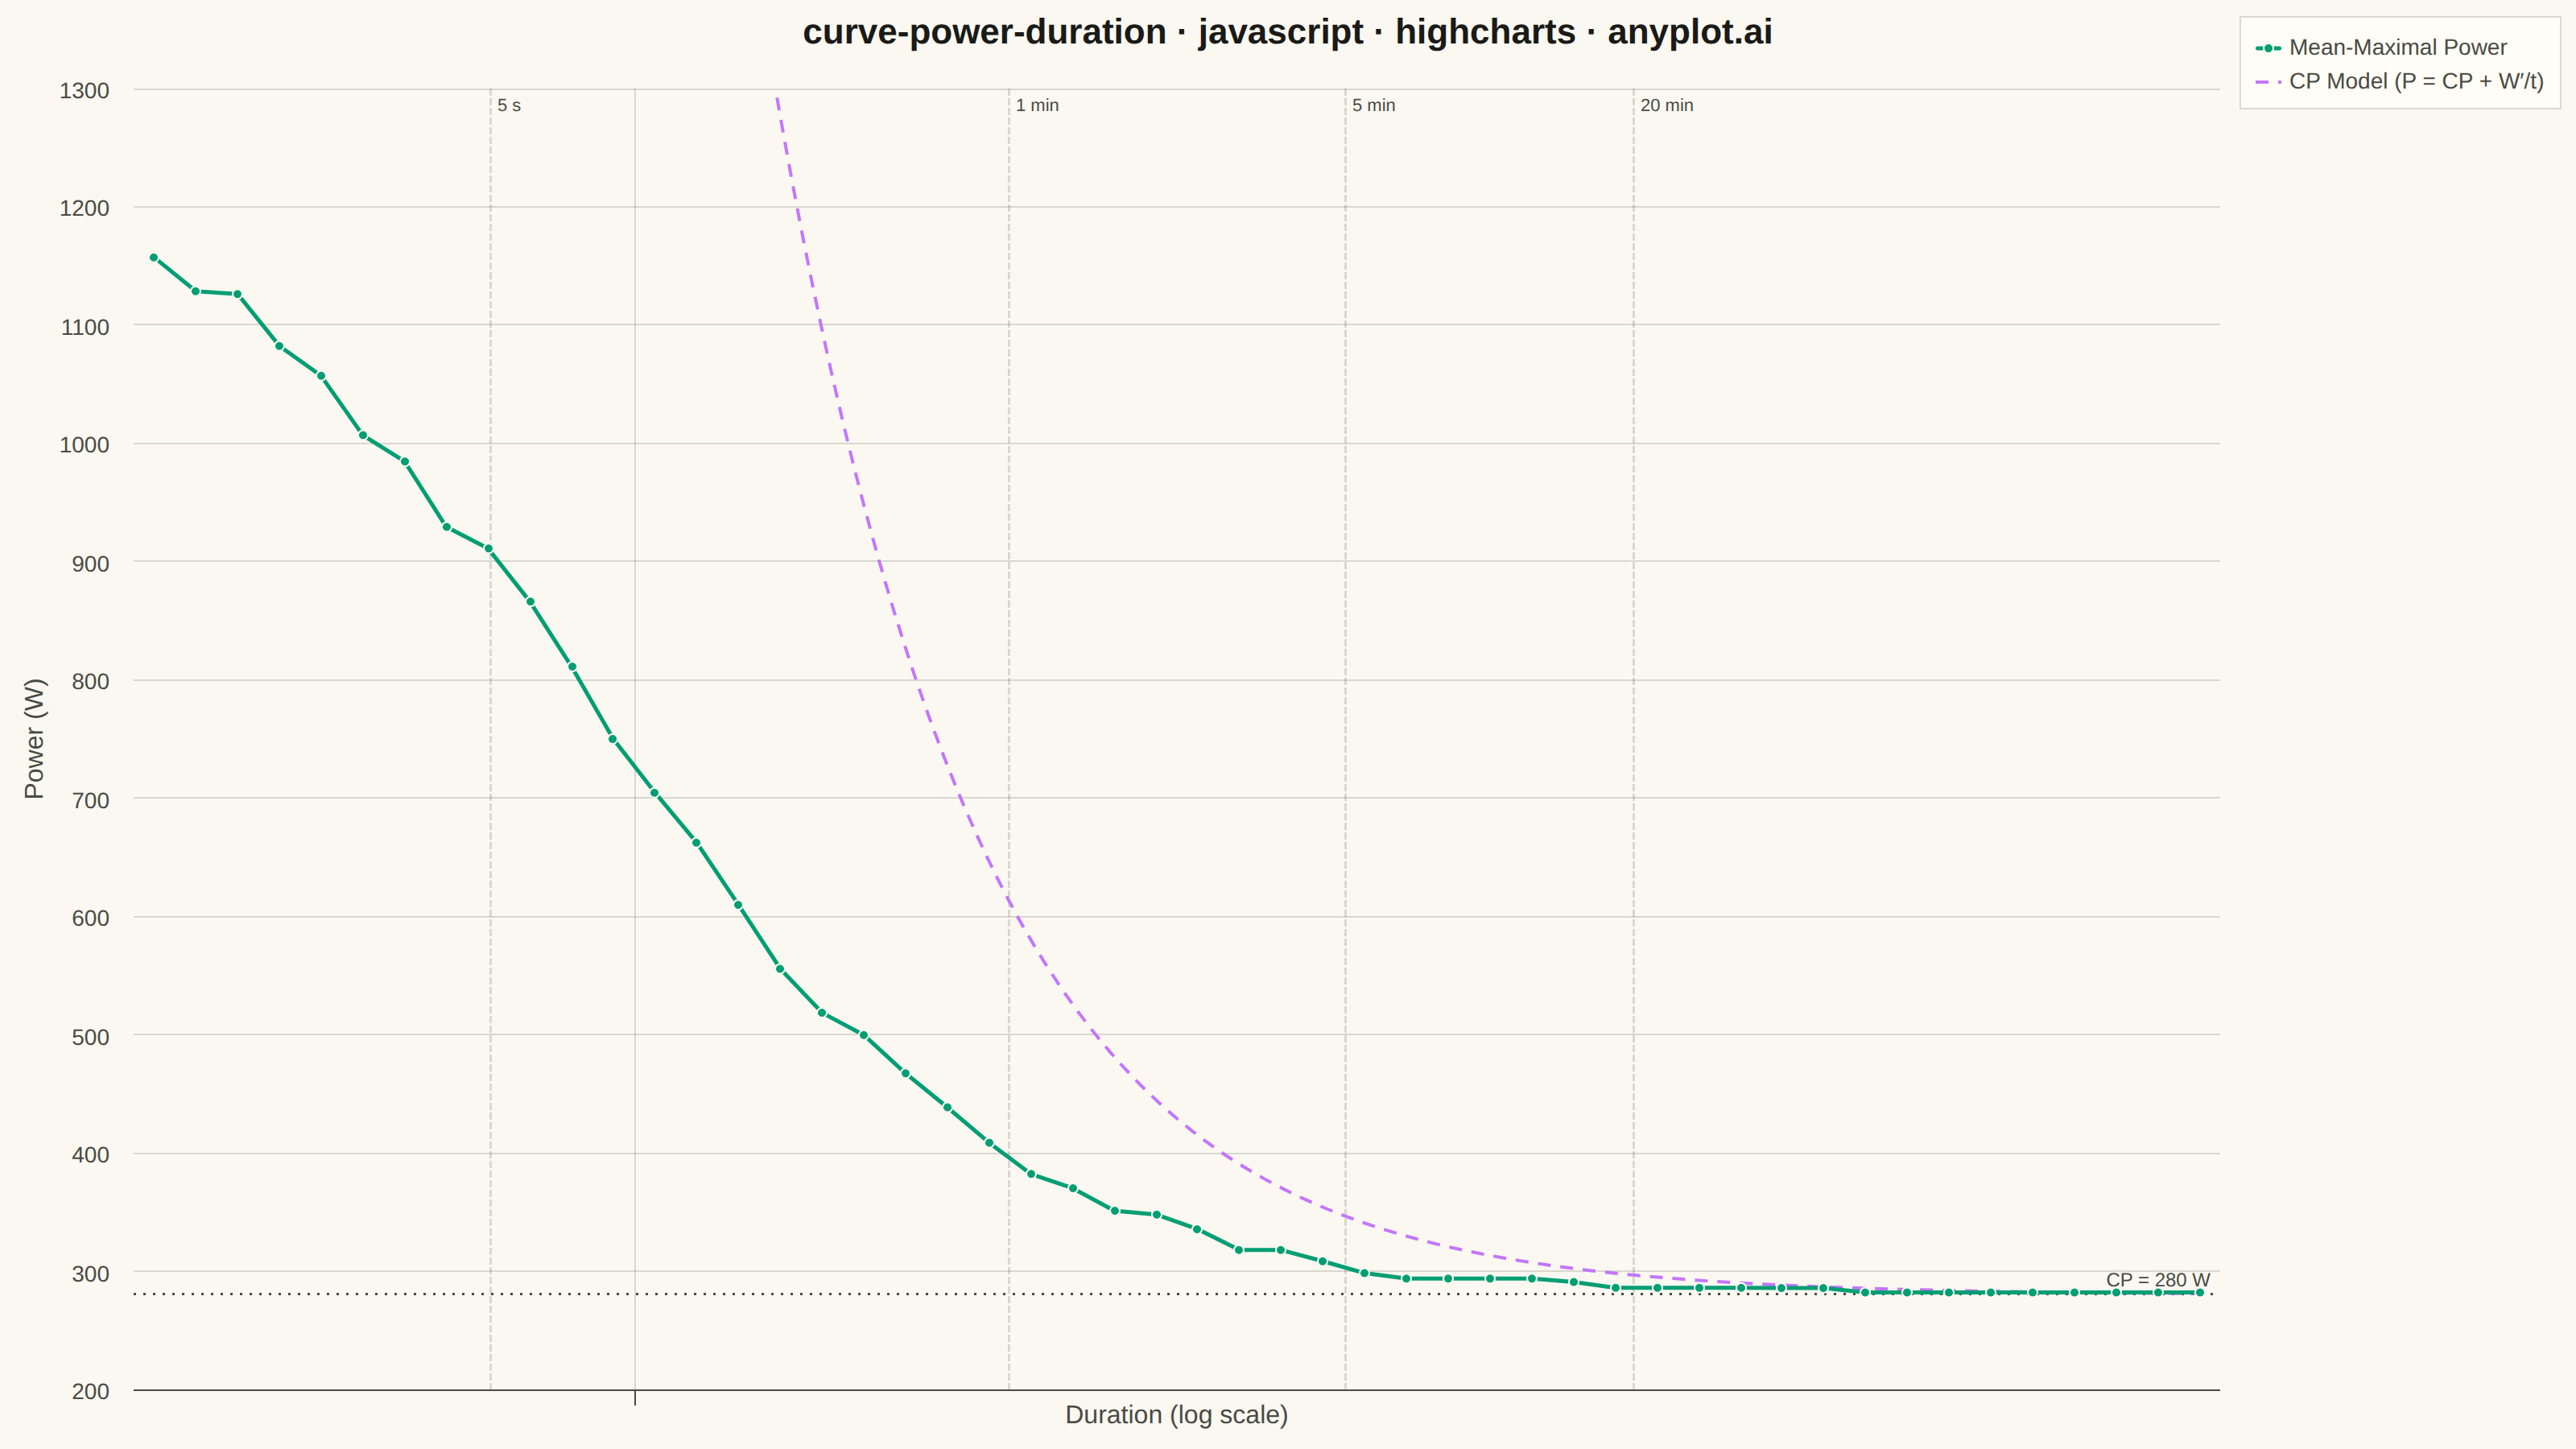
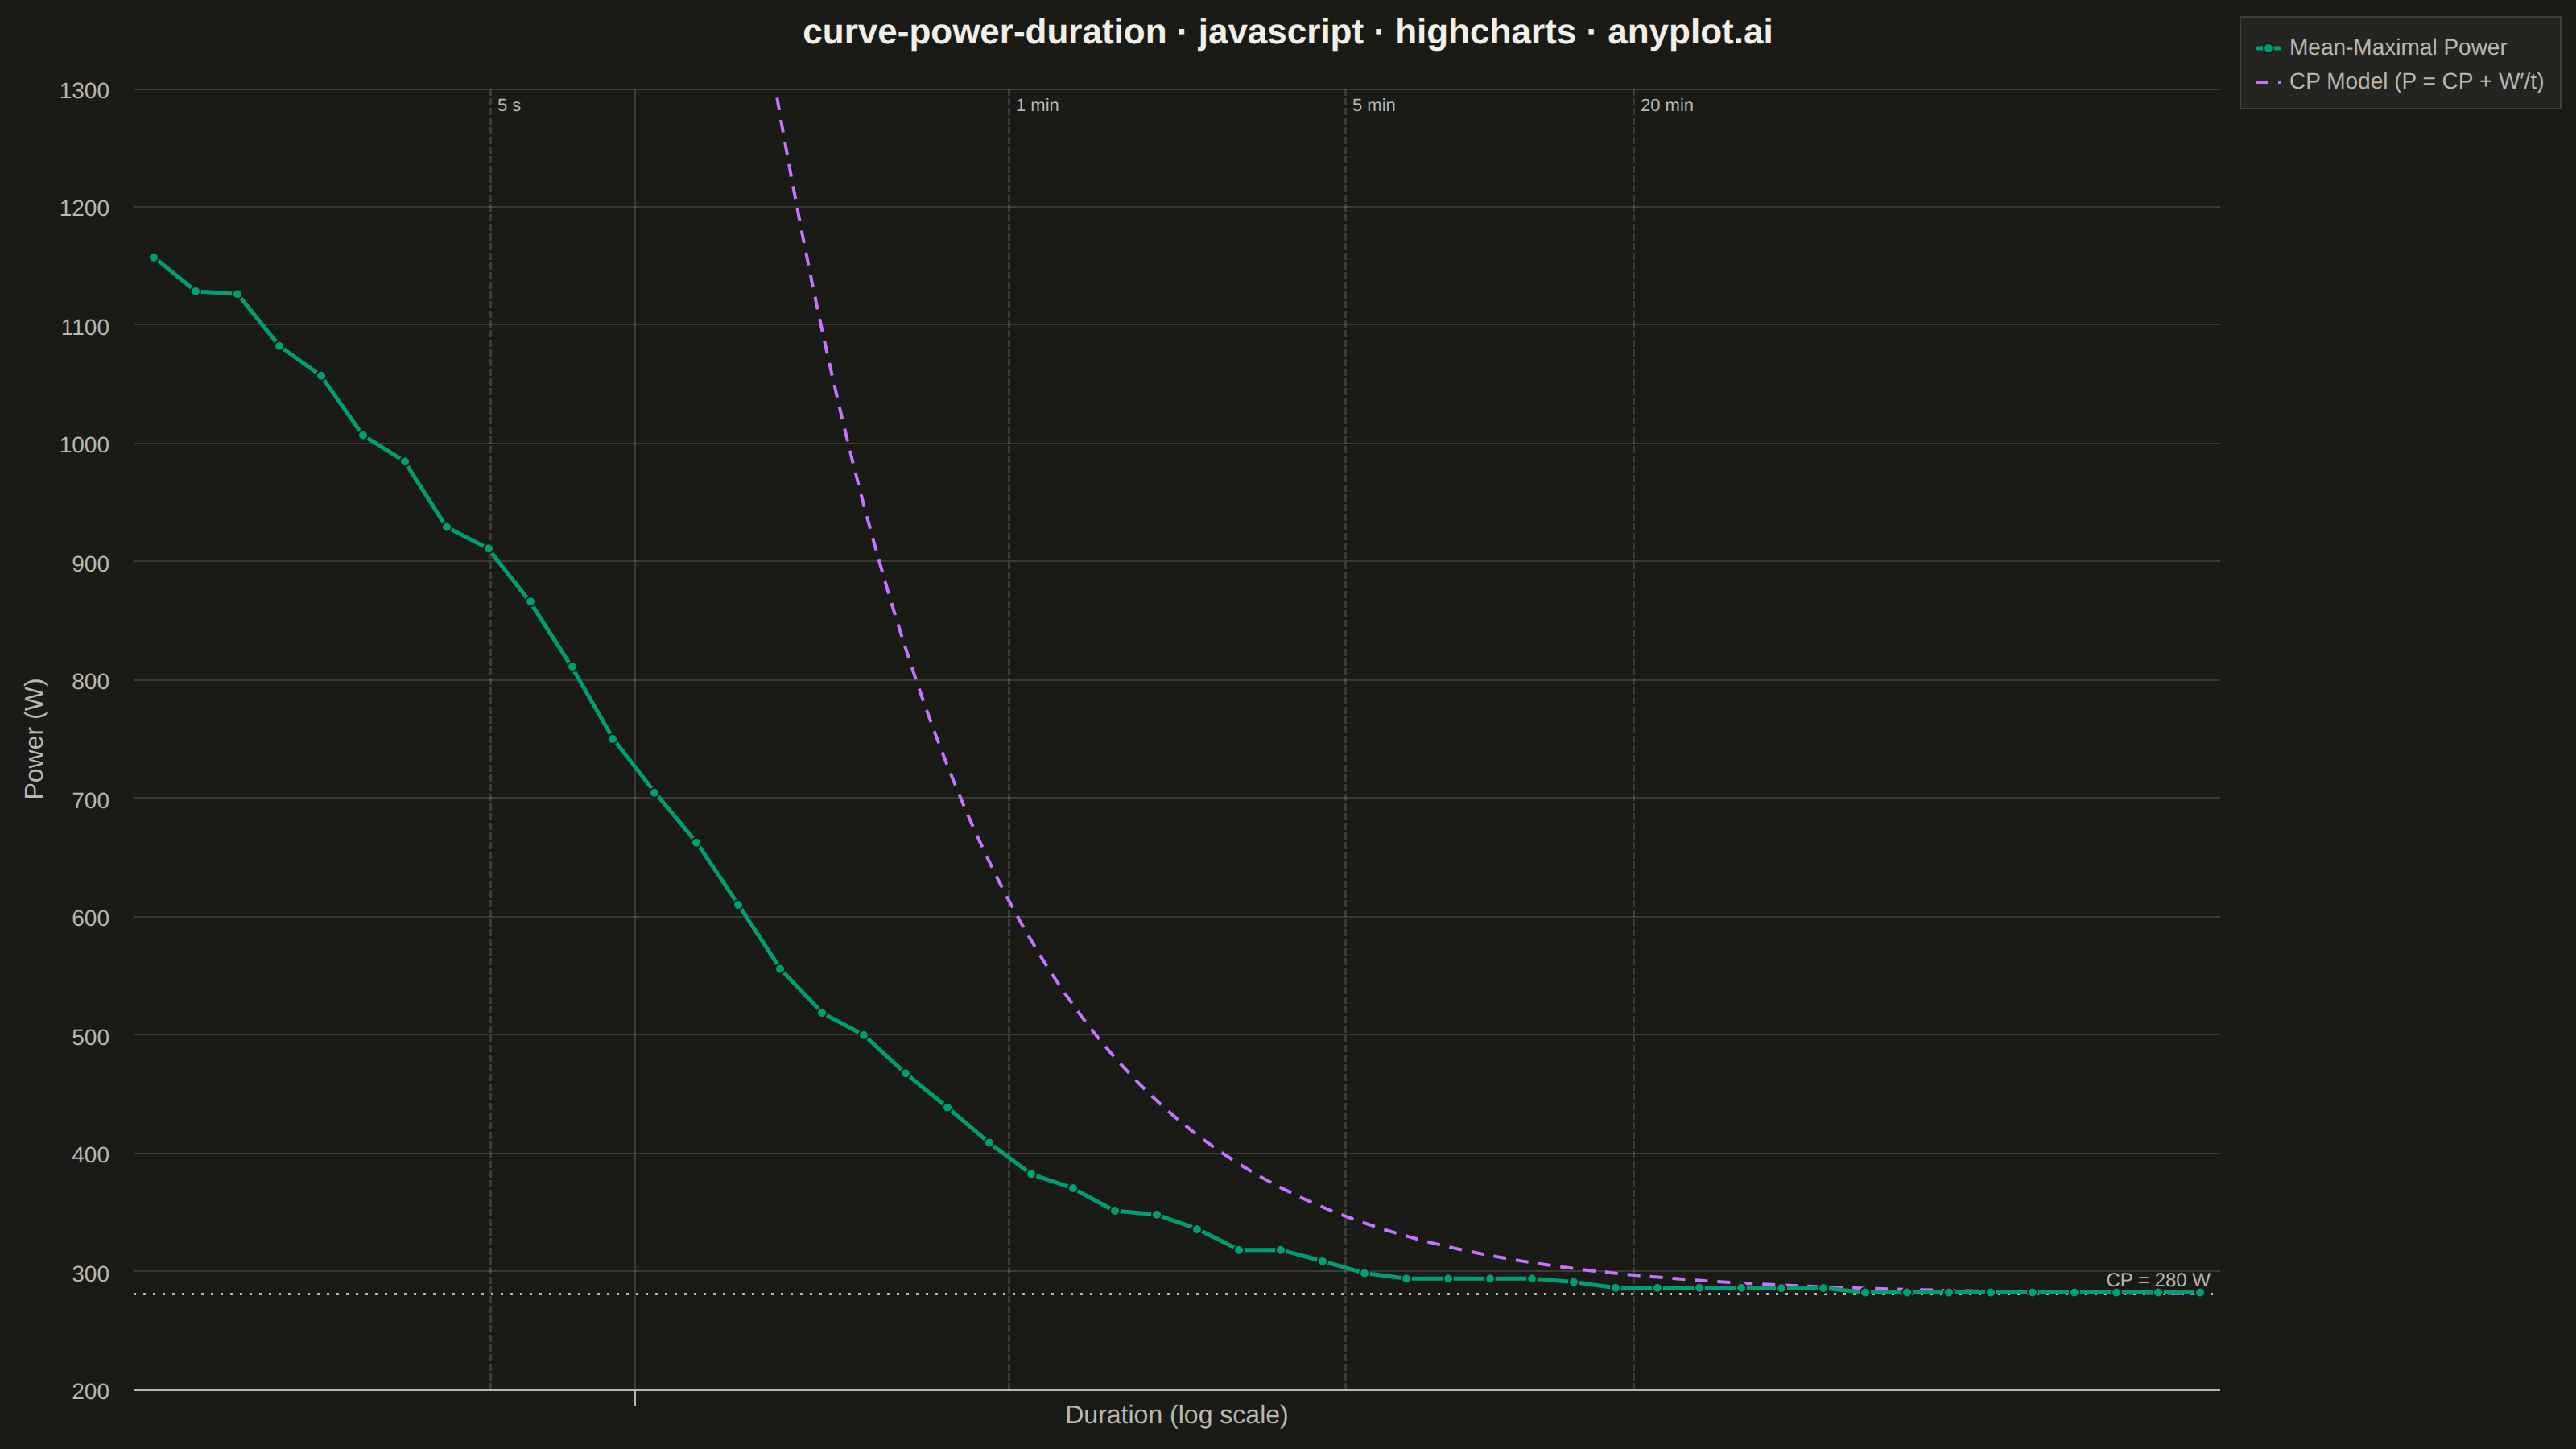
A power duration curve plots an athlete's best mean-maximal power output (watts) against effort duration on a logarithmic time axis spanning roughly 1 second to several hours. Each point answers "what is the highest average power this rider could sustain for exactly this long?", producing a characteristic monotonically decreasing decay curve. A critical power (CP) model is fitted and overlaid, decomposing performance into an aerobic asymptote (CP) and a finite anaerobic work capacity (W′). The chart is a cornerstone of cycling and endurance sports analytics for profiling rider strengths, tracking fitness, and setting training zones.
// anyplot.ai
// curve-power-duration: Mean-Maximal Power Duration Curve
// Library: highcharts 12.6.0 | JavaScript 22.22.3
// Quality: 90/100 | Created: 2026-06-13
//# anyplot-orientation: landscape

const t = window.ANYPLOT_TOKENS;

// --- Data (in-memory, deterministic) -----------------------------------------
// Well-trained cyclist: CP = 280 W, W' = 20 000 J
// Empirical MMP uses 3-param hyperbolic model P = CP + a/(t+b) for
// physiologically realistic sprint power at short durations
const CP = 280;
const W_PRIME = 20000;

// Log-spaced durations: 1 s to 18 000 s (5 h), 50 points
const N = 50;
const LOG_MAX = Math.log(18000);

// Deterministic LCG for repeatable noise
let seed = 42;
function lcg() {
  seed = ((seed * 1664525 + 1013904223) >>> 0);
  return seed / 4294967295;
}

// Empirical MMP: 3-param model + small noise, enforced monotonically non-increasing
const durList = [];
for (let i = 0; i < N; i++) {
  durList.push(Math.exp((i / (N - 1)) * LOG_MAX));
}

const rawPowers = durList.map(d => {
  const mp = CP + 8000 / (d + 8);
  return Math.max(CP + 2, mp + (lcg() - 0.5) * mp * 0.04);
});
for (let i = 1; i < rawPowers.length; i++) {
  if (rawPowers[i] > rawPowers[i - 1]) rawPowers[i] = rawPowers[i - 1];
}
const empiricalData = durList.map((d, i) => [d, Math.round(rawPowers[i] * 10) / 10]);

// 2-param CP model: P = CP + W'/t, sampled from 1 s to 18 000 s
// Highcharts clips points above the y-axis max; the line naturally enters the
// chart area around ~20 s, matching the empirical curve without a hard cutoff.
const modelData = [];
for (let i = 0; i < 200; i++) {
  const d = Math.exp((i / 199) * LOG_MAX);
  modelData.push([d, CP + W_PRIME / d]);
}

// --- Chart -------------------------------------------------------------------
// Title: 59 chars < 67 baseline — no fontSize shrinkage needed
const titleText = "curve-power-duration · javascript · highcharts · anyplot.ai";

Highcharts.chart("container", {
  chart: {
    type: "line",
    backgroundColor: "transparent",
    animation: false,
    style: { fontFamily: "inherit" },
    plotBorderWidth: 0,
  },
  credits: { enabled: false },
  colors: t.palette,
  title: {
    text: titleText,
    style: { color: t.ink, fontSize: "22px", fontWeight: "600" },
    margin: 20,
  },
  xAxis: {
    type: "logarithmic",
    tickPositions: [1, 5, 15, 30, 60, 300, 600, 1200, 3600, 18000],
    minorTicks: false,
    lineColor: t.inkSoft,
    tickColor: t.inkSoft,
    gridLineColor: t.grid,
    gridLineWidth: 1,
    labels: {
      style: { color: t.inkSoft, fontSize: "14px" },
      formatter: function () {
        const v = this.value;
        const allowed = [1, 5, 15, 30, 60, 300, 600, 1200, 3600, 18000];
        if (!allowed.some(a => Math.abs(v - a) / a < 0.01)) return "";
        if (v < 60) return Math.round(v) + " s";
        if (v < 3600) return Math.round(v / 60) + " min";
        return Math.round(v / 3600) + " h";
      },
    },
    title: {
      text: "Duration (log scale)",
      style: { color: t.inkSoft, fontSize: "16px" },
    },
    plotLines: [
      {
        value: 5, color: t.grid, dashStyle: "ShortDash", width: 1.5, zIndex: 3,
        label: { text: "5 s", rotation: 0, y: 14, style: { color: t.inkSoft, fontSize: "11px" } },
      },
      {
        value: 60, color: t.grid, dashStyle: "ShortDash", width: 1.5, zIndex: 3,
        label: { text: "1 min", rotation: 0, y: 14, style: { color: t.inkSoft, fontSize: "11px" } },
      },
      {
        value: 300, color: t.grid, dashStyle: "ShortDash", width: 1.5, zIndex: 3,
        label: { text: "5 min", rotation: 0, y: 14, style: { color: t.inkSoft, fontSize: "11px" } },
      },
      {
        value: 1200, color: t.grid, dashStyle: "ShortDash", width: 1.5, zIndex: 3,
        label: { text: "20 min", rotation: 0, y: 14, style: { color: t.inkSoft, fontSize: "11px" } },
      },
    ],
  },
  yAxis: {
    title: {
      text: "Power (W)",
      style: { color: t.inkSoft, fontSize: "16px" },
    },
    lineColor: t.inkSoft,
    tickColor: t.inkSoft,
    gridLineColor: t.grid,
    labels: { style: { color: t.inkSoft, fontSize: "14px" } },
    min: 210,
    max: 1250,
    plotLines: [
      {
        value: CP,
        color: t.inkSoft,
        dashStyle: "Dot",
        width: 1.5,
        zIndex: 2,
        label: {
          text: "CP = 280 W",
          align: "right",
          x: -6,
          y: -5,
          style: { color: t.inkSoft, fontSize: "12px" },
        },
      },
    ],
  },
  legend: {
    enabled: true,
    align: "right",
    verticalAlign: "top",
    layout: "vertical",
    itemStyle: { color: t.inkSoft, fontSize: "14px", fontWeight: "normal" },
    itemHoverStyle: { color: t.ink },
    backgroundColor: t.elevatedBg,
    borderColor: t.grid,
    borderWidth: 1,
    padding: 10,
  },
  tooltip: {
    formatter: function () {
      const d = this.x;
      const label = d < 60 ? d.toFixed(0) + " s"
                  : d < 3600 ? (d / 60).toFixed(1) + " min"
                  : (d / 3600).toFixed(2) + " h";
      return "<b>" + this.series.name + "</b><br/>Duration: " + label + "<br/>Power: " + this.y.toFixed(1) + " W";
    },
  },
  plotOptions: {
    series: { animation: false },
    line: { marker: { enabled: false } },
  },
  series: [
    {
      name: "Mean-Maximal Power",
      data: empiricalData,
      color: t.palette[0],
      lineWidth: 2.5,
      marker: {
        enabled: true,
        radius: 3,
        fillColor: t.palette[0],
        lineColor: t.pageBg,
        lineWidth: 1,
      },
      zIndex: 4,
    },
    {
      name: "CP Model (P = CP + W′/t)",
      data: modelData,
      color: t.palette[1],
      lineWidth: 2,
      dashStyle: "Dash",
      marker: { enabled: false },
      zIndex: 3,
    },
  ],
});
Runnable source as JSON, for any HTTP client: https://api.anyplot.ai/specs/curve-power-duration/highcharts/code. Any spec id and library id listed in llms-full.txt fit the same URL shape; every URL below is complete and callable.
{
  "spec_id": "curve-power-duration",
  "language": "javascript",
  "library": "highcharts",
  "page": "https://anyplot.ai/curve-power-duration/javascript/highcharts",
  "hub": "https://anyplot.ai/curve-power-duration",
  "code_json": "https://api.anyplot.ai/specs/curve-power-duration/highcharts/code",
  "spec_json": "https://api.anyplot.ai/specs/curve-power-duration",
  "render_light_png": "https://storage.googleapis.com/anyplot-images/plots/curve-power-duration/javascript/highcharts/plot-light.png",
  "render_dark_png": "https://storage.googleapis.com/anyplot-images/plots/curve-power-duration/javascript/highcharts/plot-dark.png",
  "interactive_light_html": "https://storage.googleapis.com/anyplot-images/plots/curve-power-duration/javascript/highcharts/plot-light.html",
  "interactive_dark_html": "https://storage.googleapis.com/anyplot-images/plots/curve-power-duration/javascript/highcharts/plot-dark.html",
  "quality_score": 90.0,
  "license": "MIT",
  "guide": "https://anyplot.ai/llms.txt"
}
Part of Mean-Maximal Power Duration Curve on anyplot.ai.