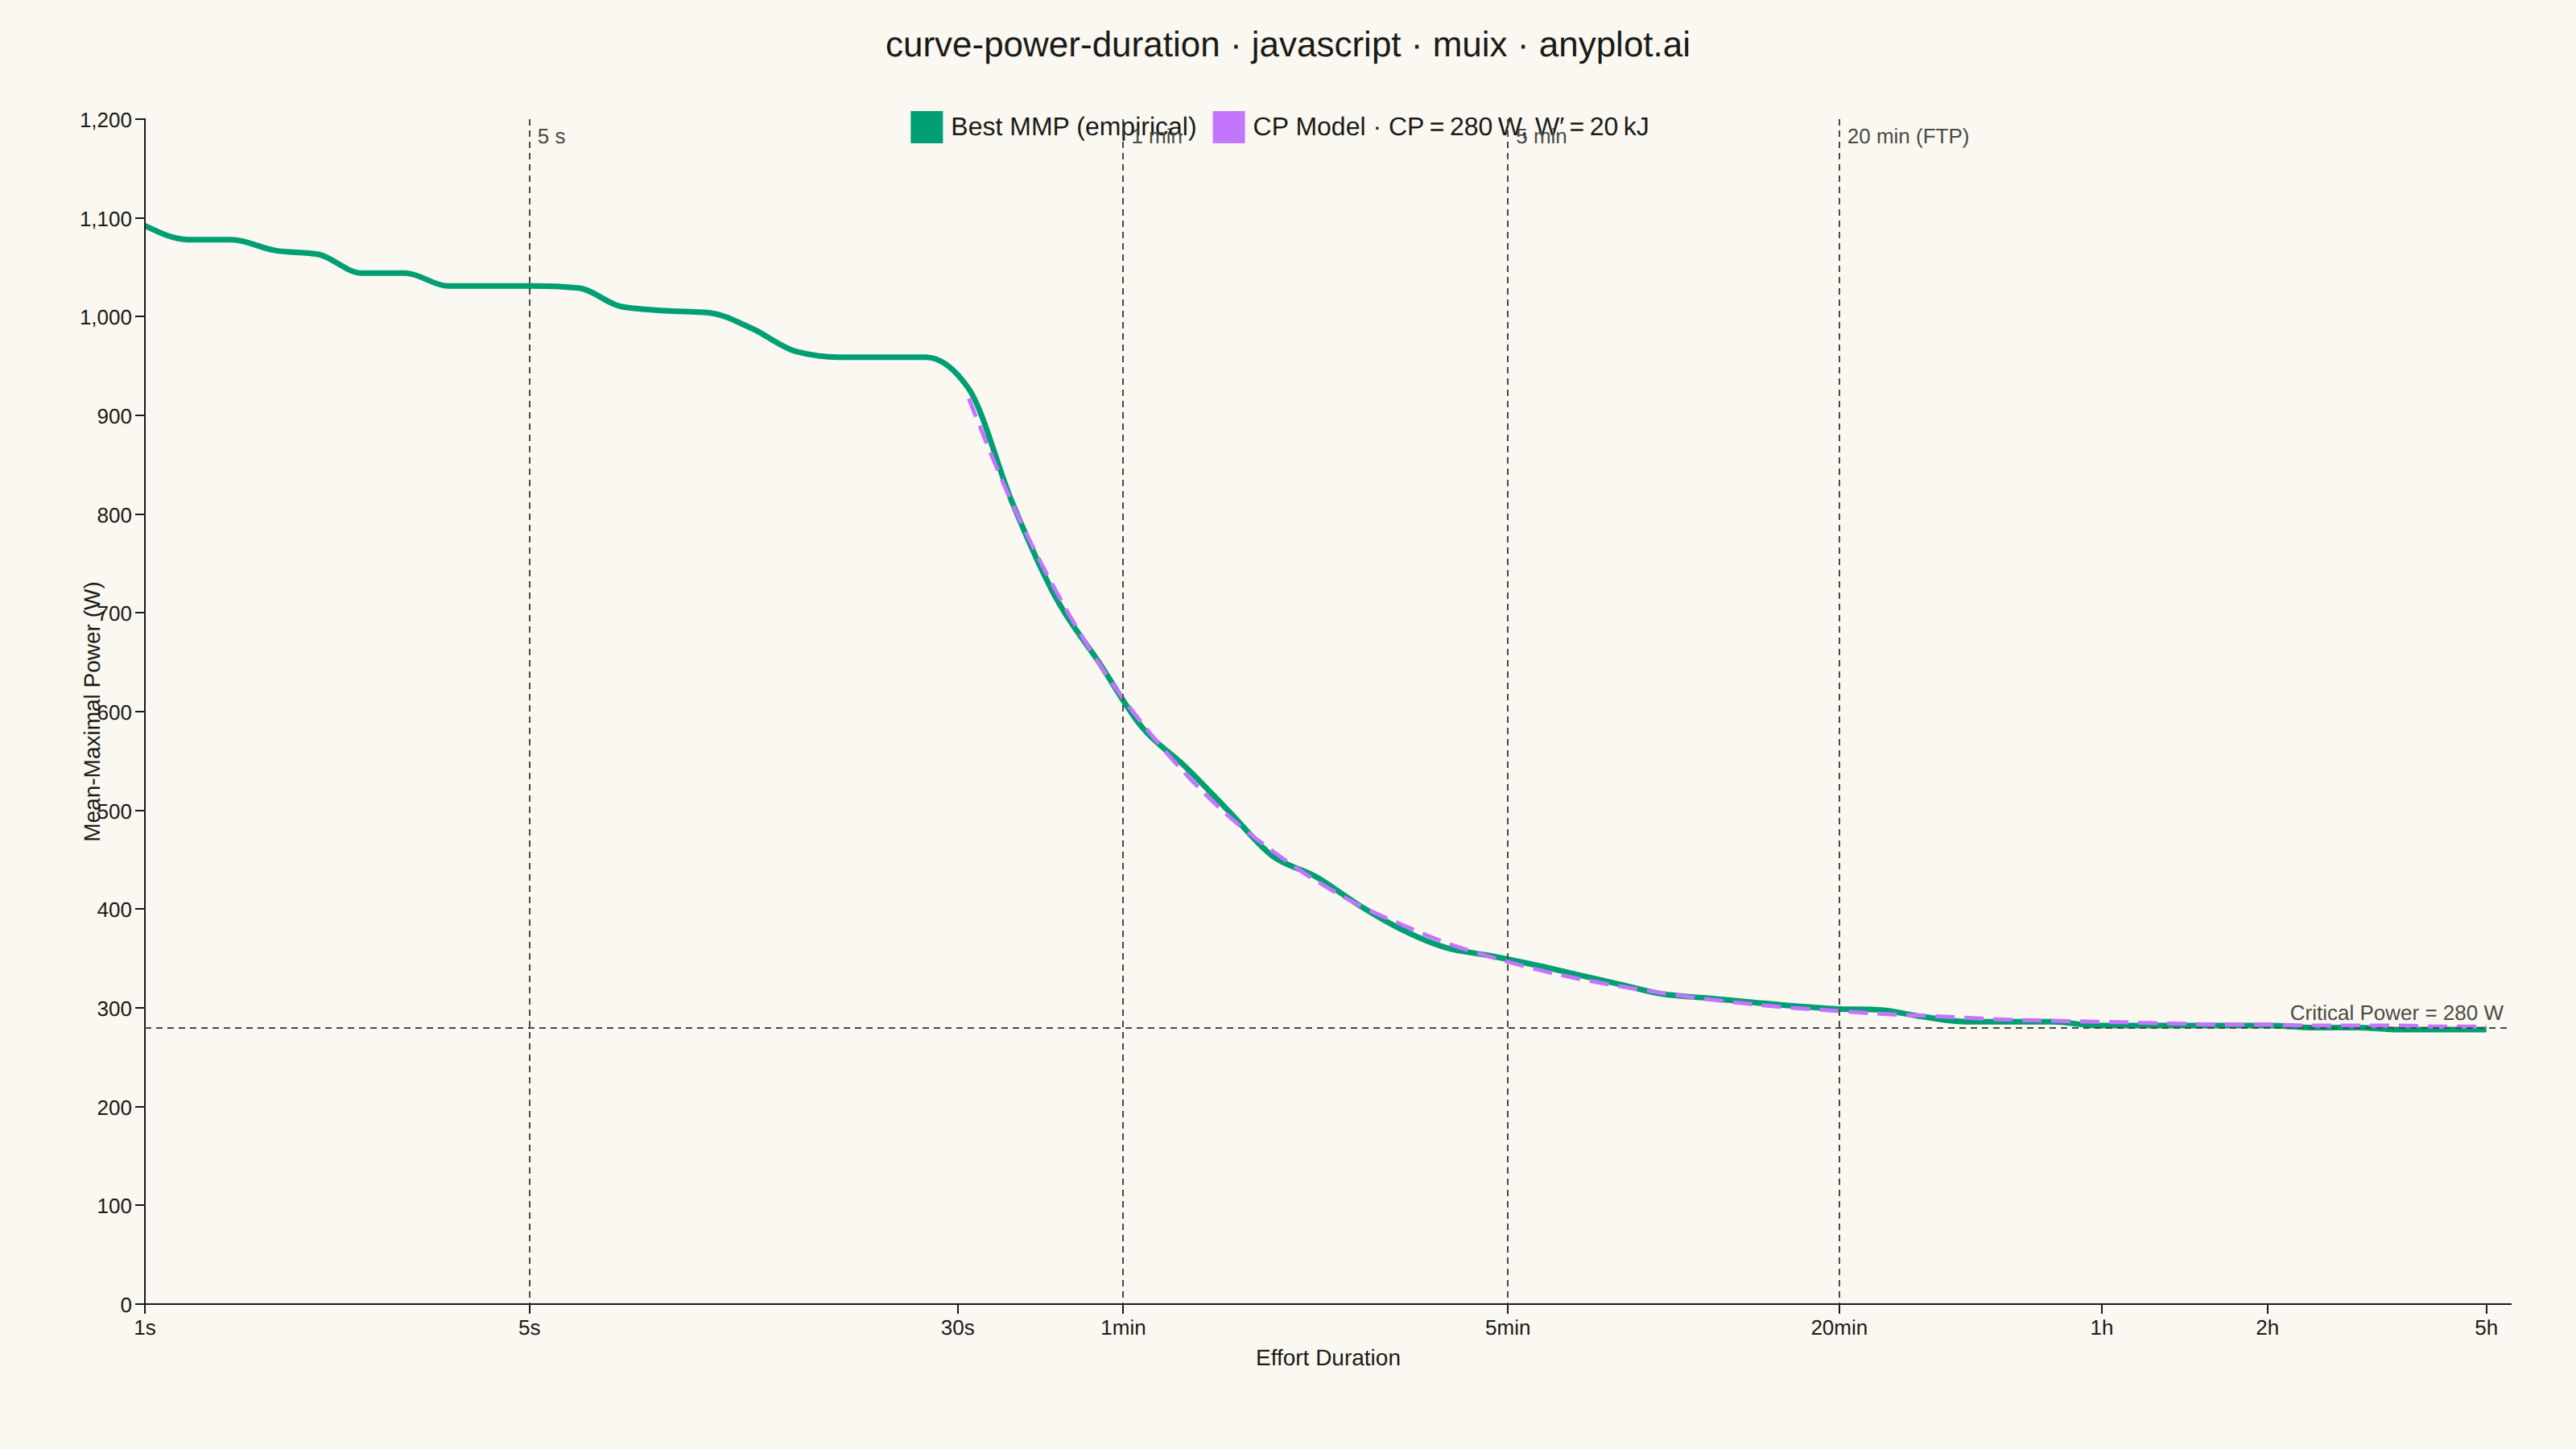
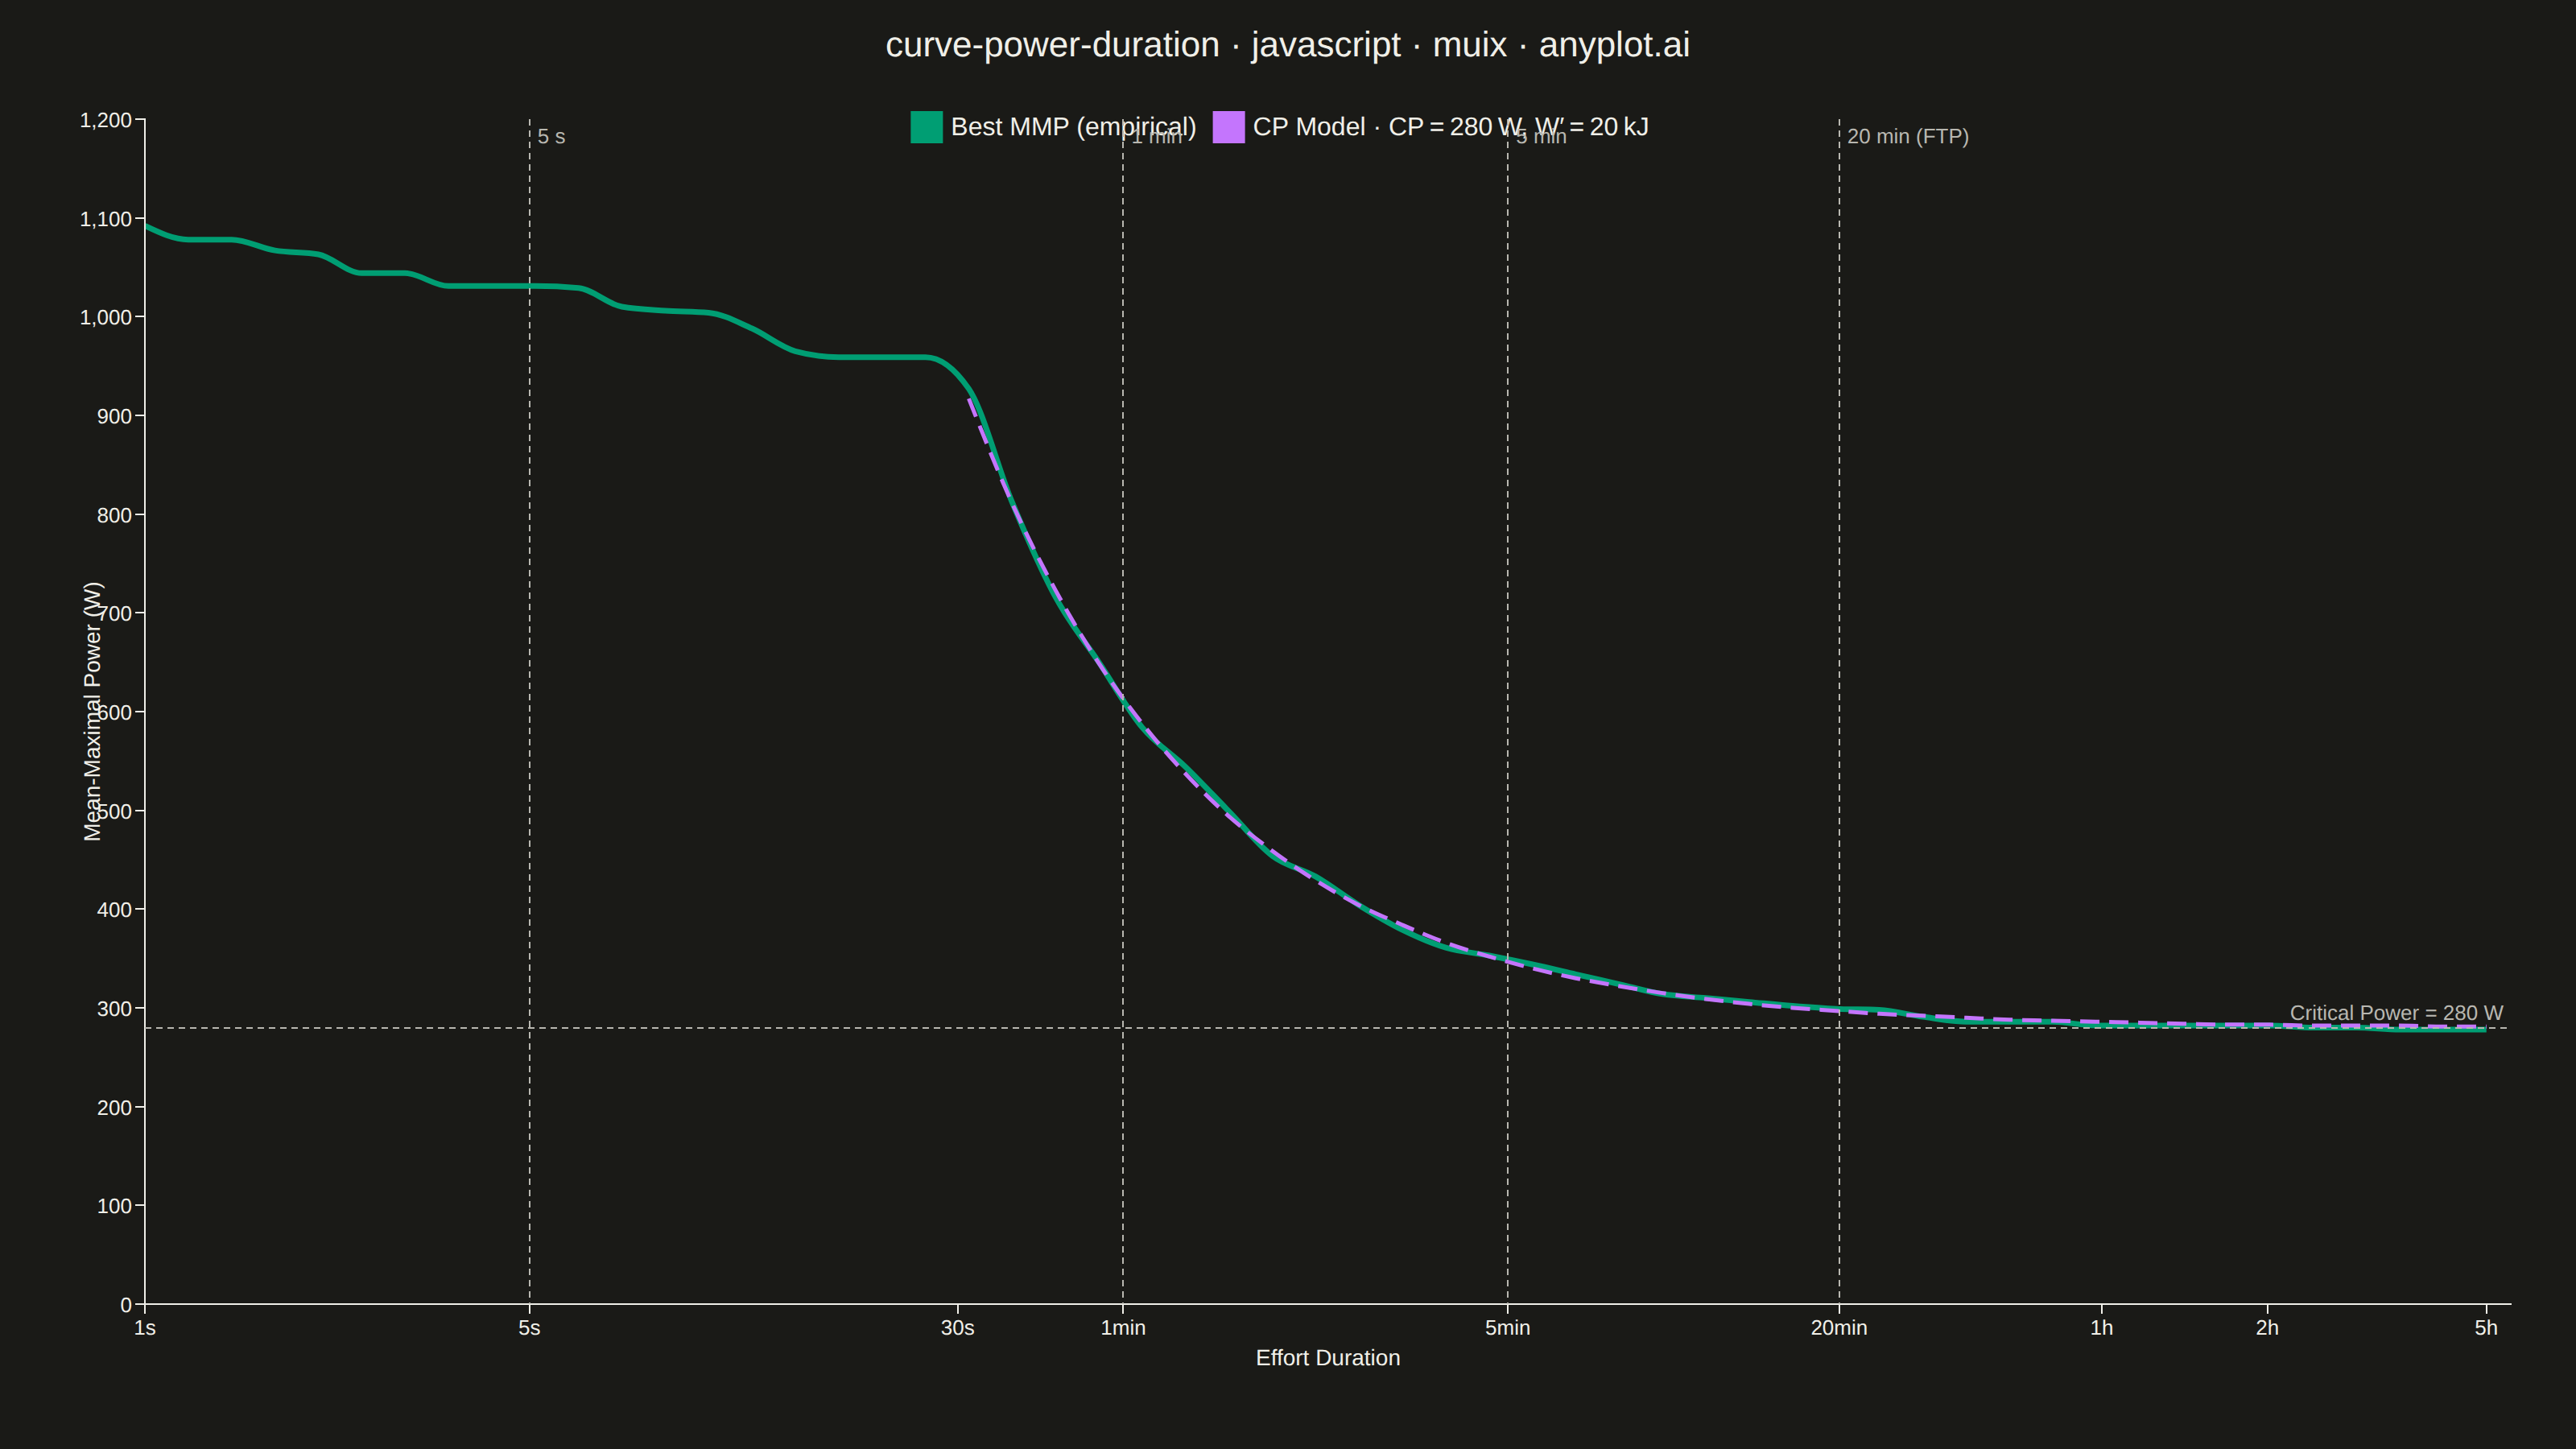
A power duration curve plots an athlete's best mean-maximal power output (watts) against effort duration on a logarithmic time axis spanning roughly 1 second to several hours. Each point answers "what is the highest average power this rider could sustain for exactly this long?", producing a characteristic monotonically decreasing decay curve. A critical power (CP) model is fitted and overlaid, decomposing performance into an aerobic asymptote (CP) and a finite anaerobic work capacity (W′). The chart is a cornerstone of cycling and endurance sports analytics for profiling rider strengths, tracking fitness, and setting training zones.
// anyplot.ai
// curve-power-duration: Mean-Maximal Power Duration Curve
// Library: muix 7.29.1 | JavaScript 22.22.3
// Quality: 84/100 | Created: 2026-06-13

import { LineChart, ChartsReferenceLine } from "@mui/x-charts";
import Box from "@mui/material/Box";
import Typography from "@mui/material/Typography";

const t = window.ANYPLOT_TOKENS;
const W = window.ANYPLOT_SIZE.width;
const H = window.ANYPLOT_SIZE.height;
const TITLE_H = 54;

// --- Data (deterministic, in-memory) ----------------------------------------

const CP = 280;        // Critical Power in watts — aerobic asymptote
const W_PRIME = 20000; // Anaerobic work capacity in joules
const PEAK = 1100;     // Neuromuscular peak (1-second best), watts
const BLEND = 30;      // Seconds below which CP model overestimates

// 55 log-spaced durations: 1 s → 18 000 s (5 h)
const N = 55;
const durations = Array.from({ length: N }, (_, i) => {
  const lo = Math.log10(1);
  const hi = Math.log10(18000);
  return Math.pow(10, lo + (i / (N - 1)) * (hi - lo));
});

// Empirical curve: neuromuscular plateau (< 30 s) blends into CP model (≥ 30 s)
const cpAtBlend = CP + W_PRIME / BLEND; // ≈ 947 W
const empiricalBase = durations.map((d) => {
  if (d >= BLEND) return CP + W_PRIME / d;
  const frac = Math.log10(d) / Math.log10(BLEND); // 0 at 1 s, 1 at BLEND s
  return PEAK + (cpAtBlend - PEAK) * frac;
});

// LCG for reproducible noise
let seed = 42;
const lcg = () => {
  seed = (seed * 1664525 + 1013904223) & 0xffffffff;
  return (seed >>> 0) / 0xffffffff;
};

// Add small noise, then enforce monotone non-increase
const empiricalNoisy = empiricalBase.map((b) => b * (1 + (lcg() - 0.5) * 0.03));
const empiricalPower = [];
let prevW = Infinity;
for (const v of empiricalNoisy) {
  const val = Math.min(v, prevW);
  empiricalPower.push(Math.round(val));
  prevW = val;
}

// Fitted CP model (hyperbolic): null below BLEND so the line starts at 30 s
const modelPower = durations.map((d) =>
  d >= BLEND ? Math.round(CP + W_PRIME / d) : null
);

// Human-readable duration labels for axis ticks
const fmtDur = (s) => {
  s = Math.round(s);
  if (s < 60) return `${s}s`;
  if (s < 3600) return `${Math.round(s / 60)}min`;
  return `${Math.round(s / 3600)}h`;
};

// --- Component (default-exported; harness mounts it) ------------------------

export default function Chart() {
  return (
    <Box
      sx={{
        width: W,
        height: H,
        display: "flex",
        flexDirection: "column",
        bgcolor: t.pageBg,
      }}
    >
      <Typography
        sx={{
          height: TITLE_H,
          display: "flex",
          alignItems: "center",
          justifyContent: "center",
          color: t.ink,
          fontSize: 22,
          fontWeight: 500,
          flexShrink: 0,
        }}
      >
        curve-power-duration · javascript · muix · anyplot.ai
      </Typography>
      <LineChart
        width={W}
        height={H - TITLE_H}
        skipAnimation
        colors={[t.palette[0], t.palette[1]]}
        xAxis={[
          {
            id: "duration",
            data: durations,
            scaleType: "log",
            label: "Effort Duration",
            valueFormatter: fmtDur,
            tickInterval: [1, 5, 30, 60, 300, 1200, 3600, 7200, 18000],
            min: 1,
            max: 20000,
            tickLabelStyle: { fontSize: 13 },
          },
        ]}
        yAxis={[
          {
            id: "power",
            label: "Mean-Maximal Power (W)",
            min: 0,
            max: 1200,
            tickLabelStyle: { fontSize: 13 },
          },
        ]}
        series={[
          {
            id: "empirical",
            data: empiricalPower,
            label: "Best MMP (empirical)",
            showMark: false,
            curve: "monotoneX",
          },
          {
            id: "model",
            data: modelPower,
            label: `CP Model · CP = ${CP} W, W′ = ${W_PRIME / 1000} kJ`,
            showMark: false,
            curve: "monotoneX",
            connectNulls: false,
          },
        ]}
        sx={{
          ".MuiLineElement-series-model": {
            strokeDasharray: "12 6",
            strokeWidth: 2.5,
          },
          ".MuiLineElement-series-empirical": {
            strokeWidth: 3.5,
          },
        }}
        margin={{ left: 90, right: 40, top: 20, bottom: 90 }}
      >
        <ChartsReferenceLine
          x={5}
          label="5 s"
          labelAlign="start"
          lineStyle={{ stroke: t.inkSoft, strokeDasharray: "4 3", strokeWidth: 1 }}
          labelStyle={{ fill: t.inkSoft, fontSize: 13 }}
        />
        <ChartsReferenceLine
          x={60}
          label="1 min"
          labelAlign="start"
          lineStyle={{ stroke: t.inkSoft, strokeDasharray: "4 3", strokeWidth: 1 }}
          labelStyle={{ fill: t.inkSoft, fontSize: 13 }}
        />
        <ChartsReferenceLine
          x={300}
          label="5 min"
          labelAlign="start"
          lineStyle={{ stroke: t.inkSoft, strokeDasharray: "4 3", strokeWidth: 1 }}
          labelStyle={{ fill: t.inkSoft, fontSize: 13 }}
        />
        <ChartsReferenceLine
          x={1200}
          label="20 min (FTP)"
          labelAlign="start"
          lineStyle={{ stroke: t.inkSoft, strokeDasharray: "4 3", strokeWidth: 1 }}
          labelStyle={{ fill: t.inkSoft, fontSize: 13 }}
        />
        <ChartsReferenceLine
          y={CP}
          label={`Critical Power = ${CP} W`}
          labelAlign="end"
          lineStyle={{ stroke: t.inkSoft, strokeDasharray: "4 3", strokeWidth: 1 }}
          labelStyle={{ fill: t.inkSoft, fontSize: 13 }}
        />
      </LineChart>
    </Box>
  );
}
Runnable source as JSON, for any HTTP client: https://api.anyplot.ai/specs/curve-power-duration/muix/code. Any spec id and library id listed in llms-full.txt fit the same URL shape; every URL below is complete and callable.
{
  "spec_id": "curve-power-duration",
  "language": "javascript",
  "library": "muix",
  "page": "https://anyplot.ai/curve-power-duration/javascript/muix",
  "hub": "https://anyplot.ai/curve-power-duration",
  "code_json": "https://api.anyplot.ai/specs/curve-power-duration/muix/code",
  "spec_json": "https://api.anyplot.ai/specs/curve-power-duration",
  "render_light_png": "https://storage.googleapis.com/anyplot-images/plots/curve-power-duration/javascript/muix/plot-light.png",
  "render_dark_png": "https://storage.googleapis.com/anyplot-images/plots/curve-power-duration/javascript/muix/plot-dark.png",
  "interactive_light_html": "https://storage.googleapis.com/anyplot-images/plots/curve-power-duration/javascript/muix/plot-light.html",
  "interactive_dark_html": "https://storage.googleapis.com/anyplot-images/plots/curve-power-duration/javascript/muix/plot-dark.html",
  "quality_score": 84.0,
  "license": "MIT",
  "guide": "https://anyplot.ai/llms.txt"
}
Part of Mean-Maximal Power Duration Curve on anyplot.ai.