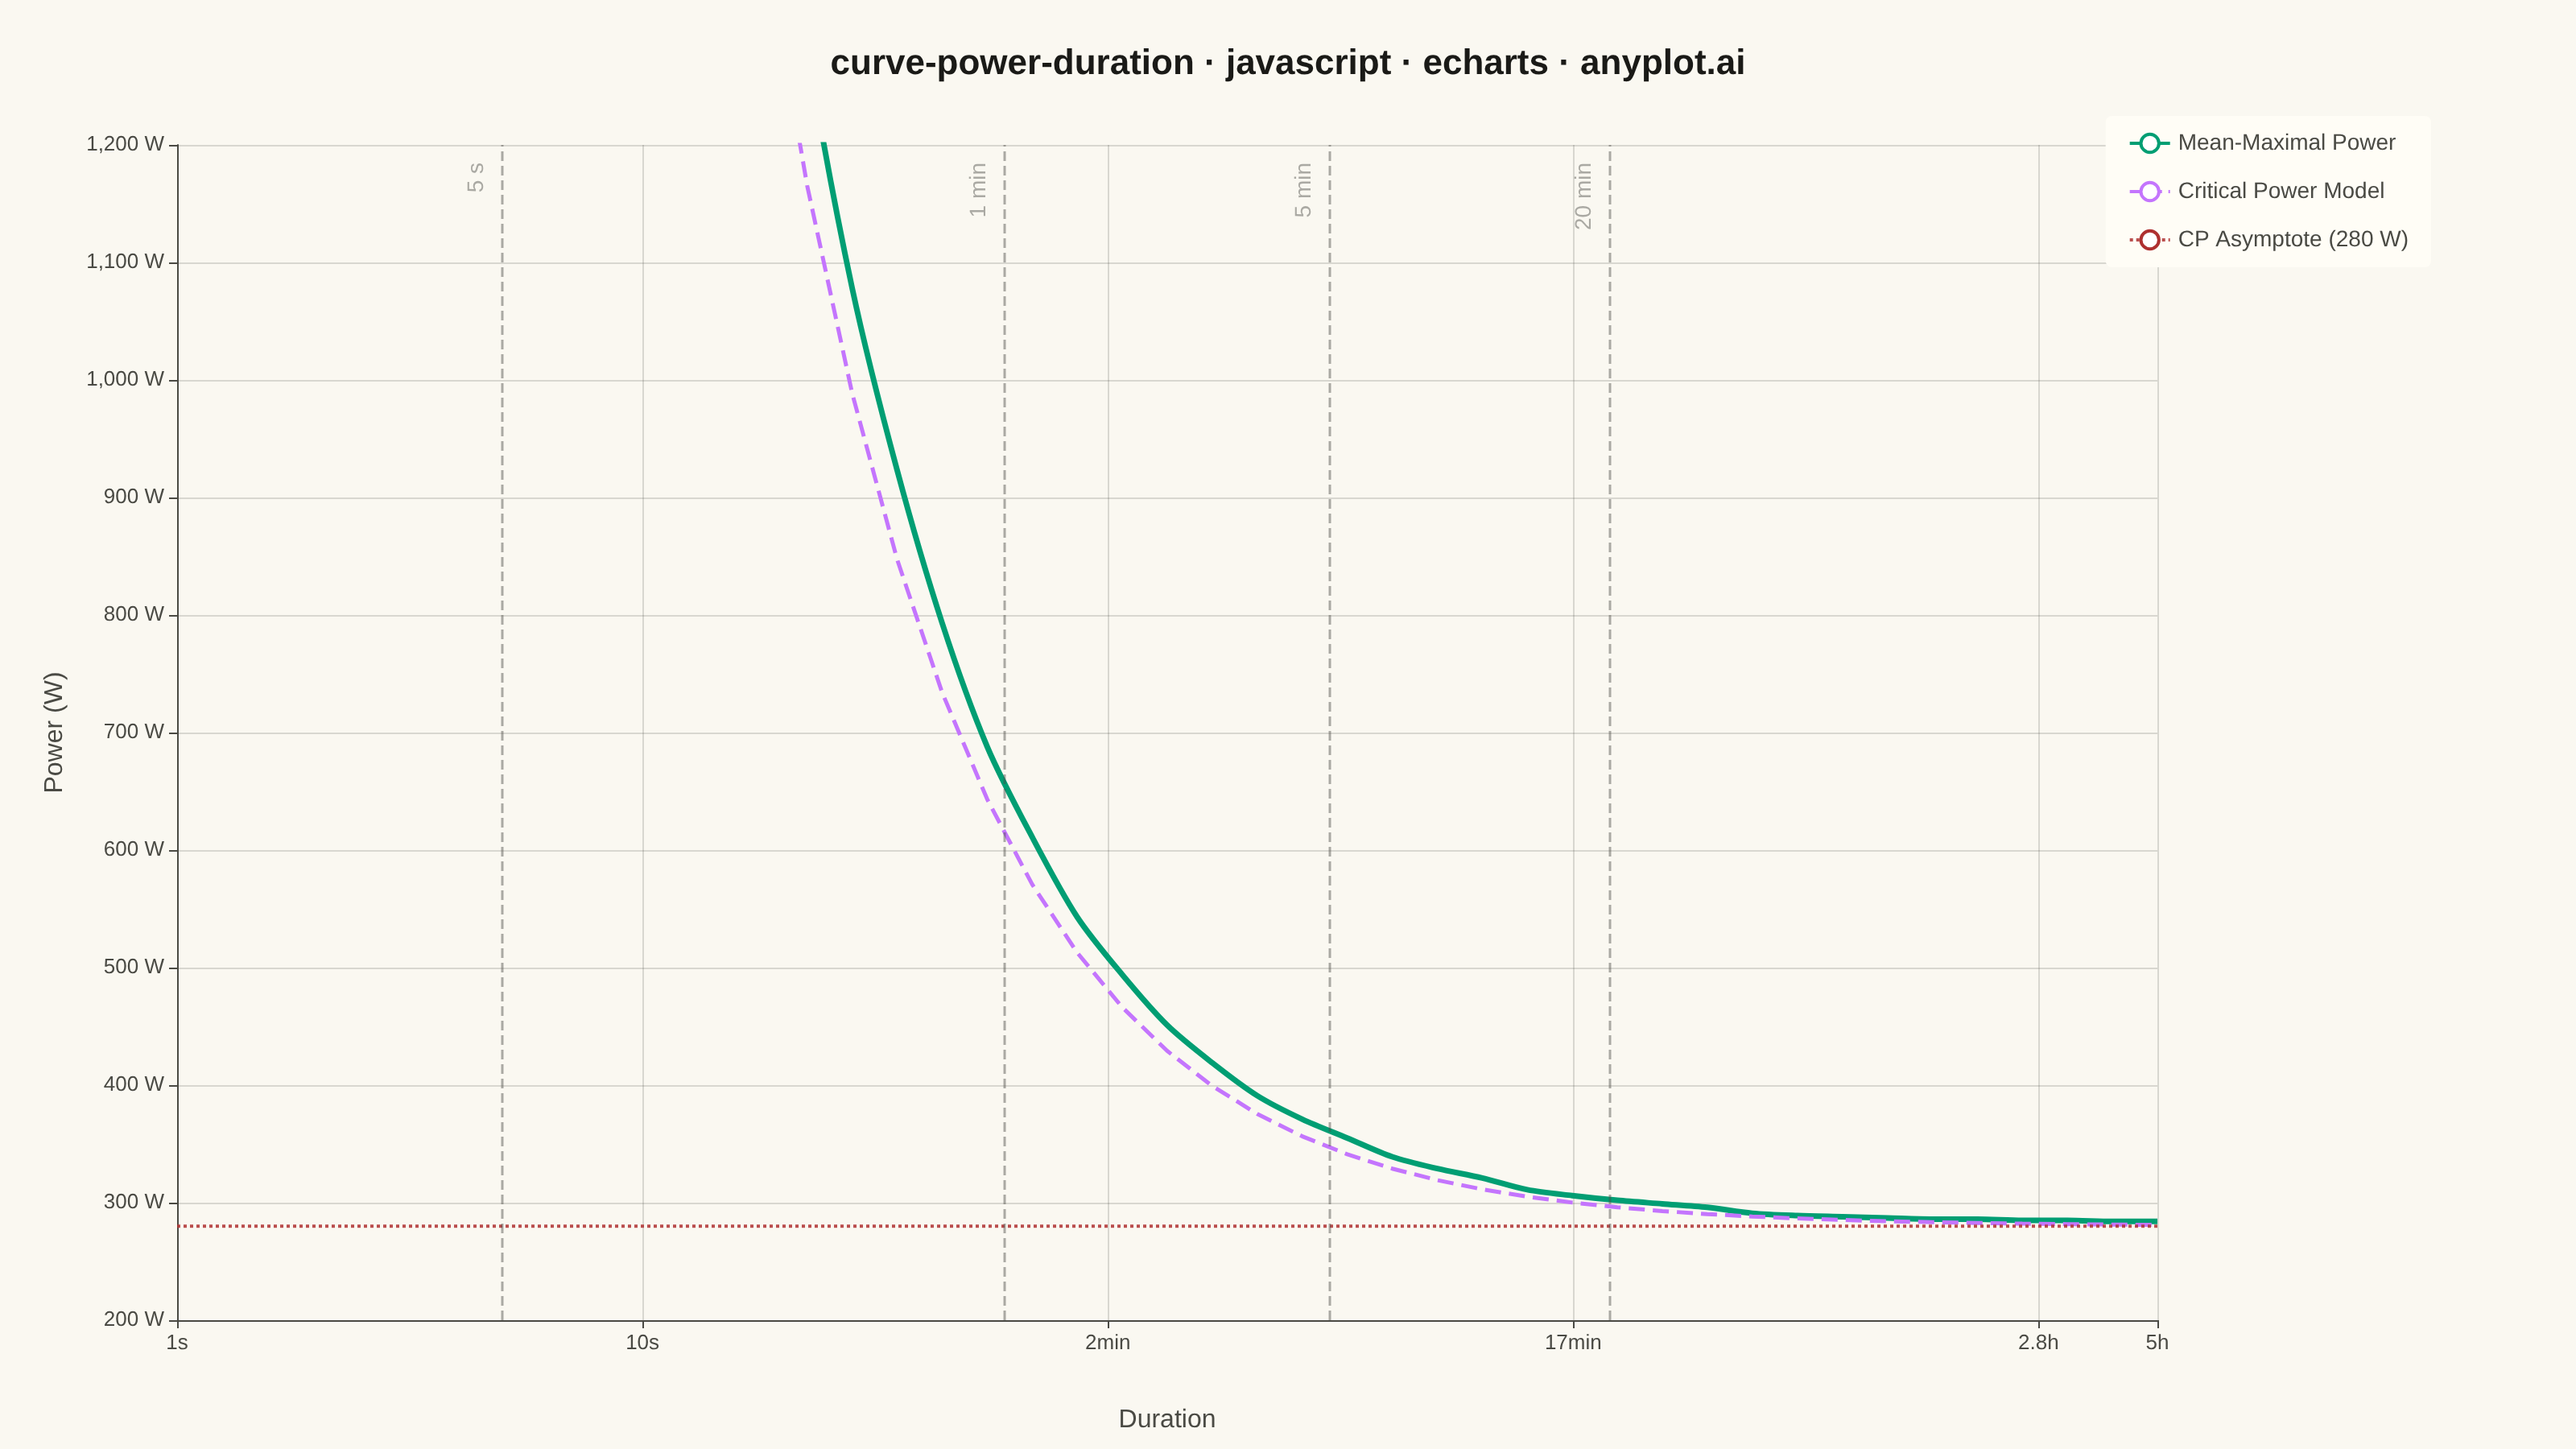
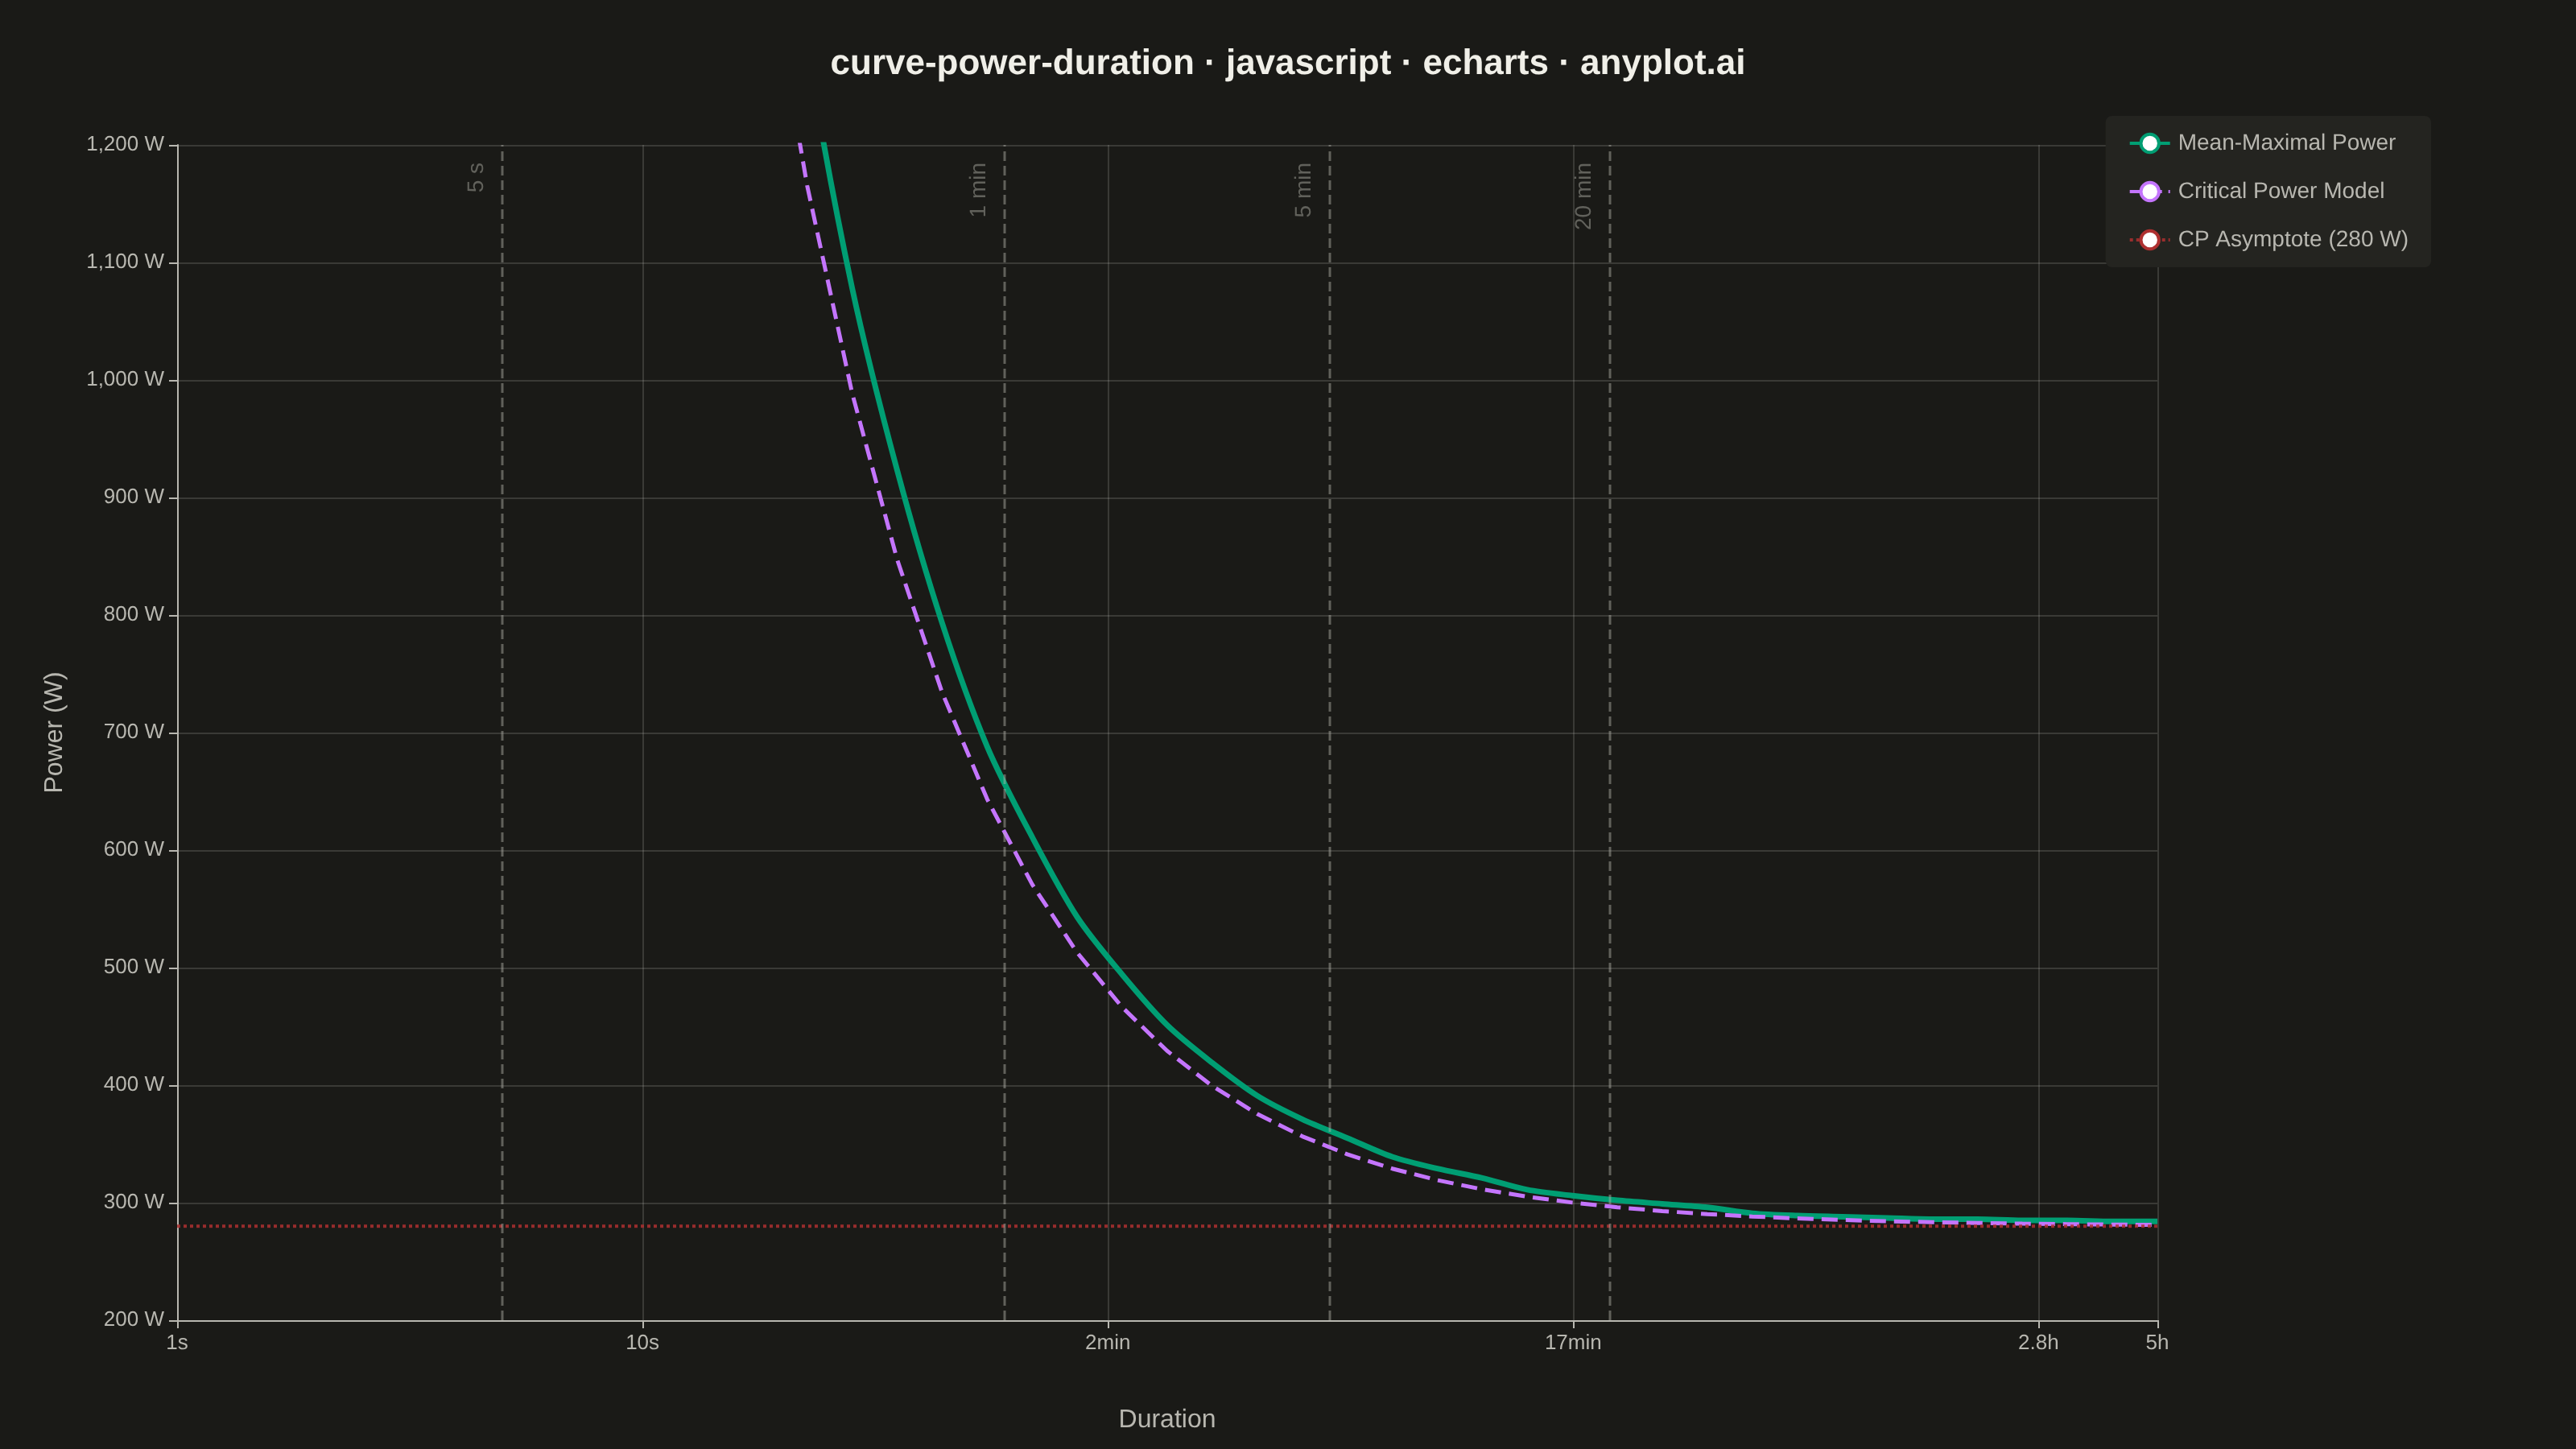
A power duration curve plots an athlete's best mean-maximal power output (watts) against effort duration on a logarithmic time axis spanning roughly 1 second to several hours. Each point answers "what is the highest average power this rider could sustain for exactly this long?", producing a characteristic monotonically decreasing decay curve. A critical power (CP) model is fitted and overlaid, decomposing performance into an aerobic asymptote (CP) and a finite anaerobic work capacity (W′). The chart is a cornerstone of cycling and endurance sports analytics for profiling rider strengths, tracking fitness, and setting training zones.
// anyplot.ai
// curve-power-duration: Mean-Maximal Power Duration Curve
// Library: echarts 5.5.1 | JavaScript 22.22.3
// Quality: 88/100 | Created: 2026-06-13

//# anyplot-orientation: landscape
const t = window.ANYPLOT_TOKENS;

// Synthetic well-trained cyclist: CP = 280 W, W' = 20 000 J
const CP = 280;
const W_PRIME = 20000;

// 45 log-spaced durations: 1 s → 18 000 s (5 h)
const N = 45;
const durations = Array.from({ length: N }, (_, i) =>
  Math.exp((Math.log(18000) / (N - 1)) * i)
);

// Model curve: P(t) = CP + W'/t
const modelData = durations.map(d => [d, CP + W_PRIME / d]);

// Empirical mean-maximal curve — above model at short durations (neuromuscular),
// converges toward CP at long durations. Fixed boosts for reproducibility.
const boostPct = [
  0.21, 0.20, 0.19, 0.18, 0.17, 0.17, 0.16, 0.15, 0.14, 0.14,
  0.13, 0.12, 0.11, 0.11, 0.10, 0.09, 0.09, 0.08, 0.07, 0.07,
  0.06, 0.06, 0.05, 0.05, 0.04, 0.04, 0.04, 0.03, 0.03, 0.03,
  0.02, 0.02, 0.02, 0.02, 0.02, 0.01, 0.01, 0.01, 0.01, 0.01,
  0.01, 0.01, 0.01, 0.01, 0.01
];
let lastP = Infinity;
const empiricalData = durations.map((d, i) => {
  let p = Math.round((CP + W_PRIME / d) * (1 + boostPct[i]));
  p = Math.min(p, lastP);
  lastP = p;
  return [d, p];
});

// Reference duration vertical markers
const refMarkers = [
  { xAxis: 5,    name: '5 s' },
  { xAxis: 60,   name: '1 min' },
  { xAxis: 300,  name: '5 min' },
  { xAxis: 1200, name: '20 min' },
];

const chart = echarts.init(document.getElementById('container'));

chart.setOption({
  animation: false,
  color: t.palette,
  backgroundColor: 'transparent',

  title: {
    text: 'curve-power-duration · javascript · echarts · anyplot.ai',
    left: 'center',
    top: 24,
    textStyle: { color: t.ink, fontSize: 22, fontWeight: 'bold' },
  },

  legend: {
    top: 72,
    right: 90,
    orient: 'vertical',
    textStyle: { color: t.inkSoft, fontSize: 14 },
    itemGap: 16,
    backgroundColor: t.elevatedBg,
    borderRadius: 4,
    padding: [10, 14],
  },

  grid: { left: 110, right: 260, top: 90, bottom: 80 },

  xAxis: {
    type: 'log',
    min: 1,
    max: 18000,
    name: 'Duration',
    nameLocation: 'middle',
    nameGap: 54,
    nameTextStyle: { color: t.inkSoft, fontSize: 16 },
    axisLabel: {
      color: t.inkSoft,
      fontSize: 13,
      formatter: function (val) {
        const v = Math.round(val);
        if (v < 60) return v + 's';
        if (v < 3600) return Math.round(v / 60) + 'min';
        return (v / 3600).toFixed(1).replace('.0', '') + 'h';
      },
    },
    axisLine: { lineStyle: { color: t.inkSoft } },
    axisTick: { lineStyle: { color: t.inkSoft } },
    splitLine: { lineStyle: { color: t.grid } },
  },

  yAxis: {
    type: 'value',
    min: 200,
    max: 1200,
    interval: 100,
    name: 'Power (W)',
    nameLocation: 'middle',
    nameGap: 68,
    nameTextStyle: { color: t.inkSoft, fontSize: 16 },
    axisLabel: {
      color: t.inkSoft,
      fontSize: 13,
      formatter: '{value} W',
    },
    axisLine: { lineStyle: { color: t.inkSoft } },
    axisTick: { lineStyle: { color: t.inkSoft } },
    splitLine: { lineStyle: { color: t.grid } },
  },

  series: [
    {
      name: 'Mean-Maximal Power',
      type: 'line',
      data: empiricalData,
      smooth: 0.3,
      showSymbol: false,
      lineStyle: { width: 3.5, color: t.palette[0] },
      itemStyle: { color: t.palette[0] },
      markLine: {
        silent: true,
        symbol: ['none', 'none'],
        label: {
          position: 'insideEndTop',
          color: t.inkSoft,
          fontSize: 14,
          formatter: '{b}',
          padding: [4, 6],
        },
        lineStyle: { type: 'dashed', color: t.inkSoft, opacity: 0.45, width: 1.5 },
        data: refMarkers,
      },
    },
    {
      name: 'Critical Power Model',
      type: 'line',
      data: modelData,
      smooth: false,
      showSymbol: false,
      lineStyle: { width: 2.5, type: 'dashed', color: t.palette[1] },
      itemStyle: { color: t.palette[1] },
    },
    {
      name: 'CP Asymptote (280 W)',
      type: 'line',
      data: [[1, CP], [18000, CP]],
      showSymbol: false,
      lineStyle: { width: 2.0, type: 'dotted', color: t.palette[4], opacity: 0.85 },
      itemStyle: { color: t.palette[4] },
    },
  ],
});
Runnable source as JSON, for any HTTP client: https://api.anyplot.ai/specs/curve-power-duration/echarts/code. Any spec id and library id listed in llms-full.txt fit the same URL shape; every URL below is complete and callable.
{
  "spec_id": "curve-power-duration",
  "language": "javascript",
  "library": "echarts",
  "page": "https://anyplot.ai/curve-power-duration/javascript/echarts",
  "hub": "https://anyplot.ai/curve-power-duration",
  "code_json": "https://api.anyplot.ai/specs/curve-power-duration/echarts/code",
  "spec_json": "https://api.anyplot.ai/specs/curve-power-duration",
  "render_light_png": "https://storage.googleapis.com/anyplot-images/plots/curve-power-duration/javascript/echarts/plot-light.png",
  "render_dark_png": "https://storage.googleapis.com/anyplot-images/plots/curve-power-duration/javascript/echarts/plot-dark.png",
  "interactive_light_html": "https://storage.googleapis.com/anyplot-images/plots/curve-power-duration/javascript/echarts/plot-light.html",
  "interactive_dark_html": "https://storage.googleapis.com/anyplot-images/plots/curve-power-duration/javascript/echarts/plot-dark.html",
  "quality_score": 88.0,
  "license": "MIT",
  "guide": "https://anyplot.ai/llms.txt"
}
Part of Mean-Maximal Power Duration Curve on anyplot.ai.