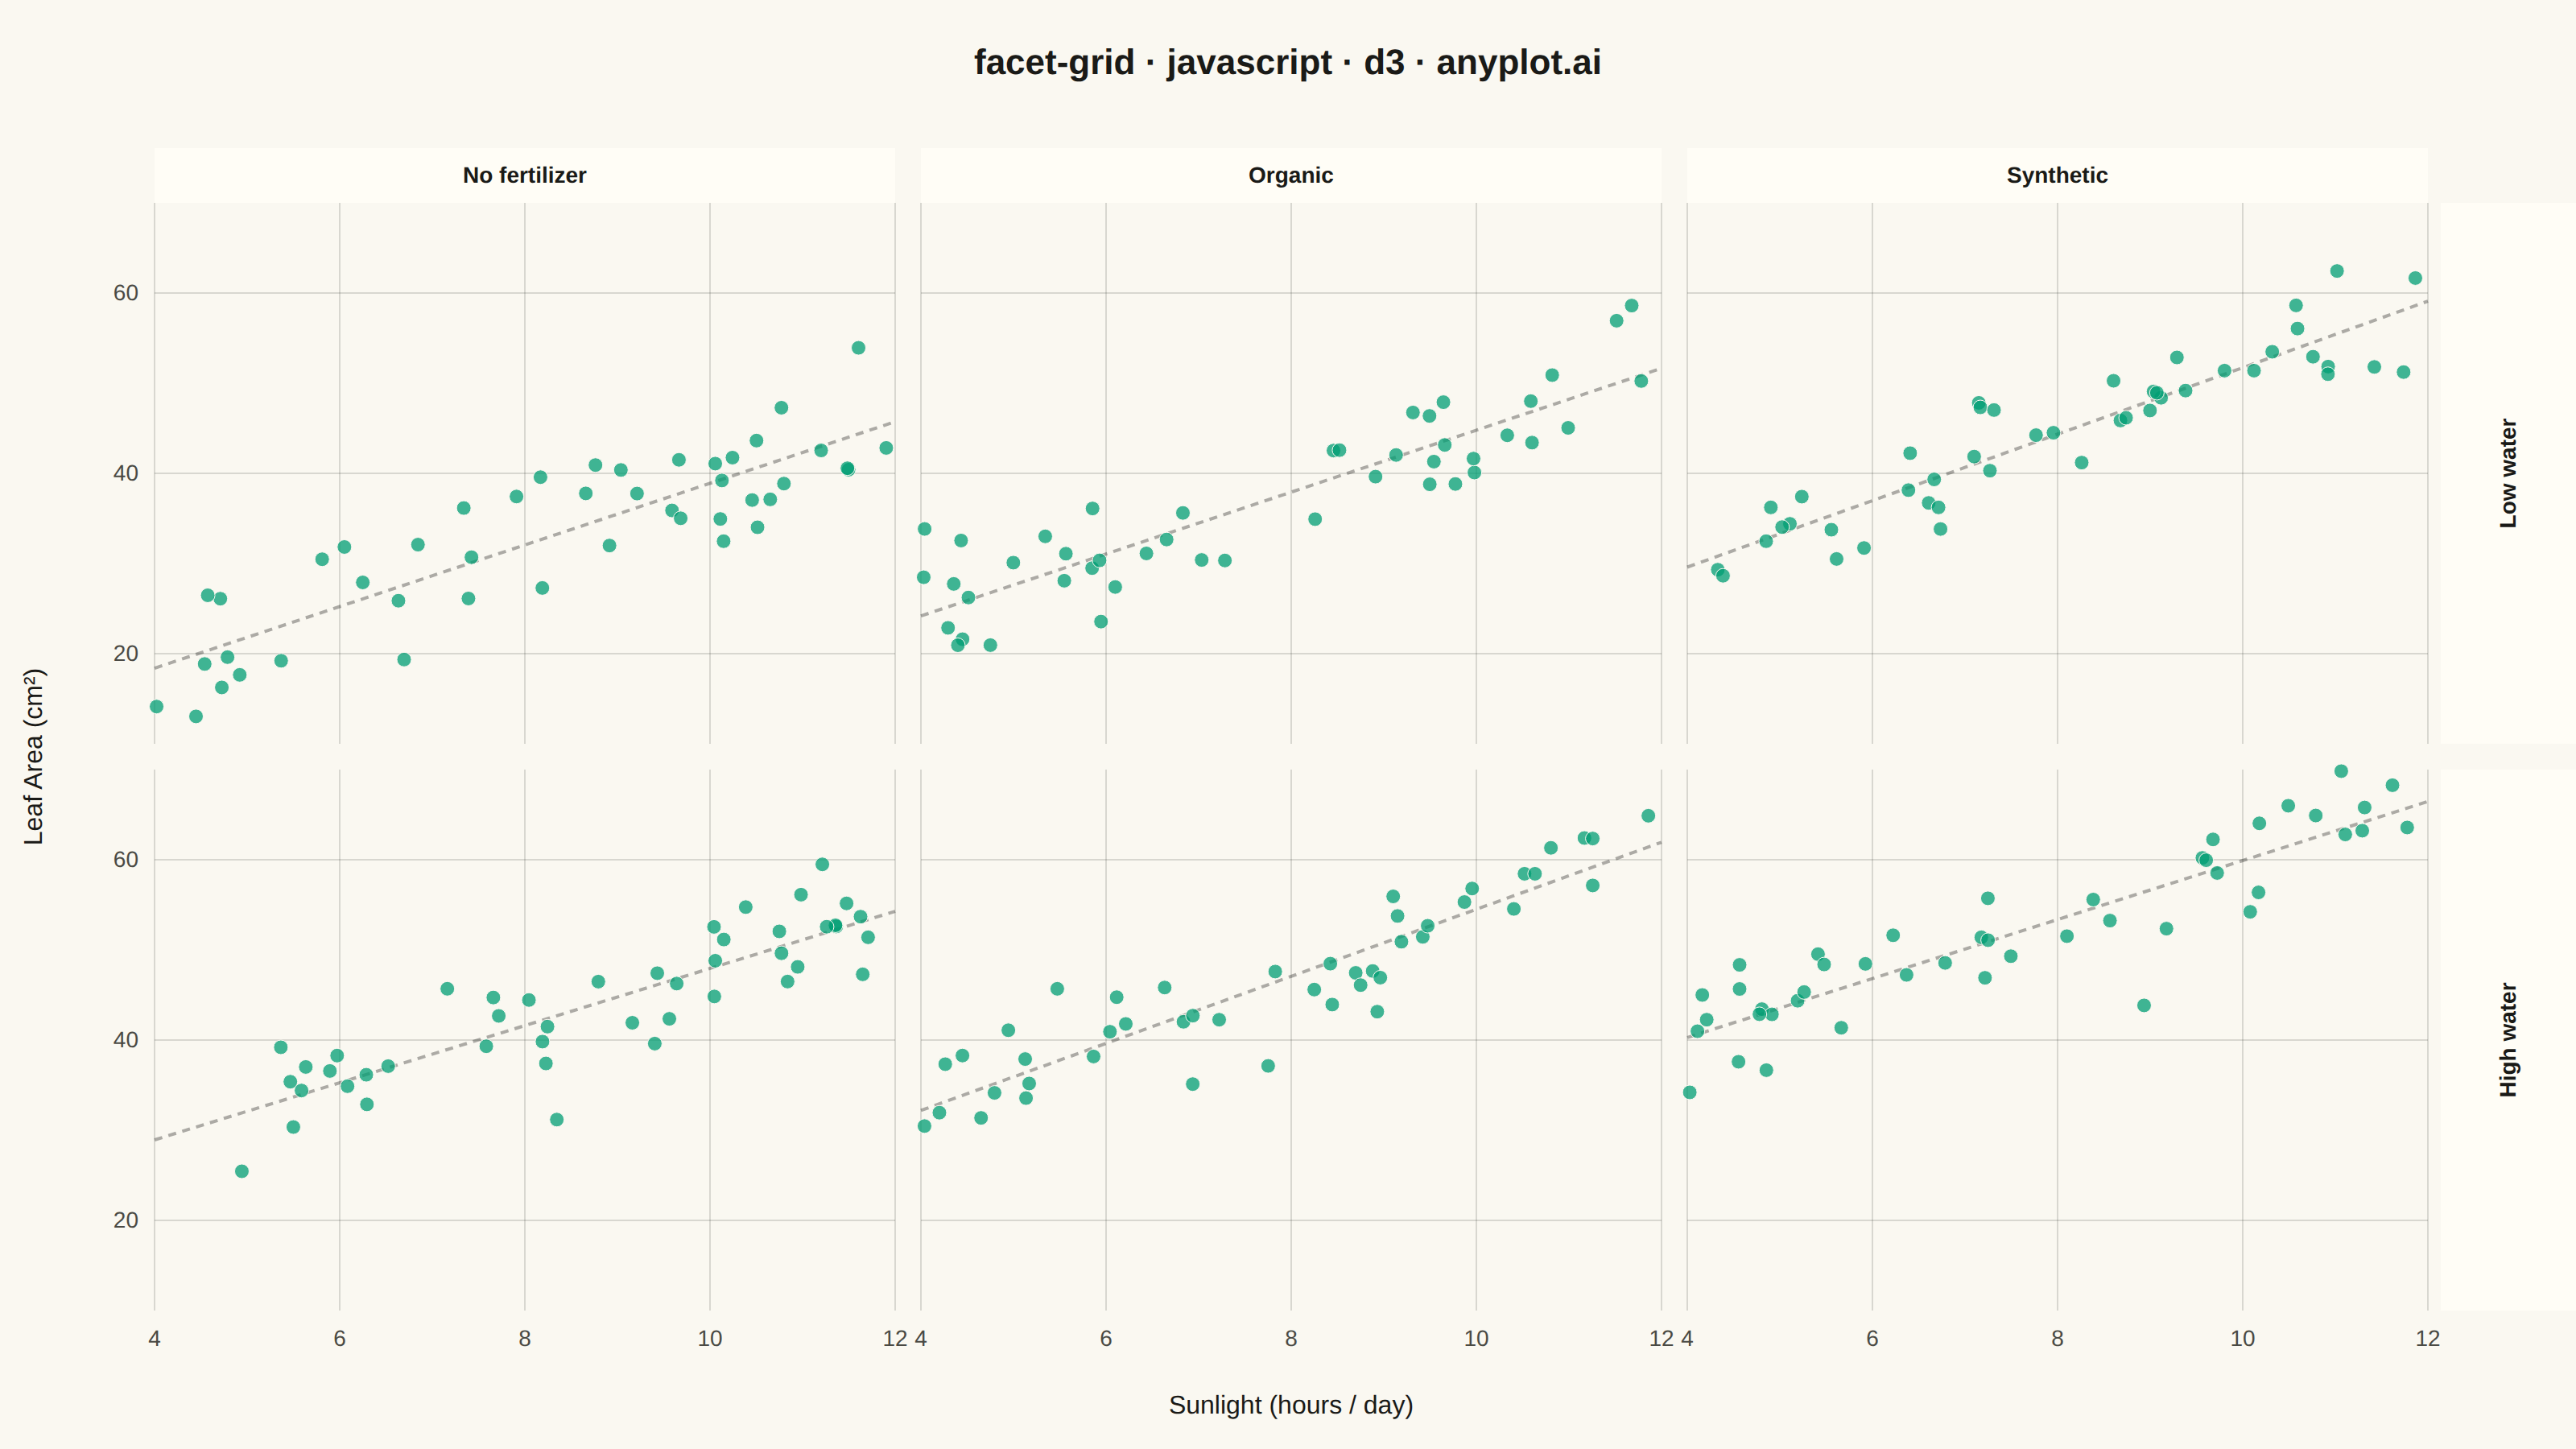
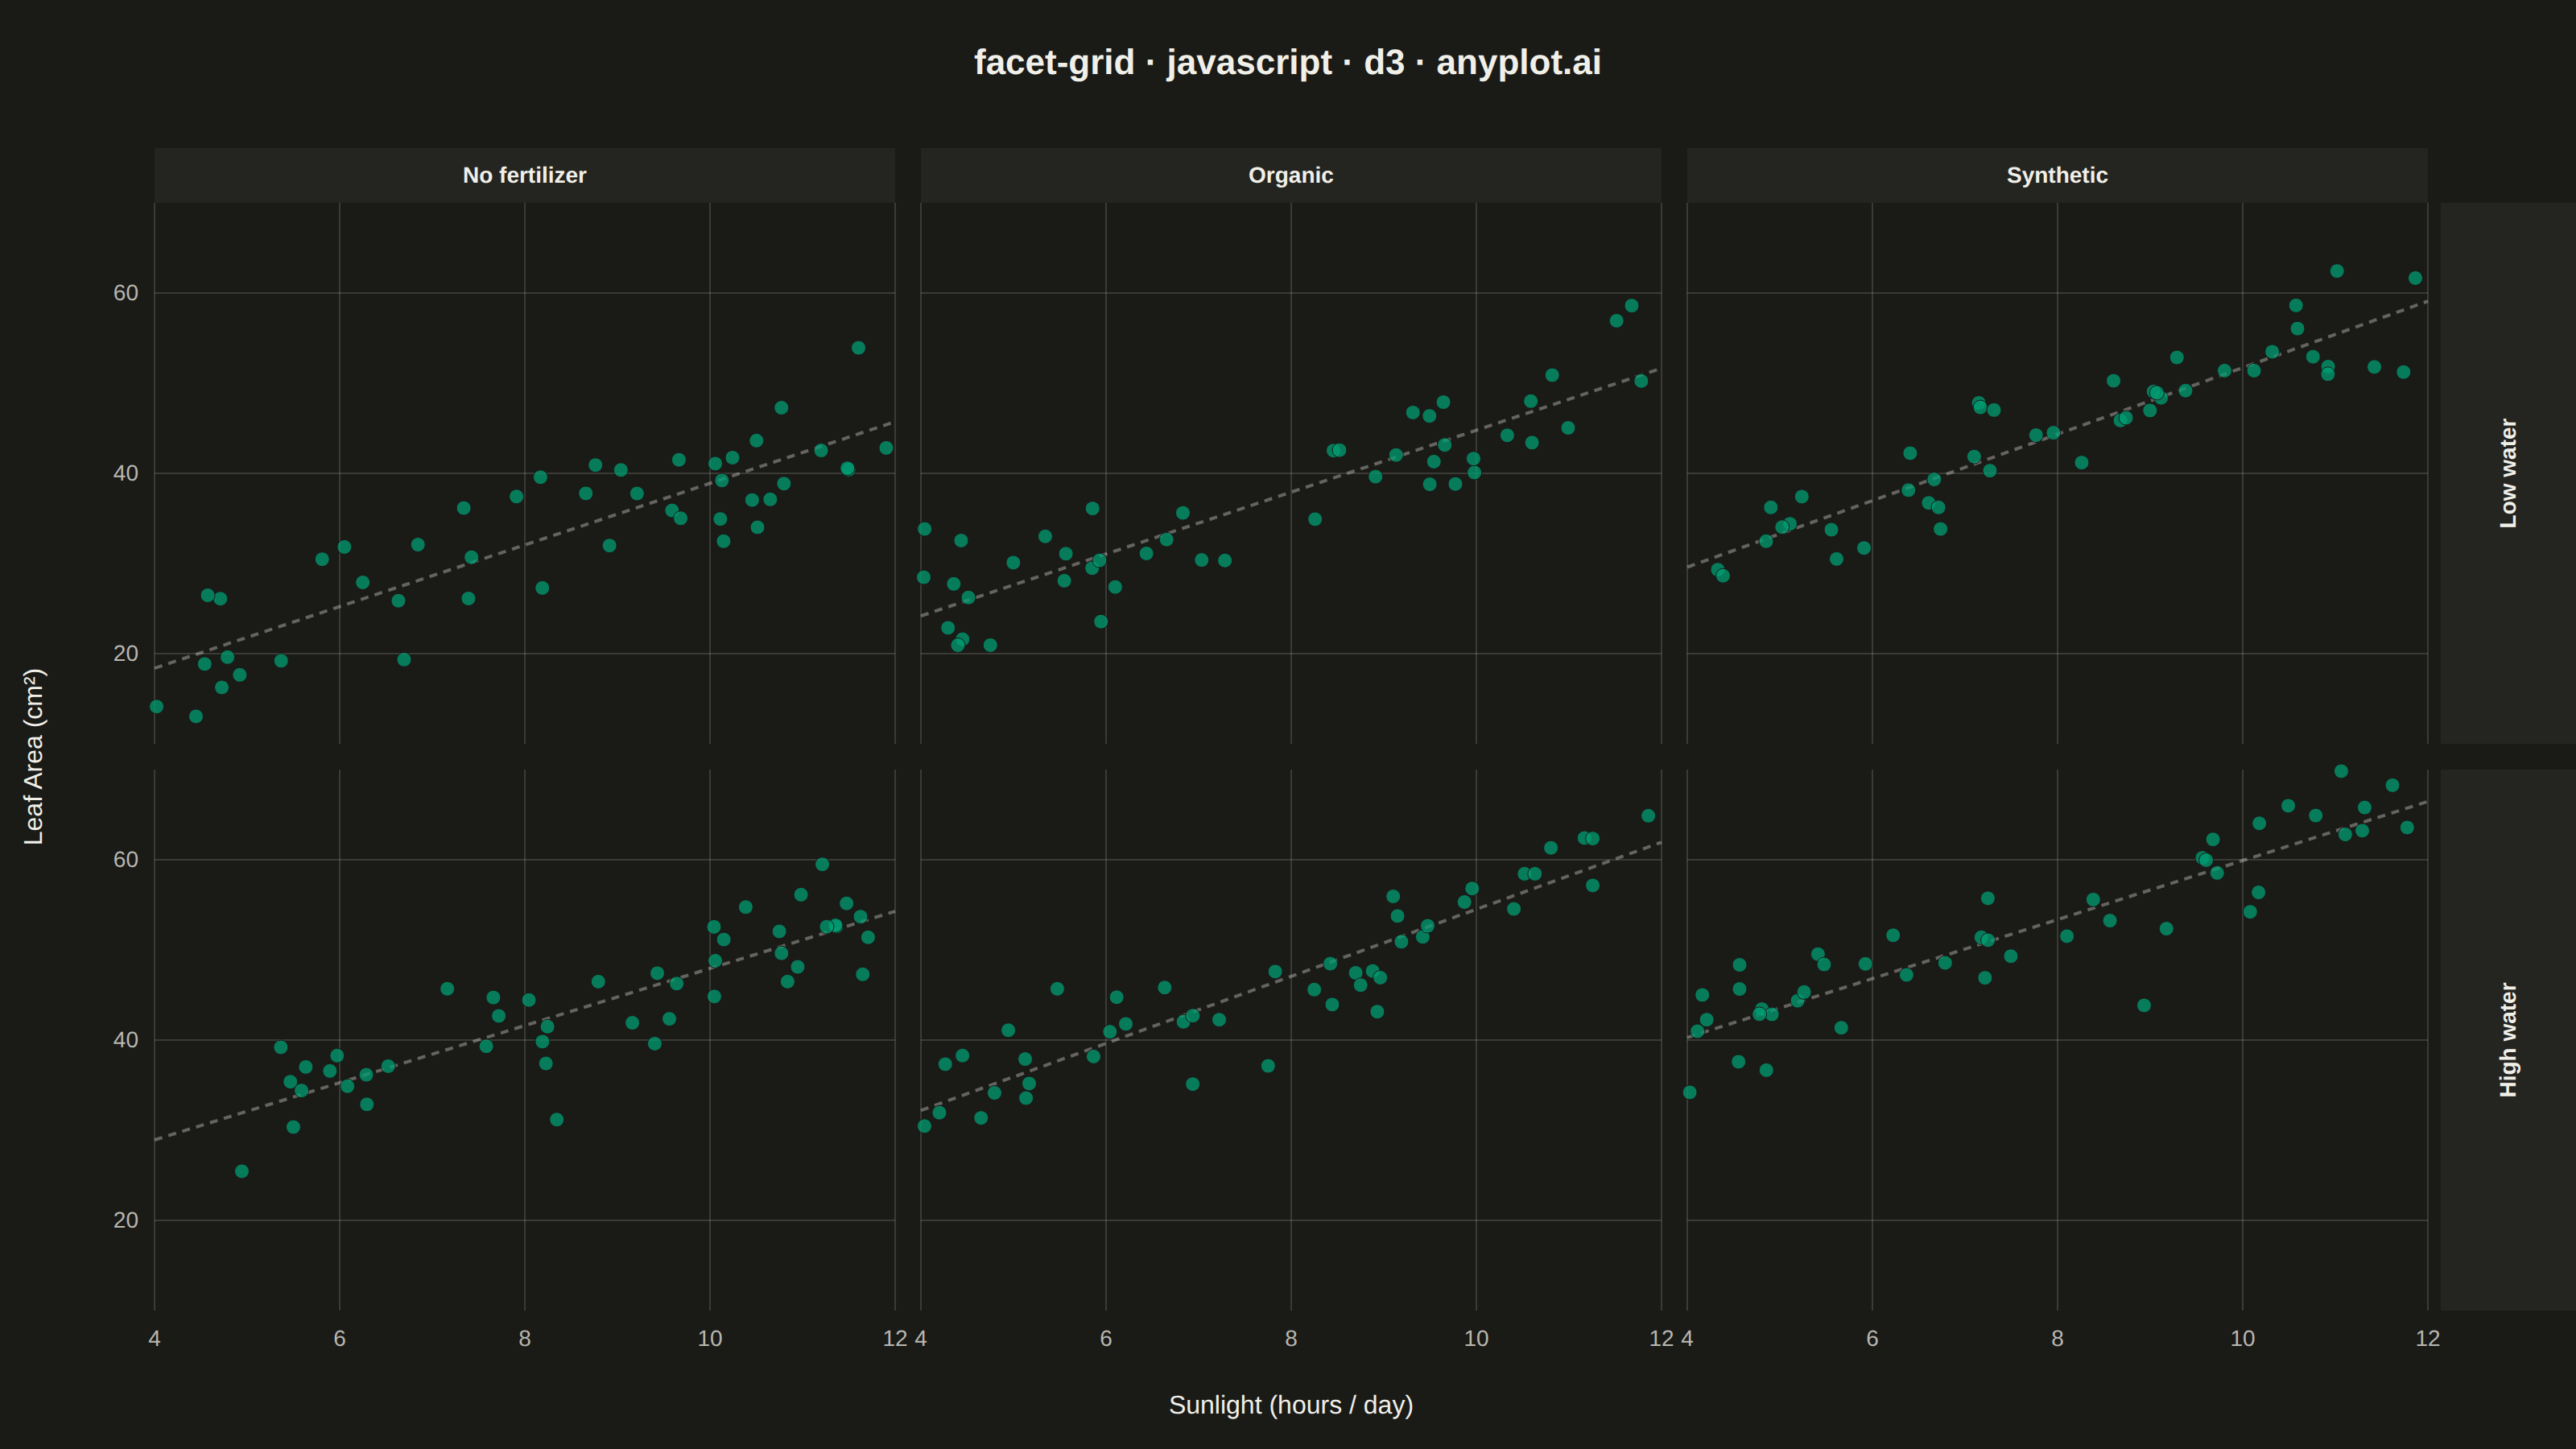
The same plot in 14 other libraries — JavaScript: Chart.js, Apache ECharts, Highcharts, MUI X Charts; Python: Altair, Bokeh, lets-plot, Matplotlib, Plotly, plotnine, Pygal, Seaborn; R: ggplot2; Julia: Makie.jl. Compare all 15 side by side: Faceted Grid Plot in Python, R, Julia and JavaScript.
A grid of subplots where each cell shows the same type of plot for a different subset of data, split by one or two categorical variables. Enables systematic comparison across multiple dimensions.
// anyplot.ai
// facet-grid: Faceted Grid Plot
// Library: d3 7.9.0 | JavaScript 22.23.2
// Quality: 88/100 | Created: 2026-09-05

//# anyplot-orientation: landscape
const t = window.ANYPLOT_TOKENS;
const { width, height } = window.ANYPLOT_SIZE;

// --- Data (in-memory, deterministic LCG PRNG) -------------------------------
function makeLcg(seed) {
  let state = seed >>> 0;
  return () => {
    state = (1103515245 * state + 12345) & 0x7fffffff;
    return state / 0x7fffffff;
  };
}
const rand = makeLcg(42);
const randNormal = () => {
  const u1 = Math.max(rand(), 1e-9);
  const u2 = rand();
  return Math.sqrt(-2 * Math.log(u1)) * Math.cos(2 * Math.PI * u2);
};

const waterLevels = ["Low water", "High water"];
const fertilizers = ["No fertilizer", "Organic", "Synthetic"];
const waterEffect = { "Low water": 0, "High water": 9 };
const fertEffect = { "No fertilizer": 0, Organic: 6, Synthetic: 12 };
const pointsPerFacet = 45;

const data = [];
for (const water of waterLevels) {
  for (const fert of fertilizers) {
    for (let i = 0; i < pointsPerFacet; i++) {
      const sunlightHours = 4 + rand() * 8;
      const noise = randNormal() * 4;
      const leafAreaCm2 = Math.max(
        4,
        18 + waterEffect[water] + fertEffect[fert] + 3.4 * (sunlightHours - 4) + noise,
      );
      data.push({ water, fert, sunlightHours, leafAreaCm2 });
    }
  }
}

// --- Layout -------------------------------------------------------------
const margin = { top: 92, right: 92, bottom: 86, left: 96 };
const stripTop = 34;
const cellGap = 16;
const nCols = fertilizers.length;
const nRows = waterLevels.length;

const gridLeft = margin.left;
const gridTop = margin.top + stripTop;
const gridWidth = width - margin.left - margin.right;
const gridHeight = height - margin.top - stripTop - margin.bottom;
const cellWidth = (gridWidth - (nCols - 1) * cellGap) / nCols;
const cellHeight = (gridHeight - (nRows - 1) * cellGap) / nRows;

// --- Shared scales (same axes across every facet) ---------------------------
const x = d3
  .scaleLinear()
  .domain(d3.extent(data, (d) => d.sunlightHours))
  .nice()
  .range([0, cellWidth]);
const y = d3
  .scaleLinear()
  .domain(d3.extent(data, (d) => d.leafAreaCm2))
  .nice()
  .range([cellHeight, 0]);
const xTicks = x.ticks(4);
const yTicks = y.ticks(4);

// --- Per-facet linear trend (reinforces the sunlight→leaf-area story) -------
function trendLine(points) {
  const n = points.length;
  const sumX = d3.sum(points, (d) => d.sunlightHours);
  const sumY = d3.sum(points, (d) => d.leafAreaCm2);
  const sumXY = d3.sum(points, (d) => d.sunlightHours * d.leafAreaCm2);
  const sumXX = d3.sum(points, (d) => d.sunlightHours * d.sunlightHours);
  const slope = (n * sumXY - sumX * sumY) / (n * sumXX - sumX * sumX);
  const intercept = (sumY - slope * sumX) / n;
  const [x0, x1] = x.domain();
  return [
    { sunlightHours: x0, leafAreaCm2: slope * x0 + intercept },
    { sunlightHours: x1, leafAreaCm2: slope * x1 + intercept },
  ];
}
const trendPath = d3
  .line()
  .x((d) => x(d.sunlightHours))
  .y((d) => y(d.leafAreaCm2));

// --- SVG mount ----------------------------------------------------------
const svg = d3.select("#container").append("svg").attr("width", width).attr("height", height);

// --- Title ----------------------------------------------------------------
svg
  .append("text")
  .attr("x", width / 2)
  .attr("y", 46)
  .attr("text-anchor", "middle")
  .attr("fill", t.ink)
  .style("font-size", "22px")
  .style("font-weight", "600")
  .text("facet-grid · javascript · d3 · anyplot.ai");

// --- Shared axis titles -----------------------------------------------------
svg
  .append("text")
  .attr("x", gridLeft + gridWidth / 2)
  .attr("y", height - 22)
  .attr("text-anchor", "middle")
  .attr("fill", t.ink)
  .style("font-size", "16px")
  .text("Sunlight (hours / day)");

svg
  .append("text")
  .attr("x", 26)
  .attr("y", gridTop + gridHeight / 2)
  .attr("text-anchor", "middle")
  .attr("fill", t.ink)
  .style("font-size", "16px")
  .attr("transform", `rotate(-90, 26, ${gridTop + gridHeight / 2})`)
  .text("Leaf Area (cm²)");

// --- Column facet strips (fertilizer) ----------------------------------------
fertilizers.forEach((fert, c) => {
  const cx = gridLeft + c * (cellWidth + cellGap);
  svg
    .append("rect")
    .attr("x", cx)
    .attr("y", margin.top)
    .attr("width", cellWidth)
    .attr("height", stripTop)
    .attr("fill", t.elevatedBg);
  svg
    .append("text")
    .attr("x", cx + cellWidth / 2)
    .attr("y", margin.top + stripTop / 2)
    .attr("dy", "0.32em")
    .attr("text-anchor", "middle")
    .attr("fill", t.ink)
    .style("font-size", "14px")
    .style("font-weight", "600")
    .text(fert);
});

// --- Row facet strips (water regime) -----------------------------------------
const rowStripX = gridLeft + gridWidth + 8;
const rowStripWidth = margin.right - 8;
waterLevels.forEach((water, r) => {
  const cy = gridTop + r * (cellHeight + cellGap);
  svg
    .append("rect")
    .attr("x", rowStripX)
    .attr("y", cy)
    .attr("width", rowStripWidth)
    .attr("height", cellHeight)
    .attr("fill", t.elevatedBg);
  svg
    .append("text")
    .attr("x", rowStripX + rowStripWidth / 2)
    .attr("y", cy + cellHeight / 2)
    .attr("dy", "0.32em")
    .attr("text-anchor", "middle")
    .attr("fill", t.ink)
    .style("font-size", "14px")
    .style("font-weight", "600")
    .attr(
      "transform",
      `rotate(-90, ${rowStripX + rowStripWidth / 2}, ${cy + cellHeight / 2})`,
    )
    .text(water);
});

// --- Facet panels (scatter cells) --------------------------------------------
waterLevels.forEach((water, r) => {
  fertilizers.forEach((fert, c) => {
    const cellX = gridLeft + c * (cellWidth + cellGap);
    const cellY = gridTop + r * (cellHeight + cellGap);
    const cell = svg.append("g").attr("transform", `translate(${cellX},${cellY})`);

    // shared gridlines
    cell
      .selectAll(".gridline-y")
      .data(yTicks)
      .join("line")
      .attr("x1", 0)
      .attr("x2", cellWidth)
      .attr("y1", (d) => y(d))
      .attr("y2", (d) => y(d))
      .attr("stroke", t.grid);
    cell
      .selectAll(".gridline-x")
      .data(xTicks)
      .join("line")
      .attr("y1", 0)
      .attr("y2", cellHeight)
      .attr("x1", (d) => x(d))
      .attr("x2", (d) => x(d))
      .attr("stroke", t.grid);

    // tick labels only on the outer edges (declutters the grid, scales stay shared)
    if (r === nRows - 1) {
      cell
        .selectAll(".xtick")
        .data(xTicks)
        .join("text")
        .attr("x", (d) => x(d))
        .attr("y", cellHeight + 22)
        .attr("text-anchor", "middle")
        .attr("fill", t.inkSoft)
        .style("font-size", "14px")
        .text((d) => d);
    }
    if (c === 0) {
      cell
        .selectAll(".ytick")
        .data(yTicks)
        .join("text")
        .attr("x", -10)
        .attr("y", (d) => y(d))
        .attr("dy", "0.32em")
        .attr("text-anchor", "end")
        .attr("fill", t.inkSoft)
        .style("font-size", "14px")
        .text((d) => d);
    }

    // shared-slope trend line (reinforces the sunlight -> leaf-area story per facet)
    const facetData = data.filter((d) => d.water === water && d.fert === fert);
    cell
      .append("path")
      .datum(trendLine(facetData))
      .attr("d", trendPath)
      .attr("fill", "none")
      .attr("stroke", t.ink)
      .attr("stroke-opacity", 0.35)
      .attr("stroke-width", 2)
      .attr("stroke-dasharray", "5,4");

    // scatter points
    cell
      .selectAll("circle")
      .data(facetData)
      .join("circle")
      .attr("cx", (d) => x(d.sunlightHours))
      .attr("cy", (d) => y(d.leafAreaCm2))
      .attr("r", 4.5)
      .attr("fill", t.palette[0])
      .attr("fill-opacity", 0.75)
      .attr("stroke", t.pageBg)
      .attr("stroke-width", 0.5);
  });
});
Runnable source as JSON, for any HTTP client: https://api.anyplot.ai/specs/facet-grid/d3/code. Any spec id and library id listed in llms-full.txt fit the same URL shape; every URL below is complete and callable.
{
  "spec_id": "facet-grid",
  "language": "javascript",
  "library": "d3",
  "page": "https://anyplot.ai/facet-grid/javascript/d3",
  "hub": "https://anyplot.ai/facet-grid",
  "code_json": "https://api.anyplot.ai/specs/facet-grid/d3/code",
  "spec_json": "https://api.anyplot.ai/specs/facet-grid",
  "render_light_png": "https://storage.googleapis.com/anyplot-images/plots/facet-grid/javascript/d3/plot-light.png",
  "render_dark_png": "https://storage.googleapis.com/anyplot-images/plots/facet-grid/javascript/d3/plot-dark.png",
  "interactive_light_html": "https://storage.googleapis.com/anyplot-images/plots/facet-grid/javascript/d3/plot-light.html",
  "interactive_dark_html": "https://storage.googleapis.com/anyplot-images/plots/facet-grid/javascript/d3/plot-dark.html",
  "quality_score": 88.0,
  "license": "MIT",
  "guide": "https://anyplot.ai/llms.txt"
}
Part of Faceted Grid Plot on anyplot.ai.