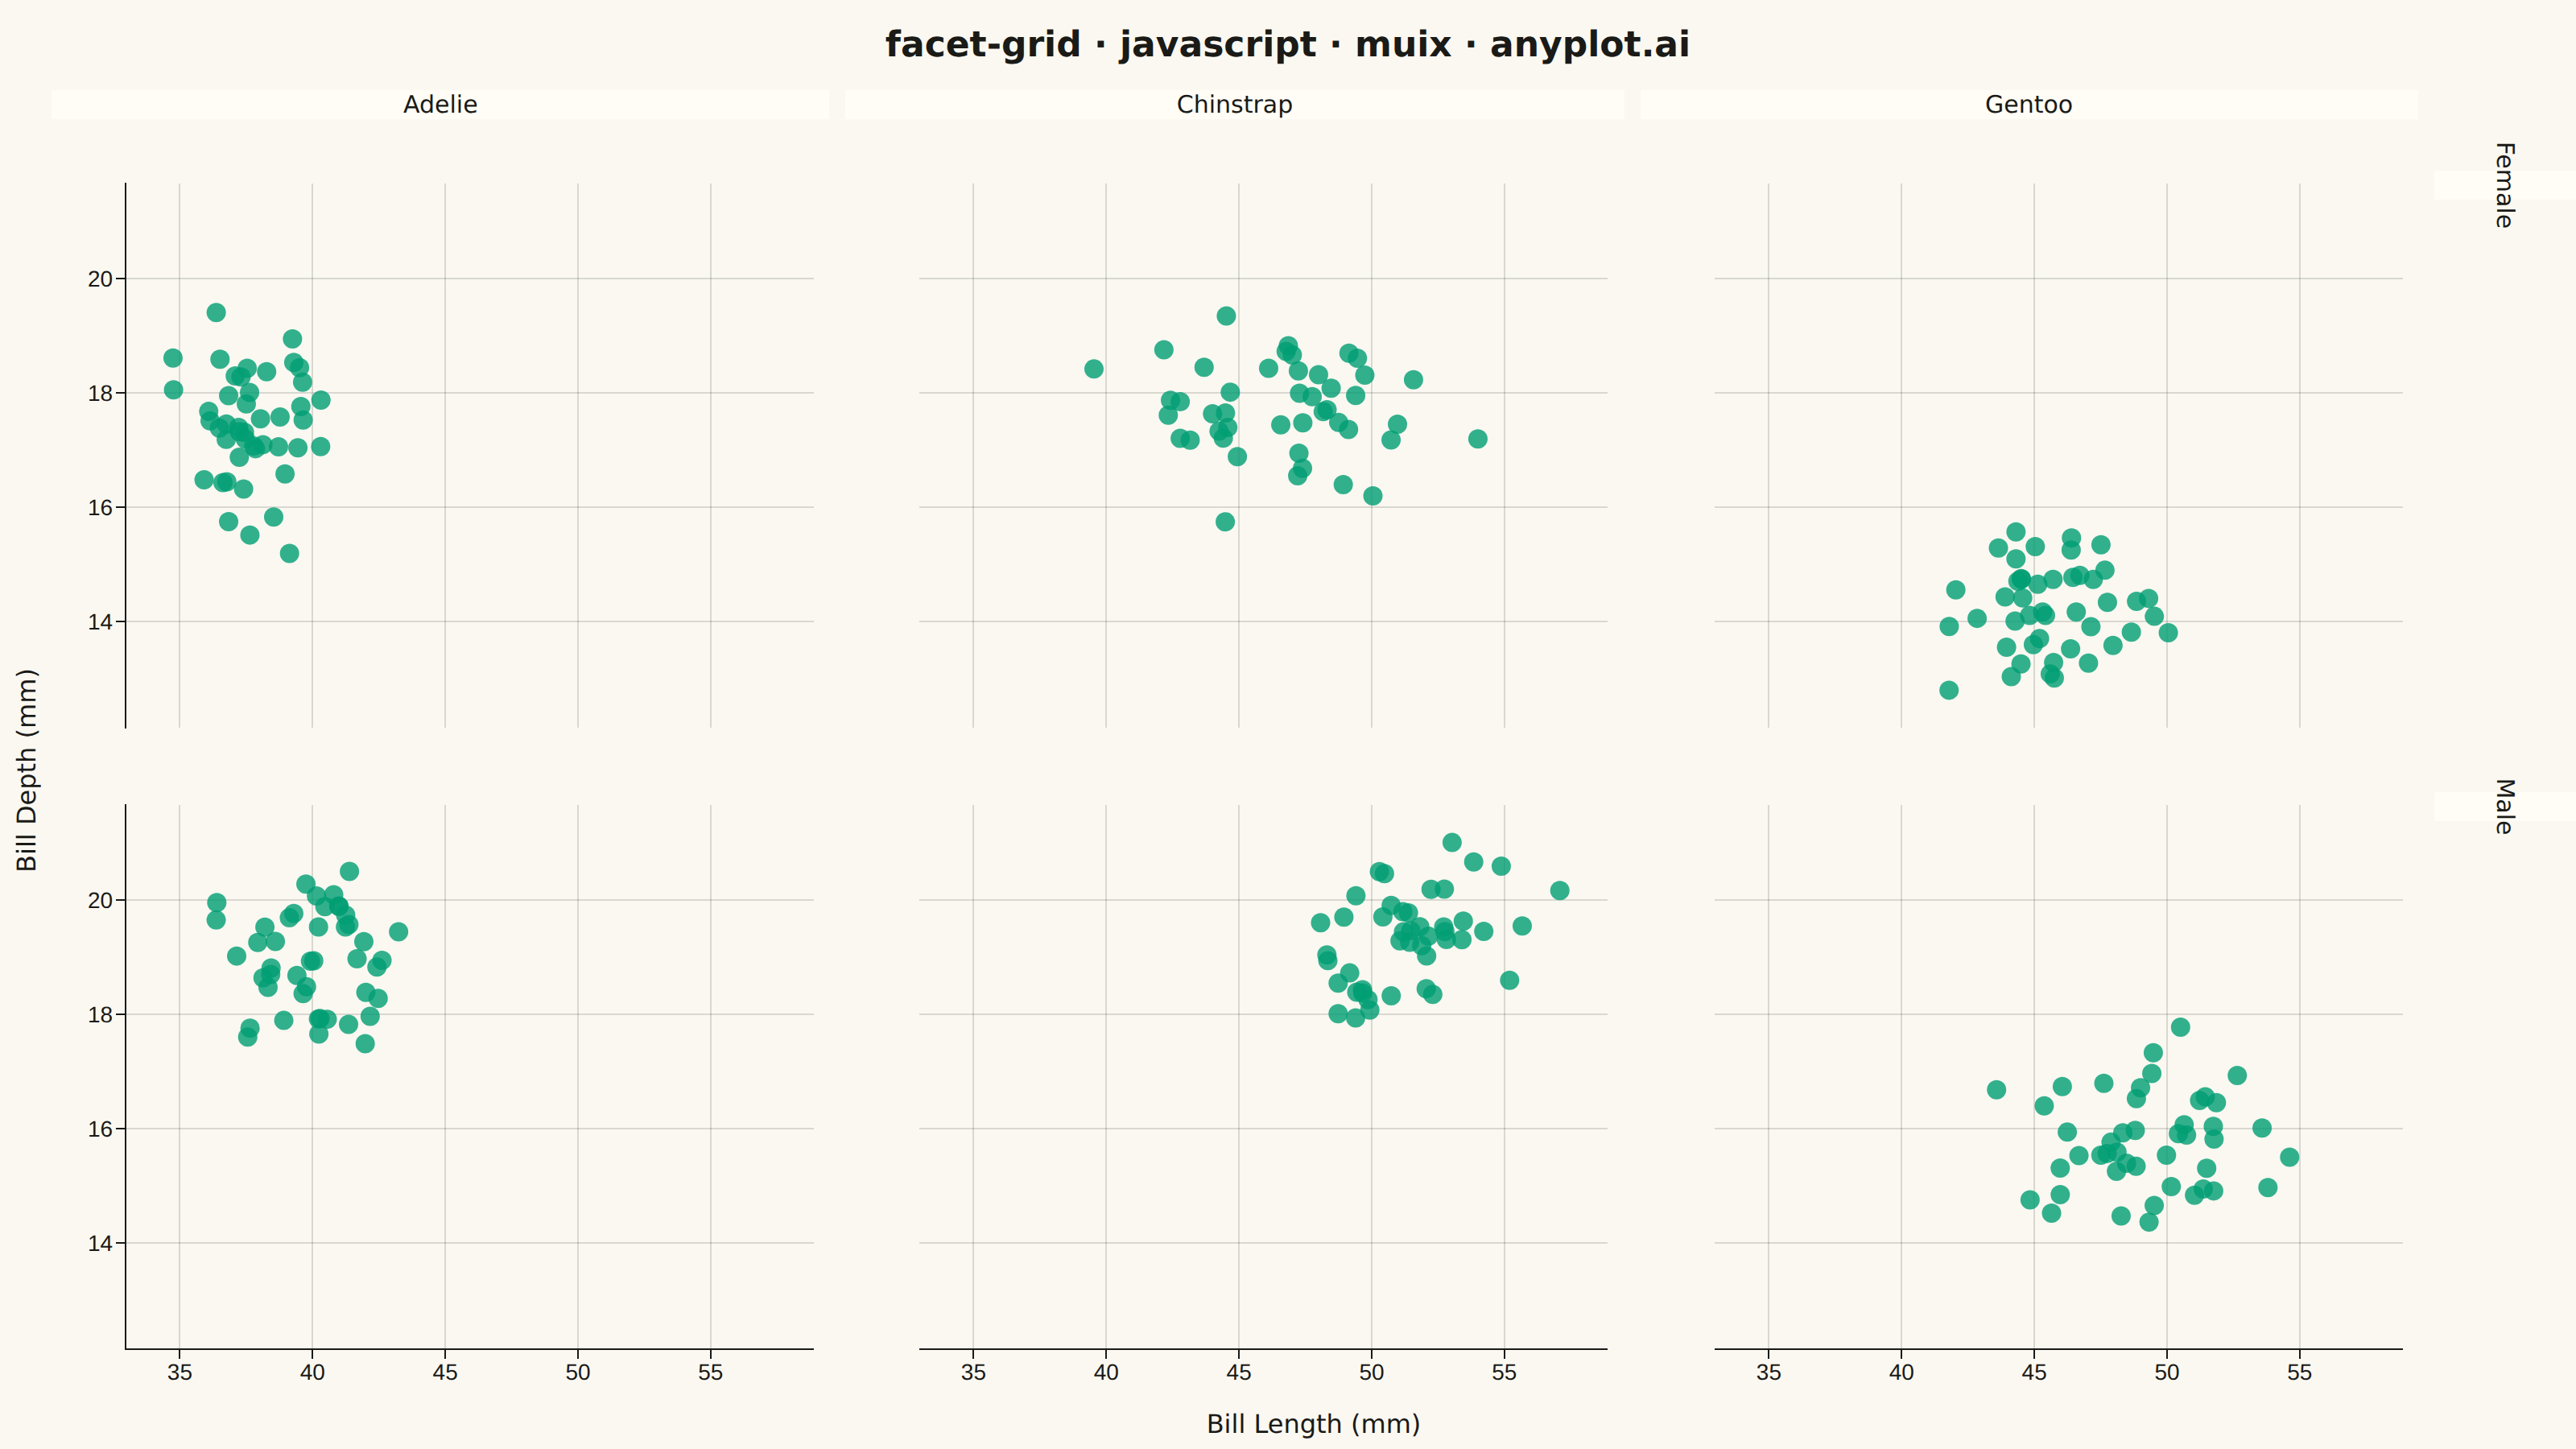
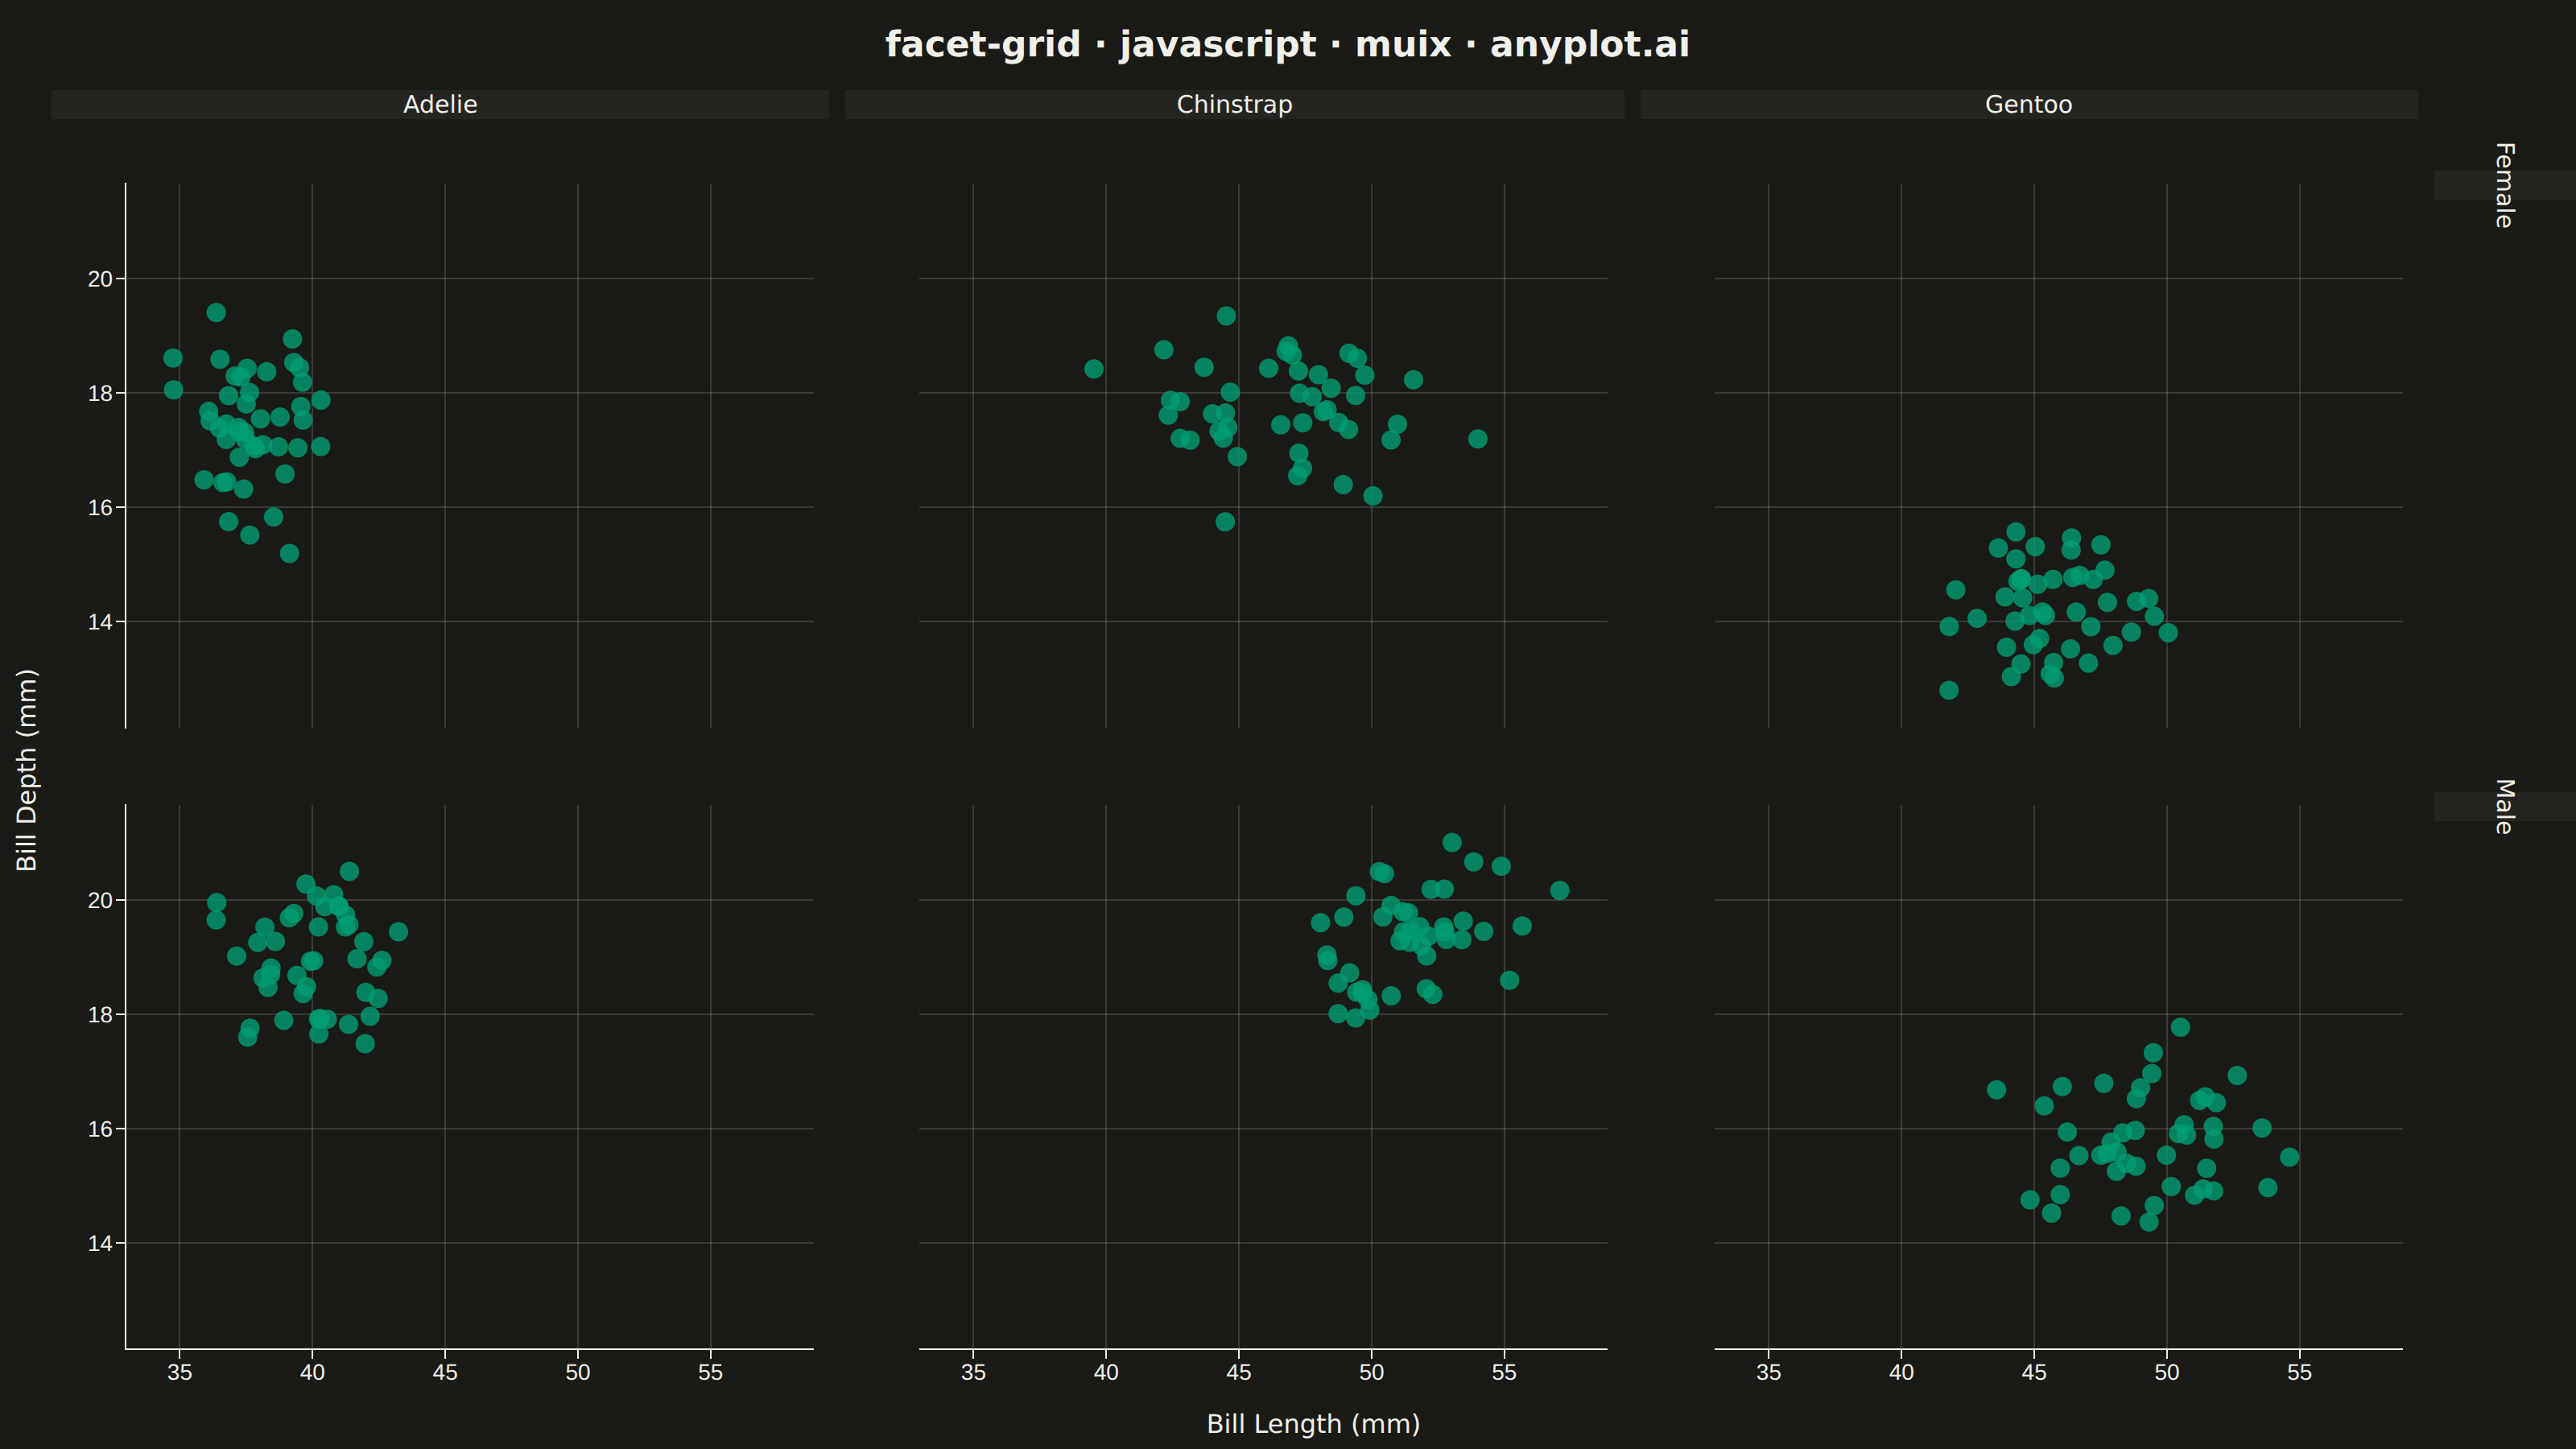
The same plot in 14 other libraries — JavaScript: Chart.js, D3.js, Apache ECharts, Highcharts; Python: Altair, Bokeh, lets-plot, Matplotlib, Plotly, plotnine, Pygal, Seaborn; R: ggplot2; Julia: Makie.jl. Compare all 15 side by side: Faceted Grid Plot in Python, R, Julia and JavaScript.
A grid of subplots where each cell shows the same type of plot for a different subset of data, split by one or two categorical variables. Enables systematic comparison across multiple dimensions.
// anyplot.ai
// facet-grid: Faceted Grid Plot
// Library: muix 7.29.1 | JavaScript 22.23.2
// Quality: 89/100 | Created: 2026-09-05
//# anyplot-orientation: landscape
// anyplot.ai
// facet-grid: Faceted Grid Plot
// Library: MUI X Charts | React | Node 22
// License: @mui/x-charts — MIT (community). Pro/Premium are out of scope.
// Quality: pending | Created: 2026-09-05
import { ChartContainer } from "@mui/x-charts/ChartContainer";
import { ScatterPlot } from "@mui/x-charts/ScatterChart";
import { ChartsXAxis } from "@mui/x-charts/ChartsXAxis";
import { ChartsYAxis } from "@mui/x-charts/ChartsYAxis";
import { ChartsGrid } from "@mui/x-charts/ChartsGrid";

const t = window.ANYPLOT_TOKENS;
const FONT = "system-ui, -apple-system, 'Segoe UI', sans-serif";
const TITLE = "facet-grid · javascript · muix · anyplot.ai";

// Moderate per-facet density (~45 pts) → alpha ~0.8 + a thin edge stroke keeps
// overlapping points in the denser clusters (Adelie, Gentoo-male) distinguishable.
function hexToRgba(hex, alpha) {
  const h = hex.replace("#", "");
  const r = parseInt(h.slice(0, 2), 16);
  const g = parseInt(h.slice(2, 4), 16);
  const b = parseInt(h.slice(4, 6), 16);
  return `rgba(${r}, ${g}, ${b}, ${alpha})`;
}
const MARKER_COLOR = hexToRgba(t.palette[0], 0.8);

// --- Deterministic PRNG (LCG) + Box-Muller normal --------------------------
// The browser has no seeded Math.random(), so every facet's sample is drawn
// from one shared, deterministic generator.
function makeLcg(seed) {
  let state = seed >>> 0;
  return function next() {
    state = (state * 1664525 + 1013904223) >>> 0;
    return state / 4294967296;
  };
}
const rand = makeLcg(42);
function gaussianSample() {
  const u1 = Math.max(rand(), 1e-9);
  const u2 = rand();
  return Math.sqrt(-2 * Math.log(u1)) * Math.cos(2 * Math.PI * u2);
}

// --- Data: penguin bill measurements, faceted by species (columns) x sex (rows) ---
const SPECIES = ["Adelie", "Chinstrap", "Gentoo"];
const SEXES = ["Female", "Male"];
const N_PER_FACET = 45;

// Approximate per-group bill length / bill depth stats (mm), Palmer Penguins-like.
const GROUP_STATS = {
  "Adelie-Female": { xMean: 37.3, xStd: 1.6, yMean: 17.6, yStd: 0.9 },
  "Adelie-Male": { xMean: 40.4, xStd: 2.0, yMean: 19.1, yStd: 1.0 },
  "Chinstrap-Female": { xMean: 46.6, xStd: 3.0, yMean: 17.6, yStd: 0.9 },
  "Chinstrap-Male": { xMean: 51.5, xStd: 1.6, yMean: 19.3, yStd: 0.8 },
  "Gentoo-Female": { xMean: 45.6, xStd: 2.0, yMean: 14.2, yStd: 0.8 },
  "Gentoo-Male": { xMean: 49.5, xStd: 2.6, yMean: 15.7, yStd: 0.9 },
};

// facets[row][col] = { species, sex, points } — a 2-row x 3-column grid.
const facets = SEXES.map((sex) =>
  SPECIES.map((species) => {
    const stats = GROUP_STATS[`${species}-${sex}`];
    const points = Array.from({ length: N_PER_FACET }, (_, i) => ({
      id: i,
      x: stats.xMean + stats.xStd * gaussianSample(),
      y: stats.yMean + stats.yStd * gaussianSample(),
    }));
    return { species, sex, points };
  }),
);

// Shared axis domain (with padding) — every facet renders on the same scale
// so the panels are directly comparable, per the faceted-grid convention.
const allPoints = facets.flat().flatMap((facet) => facet.points);
const allX = allPoints.map((p) => p.x);
const allY = allPoints.map((p) => p.y);
const xPad = (Math.max(...allX) - Math.min(...allX)) * 0.08;
const yPad = (Math.max(...allY) - Math.min(...allY)) * 0.08;
const X_DOMAIN = [Math.min(...allX) - xPad, Math.max(...allX) + xPad];
const Y_DOMAIN = [Math.min(...allY) - yPad, Math.max(...allY) + yPad];

// --- Layout constants (CSS px, mount coordinate space) ----------------------
const TITLE_H = 56;
const Y_LABEL_W = 32;
const X_LABEL_H = 32;
const COL_STRIP_H = 40;
const ROW_STRIP_W = 88;
const GAP = 10;
const TICK_LABEL_STYLE = { fontSize: 14 };
const PANEL_MARGIN = { left: 46, right: 10, top: 8, bottom: 30 };

function StripLabel({ children, rotate }) {
  return (
    <div
      style={{
        display: "flex",
        alignItems: "center",
        justifyContent: "center",
        background: t.elevatedBg,
        color: t.ink,
        fontSize: 15,
        fontWeight: 500,
        fontFamily: FONT,
      }}
    >
      <span style={rotate ? { transform: "rotate(90deg)", whiteSpace: "nowrap" } : { whiteSpace: "nowrap" }}>
        {children}
      </span>
    </div>
  );
}

// --- Chart (default-exported component — the harness mounts it) -------------
export default function Chart() {
  const { width: W, height: H } = window.ANYPLOT_SIZE;
  const nCols = SPECIES.length;
  const nRows = SEXES.length;

  const gridW = W - Y_LABEL_W - ROW_STRIP_W - nCols * GAP;
  const gridH = H - TITLE_H - X_LABEL_H - COL_STRIP_H - nRows * GAP;
  const panelW = gridW / nCols;
  const panelH = gridH / nRows;

  return (
    <div style={{ width: W, height: H, display: "flex", flexDirection: "column", fontFamily: FONT }}>
      <div style={{ height: TITLE_H, display: "flex", alignItems: "center", justifyContent: "center" }}>
        <span style={{ fontSize: 22, fontWeight: 600, color: t.ink }}>{TITLE}</span>
      </div>

      <div style={{ flex: 1, display: "flex" }}>
        <div style={{ width: Y_LABEL_W, display: "flex", alignItems: "center", justifyContent: "center" }}>
          <span style={{ transform: "rotate(-90deg)", whiteSpace: "nowrap", fontSize: 16, fontWeight: 500, color: t.ink }}>
            Bill Depth (mm)
          </span>
        </div>

        <div style={{ flex: 1, display: "flex", flexDirection: "column" }}>
          <div
            style={{
              display: "grid",
              gridTemplateColumns: `repeat(${nCols}, ${panelW}px) ${ROW_STRIP_W}px`,
              gridTemplateRows: `${COL_STRIP_H}px repeat(${nRows}, ${panelH}px)`,
              columnGap: GAP,
              rowGap: GAP,
            }}
          >
            {SPECIES.map((species, c) => (
              <div key={`col-${species}`} style={{ gridColumn: c + 1, gridRow: 1 }}>
                <StripLabel>{species}</StripLabel>
              </div>
            ))}
            <div style={{ gridColumn: nCols + 1, gridRow: 1 }} />

            {SEXES.map((sex, r) =>
              SPECIES.map((species, c) => {
                const facet = facets[r][c];
                const isLeftCol = c === 0;
                const isBottomRow = r === nRows - 1;
                return (
                  <div key={`${species}-${sex}`} style={{ gridColumn: c + 1, gridRow: r + 2 }}>
                    <ChartContainer
                      width={panelW}
                      height={panelH}
                      skipAnimation
                      margin={PANEL_MARGIN}
                      xAxis={[{ id: "x", scaleType: "linear", min: X_DOMAIN[0], max: X_DOMAIN[1], tickLabelStyle: TICK_LABEL_STYLE }]}
                      yAxis={[{ id: "y", scaleType: "linear", min: Y_DOMAIN[0], max: Y_DOMAIN[1], tickLabelStyle: TICK_LABEL_STYLE }]}
                      series={[
                        {
                          id: `${species}-${sex}`,
                          type: "scatter",
                          color: MARKER_COLOR,
                          markerSize: 6,
                          data: facet.points,
                        },
                      ]}
                      sx={{ "& .MuiScatter-mark": { stroke: t.pageBg, strokeWidth: 1 } }}
                    >
                      <ChartsGrid horizontal vertical sx={{ "& .MuiChartsGrid-line": { stroke: t.grid } }} />
                      <ScatterPlot />
                      {isLeftCol && <ChartsYAxis axisId="y" />}
                      {isBottomRow && <ChartsXAxis axisId="x" />}
                    </ChartContainer>
                  </div>
                );
              }),
            )}

            {SEXES.map((sex, r) => (
              <div key={`row-${sex}`} style={{ gridColumn: nCols + 1, gridRow: r + 2 }}>
                <StripLabel rotate>{sex}</StripLabel>
              </div>
            ))}
          </div>

          <div style={{ height: X_LABEL_H, display: "flex", alignItems: "center", justifyContent: "center" }}>
            <span style={{ fontSize: 16, fontWeight: 500, color: t.ink }}>Bill Length (mm)</span>
          </div>
        </div>
      </div>
    </div>
  );
}
Runnable source as JSON, for any HTTP client: https://api.anyplot.ai/specs/facet-grid/muix/code. Any spec id and library id listed in llms-full.txt fit the same URL shape; every URL below is complete and callable.
{
  "spec_id": "facet-grid",
  "language": "javascript",
  "library": "muix",
  "page": "https://anyplot.ai/facet-grid/javascript/muix",
  "hub": "https://anyplot.ai/facet-grid",
  "code_json": "https://api.anyplot.ai/specs/facet-grid/muix/code",
  "spec_json": "https://api.anyplot.ai/specs/facet-grid",
  "render_light_png": "https://storage.googleapis.com/anyplot-images/plots/facet-grid/javascript/muix/plot-light.png",
  "render_dark_png": "https://storage.googleapis.com/anyplot-images/plots/facet-grid/javascript/muix/plot-dark.png",
  "interactive_light_html": "https://storage.googleapis.com/anyplot-images/plots/facet-grid/javascript/muix/plot-light.html",
  "interactive_dark_html": "https://storage.googleapis.com/anyplot-images/plots/facet-grid/javascript/muix/plot-dark.html",
  "quality_score": 89.0,
  "license": "MIT",
  "guide": "https://anyplot.ai/llms.txt"
}
Part of Faceted Grid Plot on anyplot.ai.