The same plot in 14 other libraries — JavaScript: Chart.js, D3.js, Apache ECharts, MUI X Charts; Python: Altair, Bokeh, lets-plot, Matplotlib, Plotly, plotnine, Pygal, Seaborn; R: ggplot2; Julia: Makie.jl. Compare all 15 side by side: Faceted Grid Plot in Python, R, Julia and JavaScript.
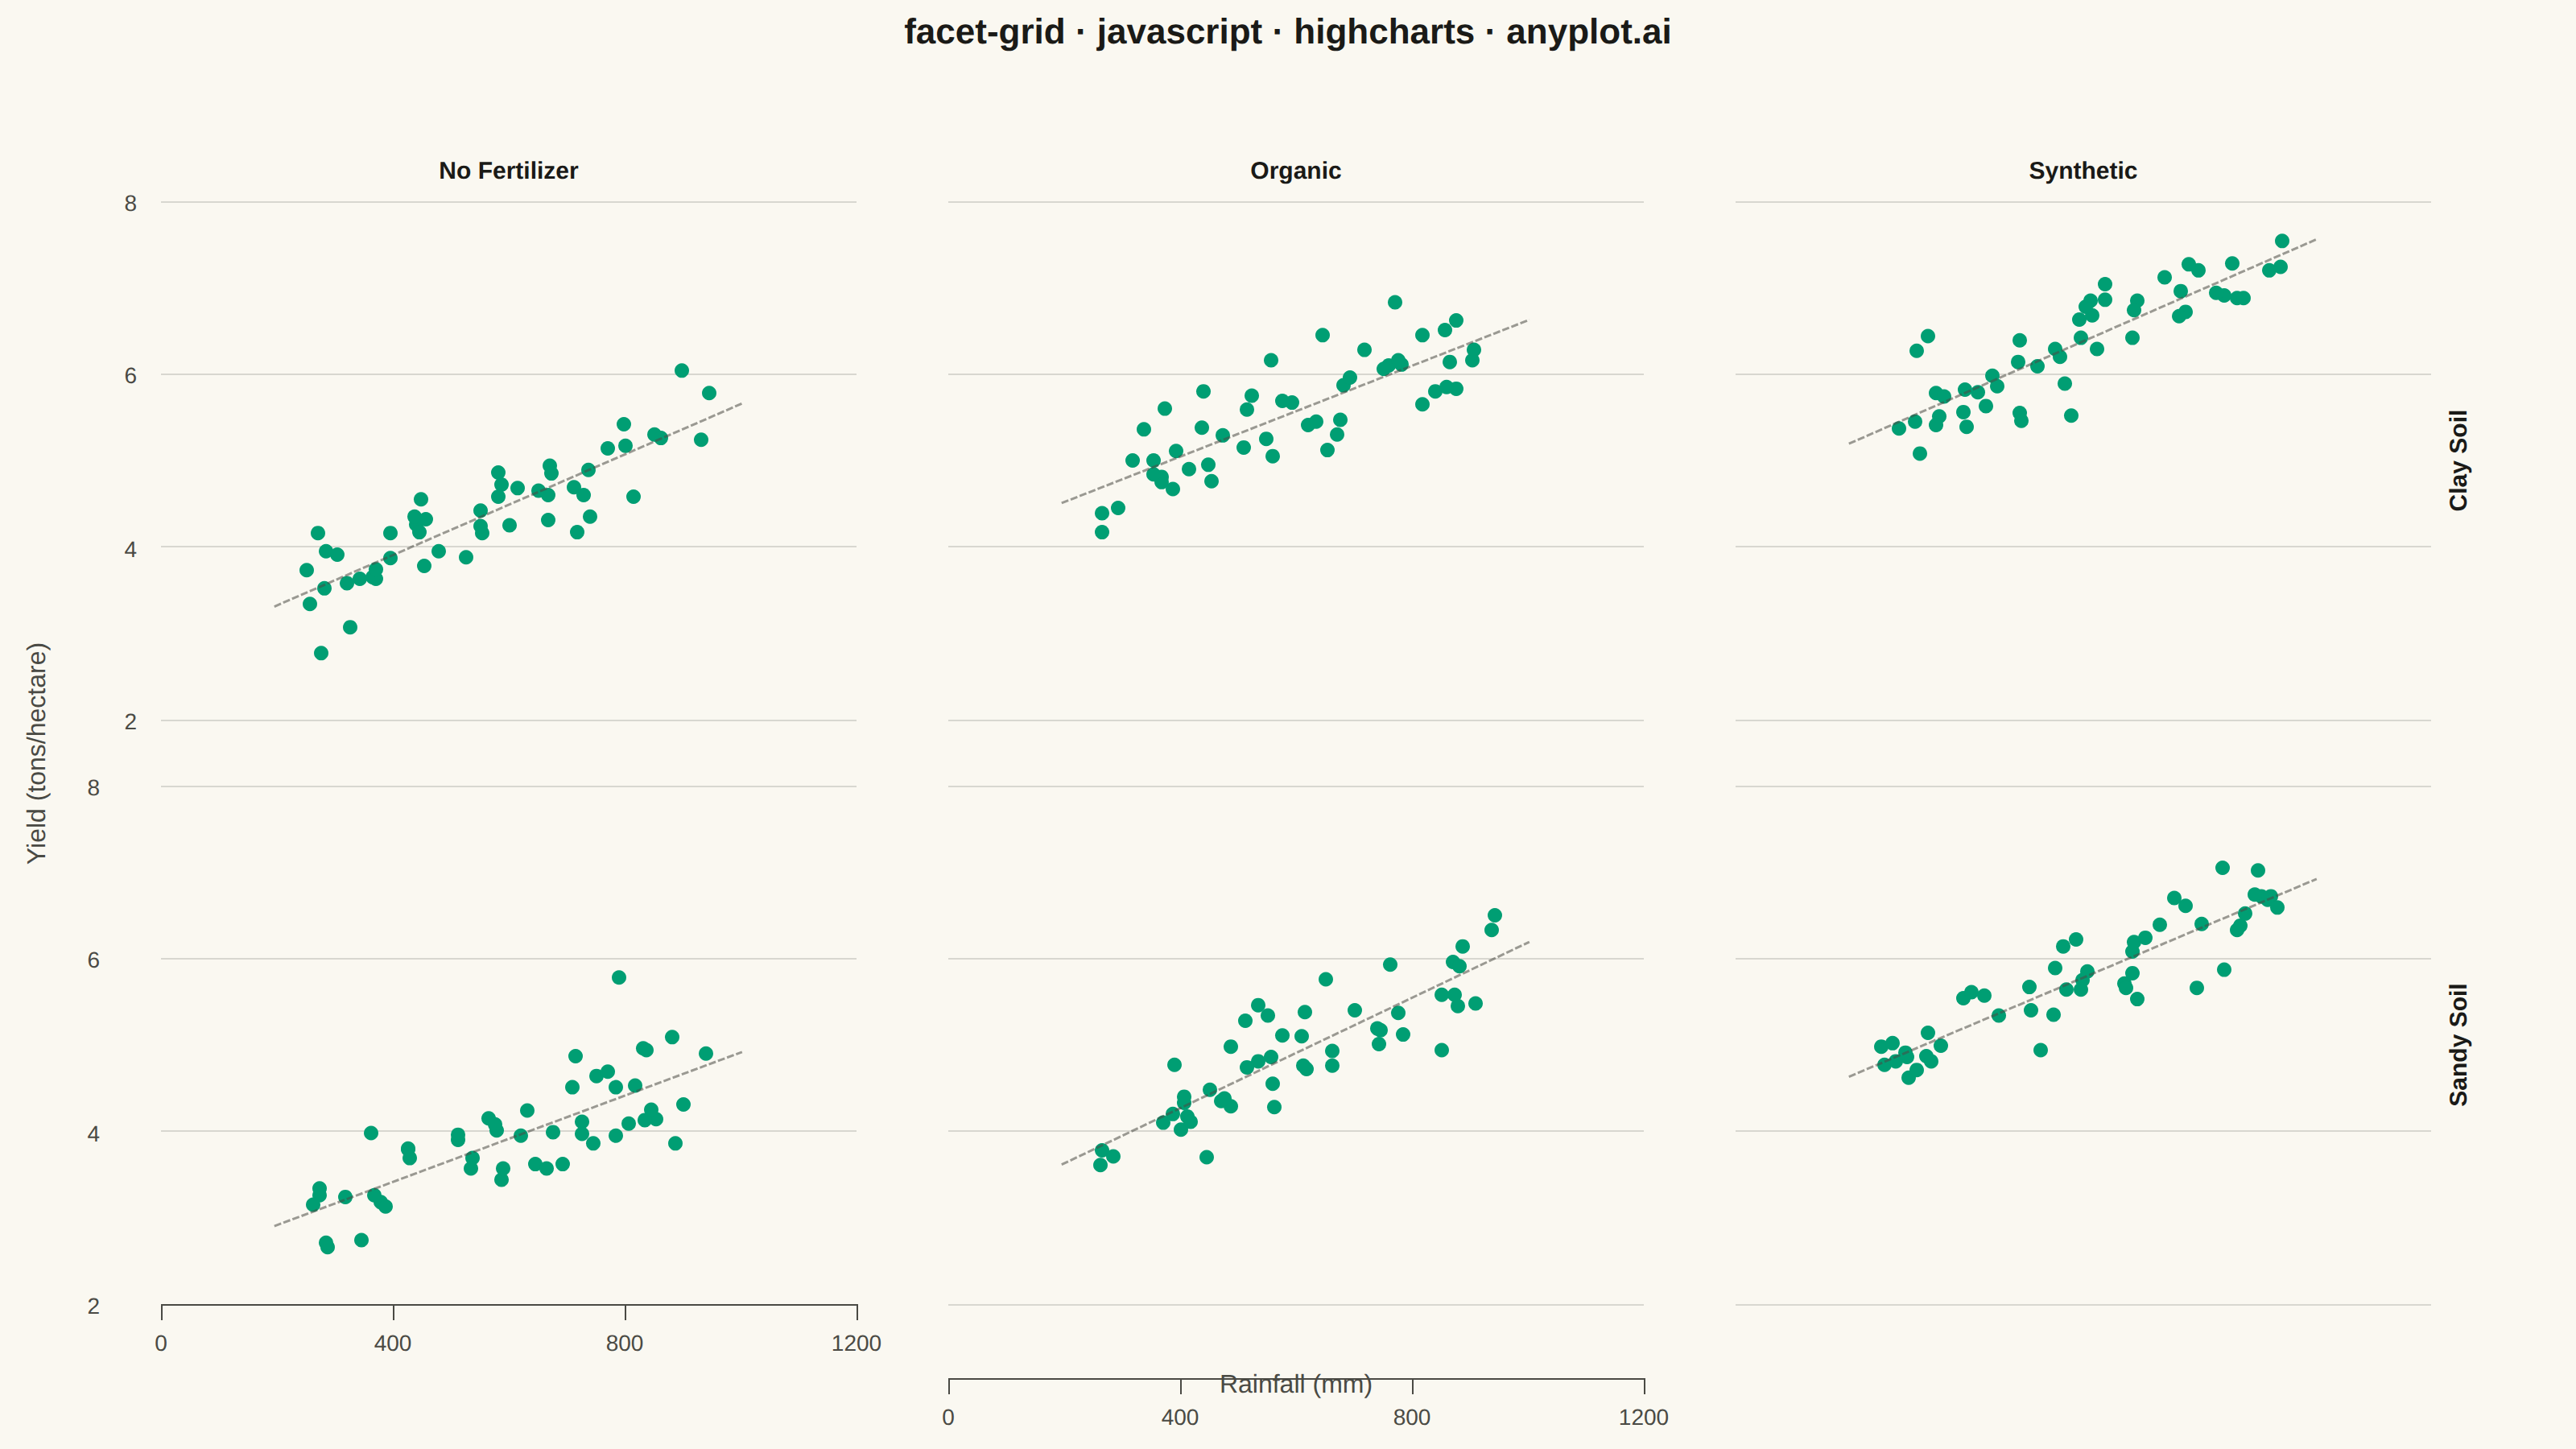
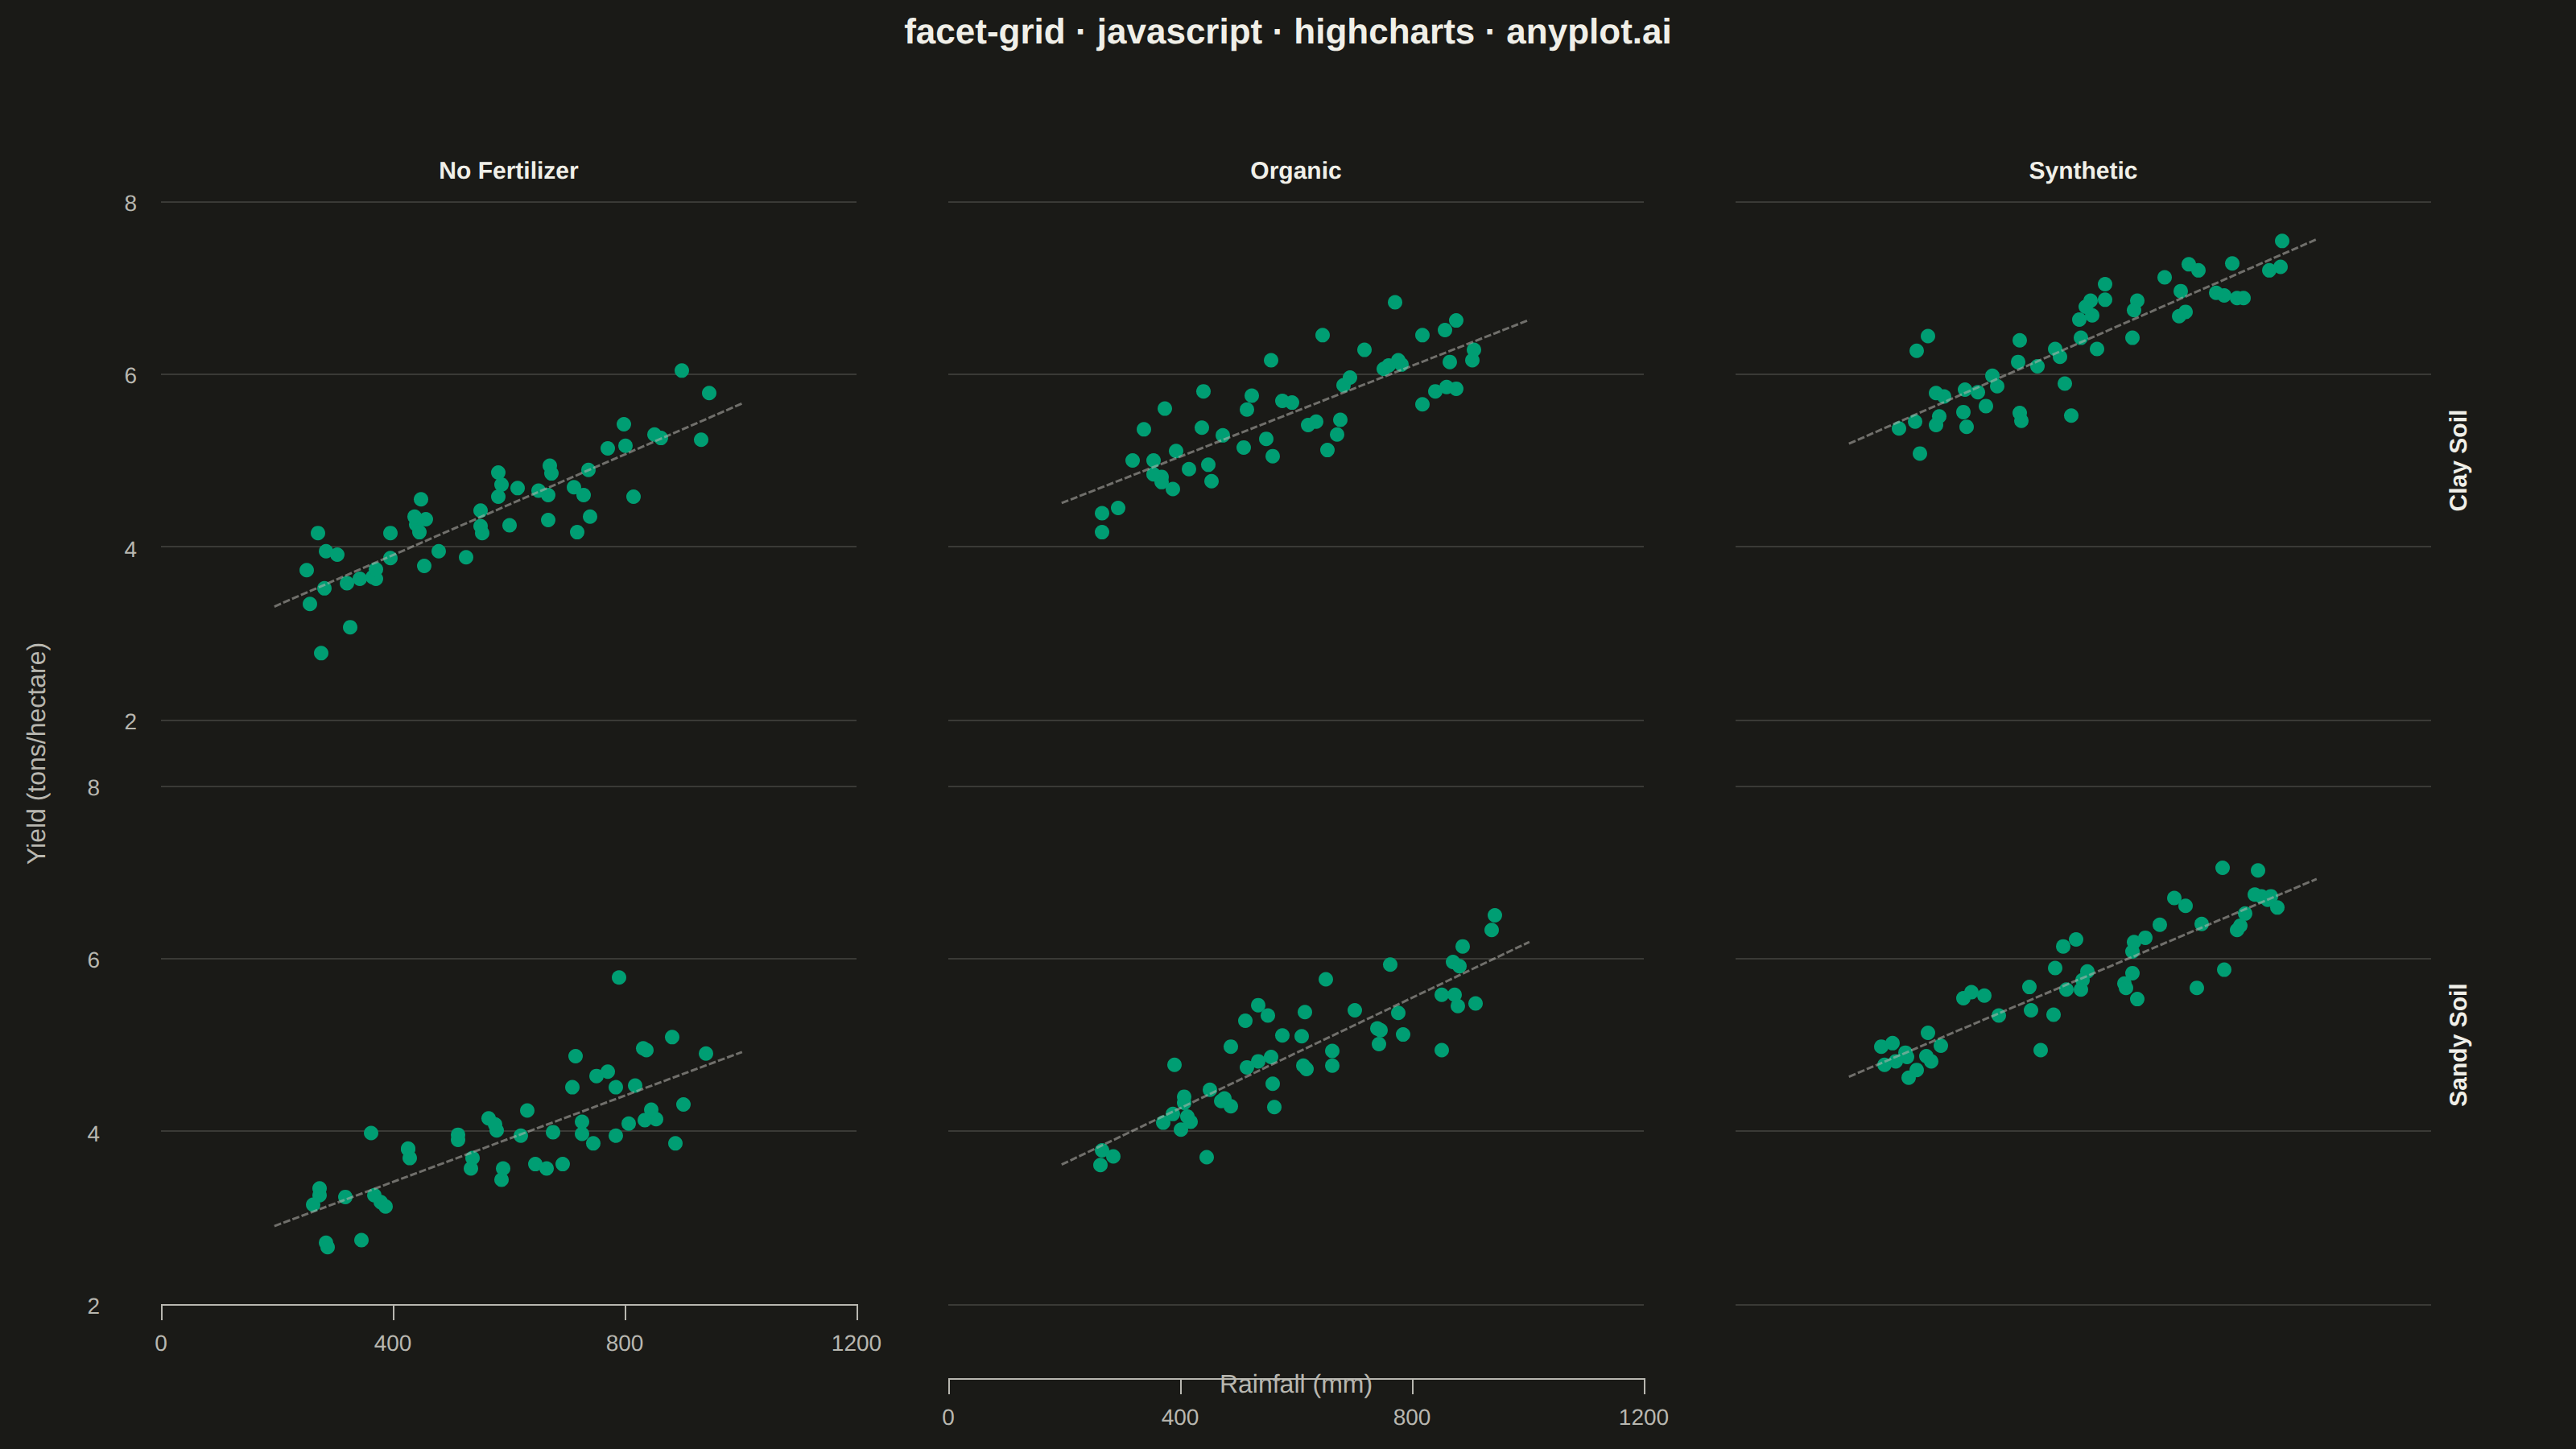
A grid of subplots where each cell shows the same type of plot for a different subset of data, split by one or two categorical variables. Enables systematic comparison across multiple dimensions.
// anyplot.ai
// facet-grid: Faceted Grid Plot
// Library: highcharts 12.6.0 | JavaScript 22.23.2
// Quality: 81/100 | Created: 2026-09-05

// Only the core `highcharts` bundle is loaded (no highcharts-more / grid module),
// so the facet grid is built the way Highcharts' own "small multiples" demo does
// it: one xAxis/yAxis pair per cell, each pinned to a percentage rectangle of
// the shared plot area via top/left/width/height, all sharing the same min/max
// so every panel reads off the same scale. Row and column strip labels are
// drawn with the core SVG renderer, mirroring ggplot2's facet_grid strips.
const t = window.ANYPLOT_TOKENS;

// --- Deterministic PRNG (mulberry32 + Box-Muller) --------------------------
function mulberry32(seed) {
  return function random() {
    seed = (seed + 0x6d2b79f5) | 0;
    let x = Math.imul(seed ^ (seed >>> 15), 1 | seed);
    x = (x + Math.imul(x ^ (x >>> 7), 61 | x)) ^ x;
    return ((x ^ (x >>> 14)) >>> 0) / 4294967296;
  };
}
const rand = mulberry32(42);
function randNormal(mean, std) {
  const u1 = rand();
  const u2 = rand();
  return mean + std * Math.sqrt(-2 * Math.log(u1)) * Math.cos(2 * Math.PI * u2);
}

// --- Data: crop yield vs. rainfall, faceted by soil type (rows) x fertilizer (columns) ---
const ROW_FACETS = ["Clay Soil", "Sandy Soil"];
const COL_FACETS = ["No Fertilizer", "Organic", "Synthetic"];
const POINTS_PER_CELL = 50;
const SOIL_EFFECT = { "Clay Soil": 0.6, "Sandy Soil": 0 };
const FERTILIZER_EFFECT = { "No Fertilizer": 0, Organic: 1.1, Synthetic: 1.9 };

const cells = [];
ROW_FACETS.forEach((rowFacet) => {
  COL_FACETS.forEach((colFacet) => {
    const points = [];
    for (let i = 0; i < POINTS_PER_CELL; i += 1) {
      const rainfall = 250 + rand() * 700;
      const yieldTons =
        2.2 + rainfall * 0.0028 + SOIL_EFFECT[rowFacet] + FERTILIZER_EFFECT[colFacet] + randNormal(0, 0.35);
      points.push([Math.round(rainfall * 10) / 10, Math.round(yieldTons * 100) / 100]);
    }
    cells.push({ rowFacet, colFacet, points });
  });
});

const allX = cells.flatMap((cell) => cell.points.map((p) => p[0]));
const allY = cells.flatMap((cell) => cell.points.map((p) => p[1]));
const xPad = (Math.max(...allX) - Math.min(...allX)) * 0.08;
const yPad = (Math.max(...allY) - Math.min(...allY)) * 0.08;
const X_MIN = Math.min(...allX) - xPad;
const X_MAX = Math.max(...allX) + xPad;
const Y_MIN = Math.min(...allY) - yPad;
const Y_MAX = Math.max(...allY) + yPad;

// --- Grid geometry (percentages of the shared plot area) -------------------
const N_ROWS = ROW_FACETS.length;
const N_COLS = COL_FACETS.length;
const COL_GUTTER_PCT = 4;
const ROW_GUTTER_PCT = 6;
const CELL_WIDTH_PCT = (100 - COL_GUTTER_PCT * (N_COLS - 1)) / N_COLS;
const CELL_HEIGHT_PCT = (100 - ROW_GUTTER_PCT * (N_ROWS - 1)) / N_ROWS;
const cellLeftPct = (c) => c * (CELL_WIDTH_PCT + COL_GUTTER_PCT);
const cellTopPct = (r) => r * (CELL_HEIGHT_PCT + ROW_GUTTER_PCT);

const xAxes = [];
const yAxes = [];
const series = [];
cells.forEach((cell, idx) => {
  const r = ROW_FACETS.indexOf(cell.rowFacet);
  const c = COL_FACETS.indexOf(cell.colFacet);
  const rect = {
    top: `${cellTopPct(r)}%`,
    height: `${CELL_HEIGHT_PCT}%`,
    left: `${cellLeftPct(c)}%`,
    width: `${CELL_WIDTH_PCT}%`,
  };
  const isBottomRow = r === N_ROWS - 1;
  xAxes.push({
    ...rect,
    min: X_MIN,
    max: X_MAX,
    tickAmount: 4,
    startOnTick: false,
    endOnTick: false,
    // Only the bottom row draws the axis line + ticks — otherwise every
    // interior row leaves a floating bracket where its (hidden-label) axis
    // line would sit between facet rows.
    lineWidth: isBottomRow ? 1 : 0,
    tickWidth: isBottomRow ? 1 : 0,
    lineColor: t.inkSoft,
    tickColor: t.inkSoft,
    gridLineColor: t.grid,
    title: { text: null },
    labels: { enabled: isBottomRow, style: { color: t.inkSoft, fontSize: "14px" } },
  });
  yAxes.push({
    ...rect,
    min: Y_MIN,
    max: Y_MAX,
    tickAmount: 4,
    startOnTick: false,
    endOnTick: false,
    lineColor: t.inkSoft,
    tickColor: t.inkSoft,
    gridLineColor: t.grid,
    title: { text: null },
    labels: { enabled: c === 0, style: { color: t.inkSoft, fontSize: "14px" } },
  });

  // Least-squares trend line so the rainfall -> yield relationship reads as
  // the focal insight rather than something the viewer infers from the raw scatter.
  const n = cell.points.length;
  const sumX = cell.points.reduce((acc, [x]) => acc + x, 0);
  const sumY = cell.points.reduce((acc, [, y]) => acc + y, 0);
  const sumXY = cell.points.reduce((acc, [x, y]) => acc + x * y, 0);
  const sumXX = cell.points.reduce((acc, [x]) => acc + x * x, 0);
  const slope = (n * sumXY - sumX * sumY) / (n * sumXX - sumX * sumX);
  const intercept = (sumY - slope * sumX) / n;

  series.push({
    type: "scatter",
    name: `${cell.rowFacet} × ${cell.colFacet}`,
    xAxis: idx,
    yAxis: idx,
    color: t.palette[0],
    data: cell.points,
    marker: { radius: 4.5, symbol: "circle", states: { hover: { enabled: true, radiusPlus: 1.5 } } },
    showInLegend: false,
  });
  series.push({
    type: "line",
    xAxis: idx,
    yAxis: idx,
    color: t.inkSoft,
    opacity: 0.55,
    lineWidth: 1.5,
    dashStyle: "ShortDash",
    marker: { enabled: false },
    enableMouseTracking: false,
    showInLegend: false,
    data: [
      [X_MIN, intercept + slope * X_MIN],
      [X_MAX, intercept + slope * X_MAX],
    ],
  });
});

const TITLE = "facet-grid · javascript · highcharts · anyplot.ai";
const titleFontSize = Math.max(15, Math.round(22 * Math.min(1, 67 / TITLE.length))) + "px";

// --- Chart -------------------------------------------------------------------
const chart = Highcharts.chart("container", {
  chart: {
    type: "scatter",
    backgroundColor: "transparent",
    animation: false,
    style: { fontFamily: "inherit" },
    margin: [125, 90, 90, 100],
  },
  credits: { enabled: false },
  title: { text: TITLE, style: { color: t.ink, fontSize: titleFontSize, fontWeight: "600" } },
  xAxis: xAxes,
  yAxis: yAxes,
  legend: { enabled: false },
  tooltip: { pointFormat: "Rainfall: {point.x} mm<br/>Yield: {point.y} t/ha" },
  plotOptions: { series: { animation: false } },
  series,
});

// --- Facet strip labels (column headers on top, row headers on the right) --
COL_FACETS.forEach((label, c) => {
  const x = chart.plotLeft + ((cellLeftPct(c) + CELL_WIDTH_PCT / 2) / 100) * chart.plotWidth;
  chart.renderer
    .text(label, x, chart.plotTop - 14)
    .attr({ align: "center", zIndex: 5 })
    .css({ color: t.ink, fontSize: "15px", fontWeight: "600" })
    .add();
});

ROW_FACETS.forEach((label, r) => {
  const y = chart.plotTop + ((cellTopPct(r) + CELL_HEIGHT_PCT / 2) / 100) * chart.plotHeight;
  chart.renderer
    .text(label, chart.plotLeft + chart.plotWidth + 22, y)
    .attr({ align: "center", rotation: -90, zIndex: 5 })
    .css({ color: t.ink, fontSize: "15px", fontWeight: "600" })
    .add();
});

// --- Shared axis titles ------------------------------------------------------
chart.renderer
  .text("Rainfall (mm)", chart.plotLeft + chart.plotWidth / 2, chart.plotTop + chart.plotHeight + 55)
  .attr({ align: "center", zIndex: 5 })
  .css({ color: t.inkSoft, fontSize: "16px" })
  .add();

chart.renderer
  .text("Yield (tons/hectare)", 28, chart.plotTop + chart.plotHeight / 2)
  .attr({ align: "center", rotation: -90, zIndex: 5 })
  .css({ color: t.inkSoft, fontSize: "16px" })
  .add();
Runnable source as JSON, for any HTTP client: https://api.anyplot.ai/specs/facet-grid/highcharts/code. Any spec id and library id listed in llms-full.txt fit the same URL shape; every URL below is complete and callable.
{
  "spec_id": "facet-grid",
  "language": "javascript",
  "library": "highcharts",
  "page": "https://anyplot.ai/facet-grid/javascript/highcharts",
  "hub": "https://anyplot.ai/facet-grid",
  "code_json": "https://api.anyplot.ai/specs/facet-grid/highcharts/code",
  "spec_json": "https://api.anyplot.ai/specs/facet-grid",
  "render_light_png": "https://storage.googleapis.com/anyplot-images/plots/facet-grid/javascript/highcharts/plot-light.png",
  "render_dark_png": "https://storage.googleapis.com/anyplot-images/plots/facet-grid/javascript/highcharts/plot-dark.png",
  "interactive_light_html": "https://storage.googleapis.com/anyplot-images/plots/facet-grid/javascript/highcharts/plot-light.html",
  "interactive_dark_html": "https://storage.googleapis.com/anyplot-images/plots/facet-grid/javascript/highcharts/plot-dark.html",
  "quality_score": 81.0,
  "license": "MIT",
  "guide": "https://anyplot.ai/llms.txt"
}
Part of Faceted Grid Plot on anyplot.ai.