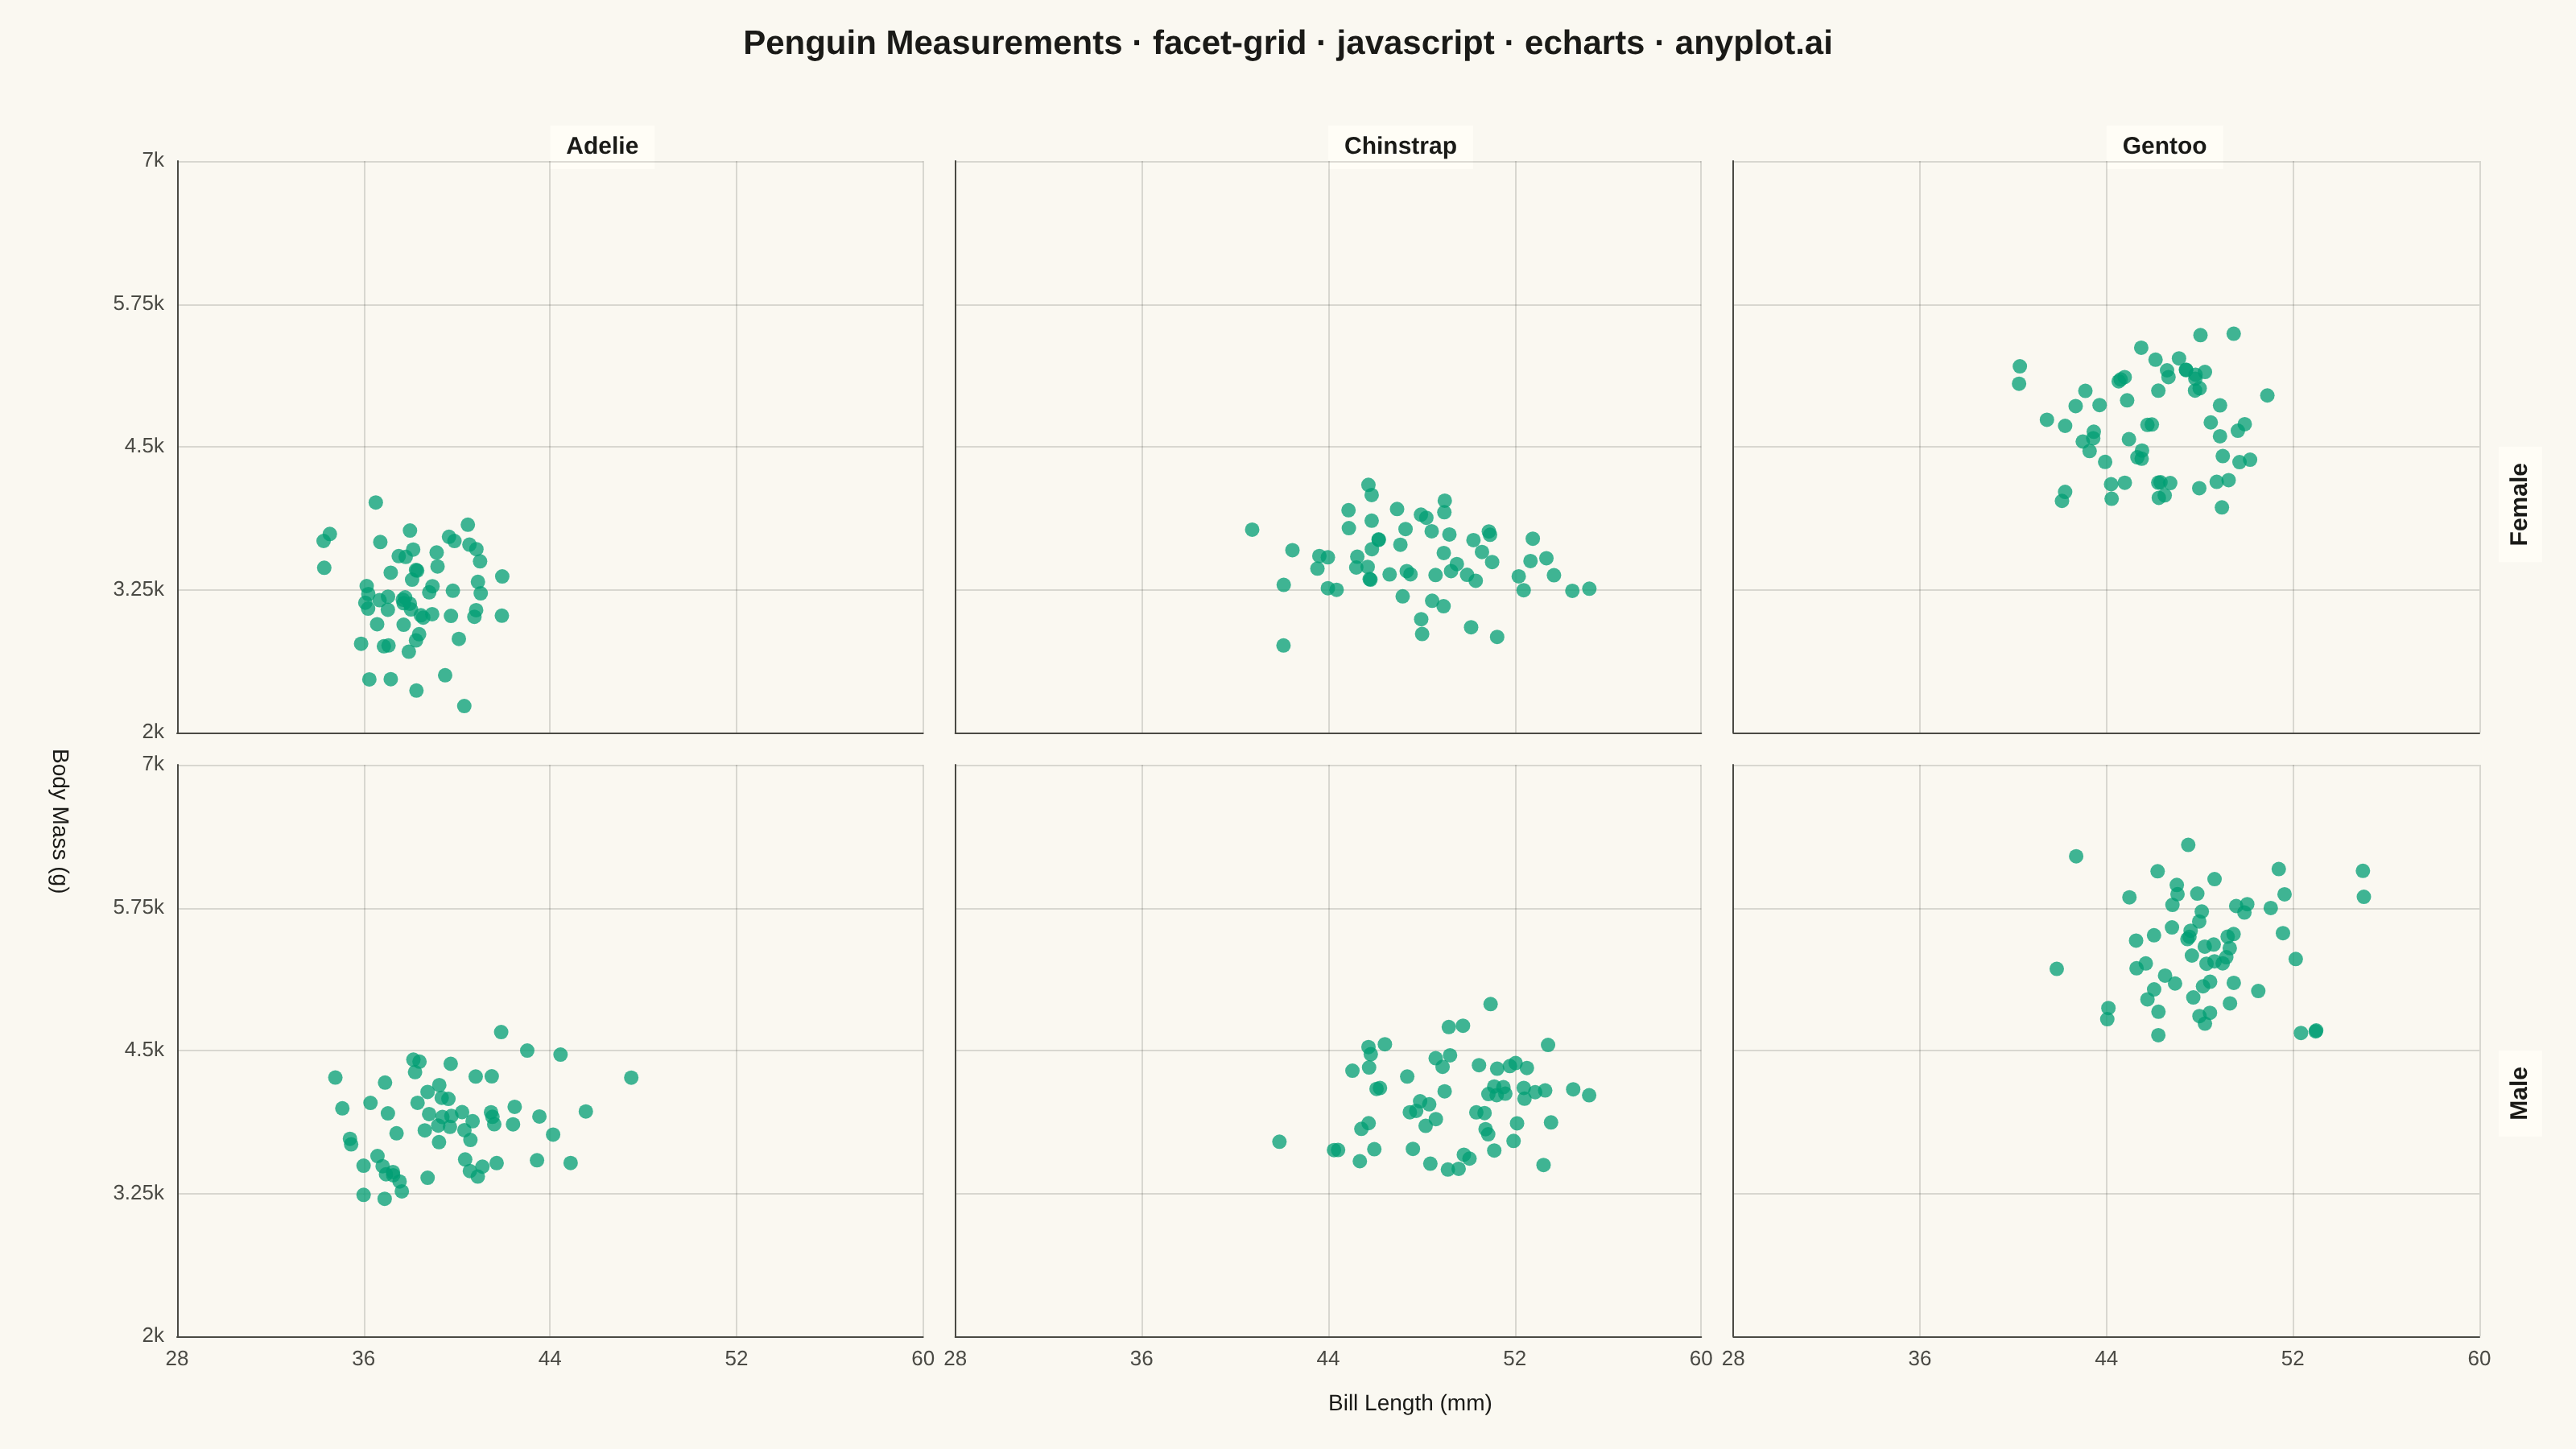
The same plot in 14 other libraries — JavaScript: Chart.js, D3.js, Highcharts, MUI X Charts; Python: Altair, Bokeh, lets-plot, Matplotlib, Plotly, plotnine, Pygal, Seaborn; R: ggplot2; Julia: Makie.jl. Compare all 15 side by side: Faceted Grid Plot in Python, R, Julia and JavaScript.
A grid of subplots where each cell shows the same type of plot for a different subset of data, split by one or two categorical variables. Enables systematic comparison across multiple dimensions.
// anyplot.ai
// facet-grid: Faceted Grid Plot
// Library: echarts 6.1.0 | JavaScript 22.23.2
// Quality: 93/100 | Created: 2026-09-05

const t = window.ANYPLOT_TOKENS;

// --- Data (in-memory, deterministic, penguin-style measurements) -----------
// Bill length (mm) vs. body mass (g), faceted by species (columns) and
// sex (rows) — mirrors the Palmer Penguins scenario suggested by the spec.
function makeLcg(seed) {
  let state = seed;
  return function () {
    state = (state * 1664525 + 1013904223) % 4294967296;
    return state / 4294967296;
  };
}
const rng = makeLcg(42);

function randNormal(mean, sd) {
  const u1 = Math.max(rng(), 1e-9);
  const u2 = rng();
  const z = Math.sqrt(-2 * Math.log(u1)) * Math.cos(2 * Math.PI * u2);
  return mean + z * sd;
}

const species = ["Adelie", "Chinstrap", "Gentoo"];
const sexes = ["Female", "Male"];
const speciesStats = {
  Adelie: { bill: 38.8, billSd: 2.2, mass: 3550, massSd: 380 },
  Chinstrap: { bill: 48.8, billSd: 3.0, mass: 3730, massSd: 380 },
  Gentoo: { bill: 47.5, billSd: 3.1, mass: 5076, massSd: 500 },
};
const sexEffect = {
  Female: { bill: -1.0, mass: -300 },
  Male: { bill: 1.0, mass: 300 },
};
const pointsPerGroup = 60;

// grid order is row-major: row = sex index, col = species index
const facetData = [];
for (const sex of sexes) {
  for (const sp of species) {
    const stats = speciesStats[sp];
    const effect = sexEffect[sex];
    const points = [];
    for (let i = 0; i < pointsPerGroup; i++) {
      const bill = randNormal(stats.bill + effect.bill, stats.billSd);
      const mass = randNormal(stats.mass + effect.mass, stats.massSd);
      points.push([bill, mass]);
    }
    facetData.push(points);
  }
}

// --- Layout (CSS px within the 1600x900 landscape mount) --------------------
const gridLeft = 110;
const gridRight = 1540;
const gridTop = 100;
const gridBottom = 830;
const colGap = 20;
const rowGap = 20;
const colWidth = (gridRight - gridLeft - 2 * colGap) / 3;
const rowHeight = (gridBottom - gridTop - rowGap) / 2;
const colLefts = [0, 1, 2].map((c) => gridLeft + c * (colWidth + colGap));
const rowTops = [0, 1].map((r) => gridTop + r * (rowHeight + rowGap));

const X_MIN = 28;
const X_MAX = 60;
const Y_MIN = 2000;
const Y_MAX = 7000;

const grids = [];
const xAxes = [];
const yAxes = [];
const series = [];

for (let r = 0; r < sexes.length; r++) {
  for (let c = 0; c < species.length; c++) {
    const idx = r * species.length + c;
    grids.push({
      left: colLefts[c],
      top: rowTops[r],
      width: colWidth,
      height: rowHeight,
    });
    xAxes.push({
      gridIndex: idx,
      type: "value",
      min: X_MIN,
      max: X_MAX,
      interval: 8,
      axisLabel: {
        show: r === sexes.length - 1,
        color: t.inkSoft,
        fontSize: 13,
      },
      axisLine: { lineStyle: { color: t.inkSoft } },
      axisTick: { show: false },
      splitLine: { show: true, lineStyle: { color: t.grid } },
    });
    yAxes.push({
      gridIndex: idx,
      type: "value",
      min: Y_MIN,
      max: Y_MAX,
      interval: 1250,
      axisLabel: {
        show: c === 0,
        color: t.inkSoft,
        fontSize: 13,
        formatter: (v) => `${v / 1000}k`,
      },
      axisLine: { lineStyle: { color: t.inkSoft } },
      axisTick: { show: false },
      splitLine: { show: true, lineStyle: { color: t.grid } },
    });
    series.push({
      type: "scatter",
      xAxisIndex: idx,
      yAxisIndex: idx,
      data: facetData[idx],
      symbolSize: 9,
      itemStyle: { color: t.palette[0], opacity: 0.75 },
    });
  }
}

// --- Facet strip labels + shared axis titles (graphic overlay) -------------
const graphic = [];
species.forEach((sp, c) => {
  graphic.push({
    type: "text",
    left: colLefts[c] + colWidth / 2,
    top: 78,
    style: {
      text: sp,
      fill: t.ink,
      font: "600 15px sans-serif",
      align: "center",
      backgroundColor: t.elevatedBg,
      padding: [6, 10],
    },
  });
});
sexes.forEach((sex, r) => {
  graphic.push({
    type: "text",
    left: gridRight + 12,
    top: rowTops[r] + rowHeight / 2,
    rotation: Math.PI / 2,
    style: {
      text: sex,
      fill: t.ink,
      font: "600 15px sans-serif",
      align: "center",
      backgroundColor: t.elevatedBg,
      padding: [6, 10],
    },
  });
});
graphic.push({
  type: "text",
  left: (gridLeft + gridRight) / 2,
  top: 865,
  style: {
    text: "Bill Length (mm)",
    fill: t.ink,
    font: "14px sans-serif",
    align: "center",
  },
});
graphic.push({
  type: "text",
  left: 30,
  top: (gridTop + gridBottom) / 2,
  rotation: -Math.PI / 2,
  style: {
    text: "Body Mass (g)",
    fill: t.ink,
    font: "14px sans-serif",
    align: "center",
  },
});

// --- Init + Option ------------------------------------------------------
const chart = echarts.init(document.getElementById("container"));

chart.setOption({
  animation: false,
  backgroundColor: "transparent",
  title: {
    text: "Penguin Measurements · facet-grid · javascript · echarts · anyplot.ai",
    left: "center",
    top: 12,
    textStyle: { color: t.ink, fontSize: 21 },
  },
  grid: grids,
  xAxis: xAxes,
  yAxis: yAxes,
  series: series,
  graphic: graphic,
});
Runnable source as JSON, for any HTTP client: https://api.anyplot.ai/specs/facet-grid/echarts/code. Any spec id and library id listed in llms-full.txt fit the same URL shape; every URL below is complete and callable.
{
  "spec_id": "facet-grid",
  "language": "javascript",
  "library": "echarts",
  "page": "https://anyplot.ai/facet-grid/javascript/echarts",
  "hub": "https://anyplot.ai/facet-grid",
  "code_json": "https://api.anyplot.ai/specs/facet-grid/echarts/code",
  "spec_json": "https://api.anyplot.ai/specs/facet-grid",
  "render_light_png": "https://storage.googleapis.com/anyplot-images/plots/facet-grid/javascript/echarts/plot-light.png",
  "render_dark_png": "https://storage.googleapis.com/anyplot-images/plots/facet-grid/javascript/echarts/plot-dark.png",
  "interactive_light_html": "https://storage.googleapis.com/anyplot-images/plots/facet-grid/javascript/echarts/plot-light.html",
  "interactive_dark_html": "https://storage.googleapis.com/anyplot-images/plots/facet-grid/javascript/echarts/plot-dark.html",
  "quality_score": 93.0,
  "license": "MIT",
  "guide": "https://anyplot.ai/llms.txt"
}
Part of Faceted Grid Plot on anyplot.ai.