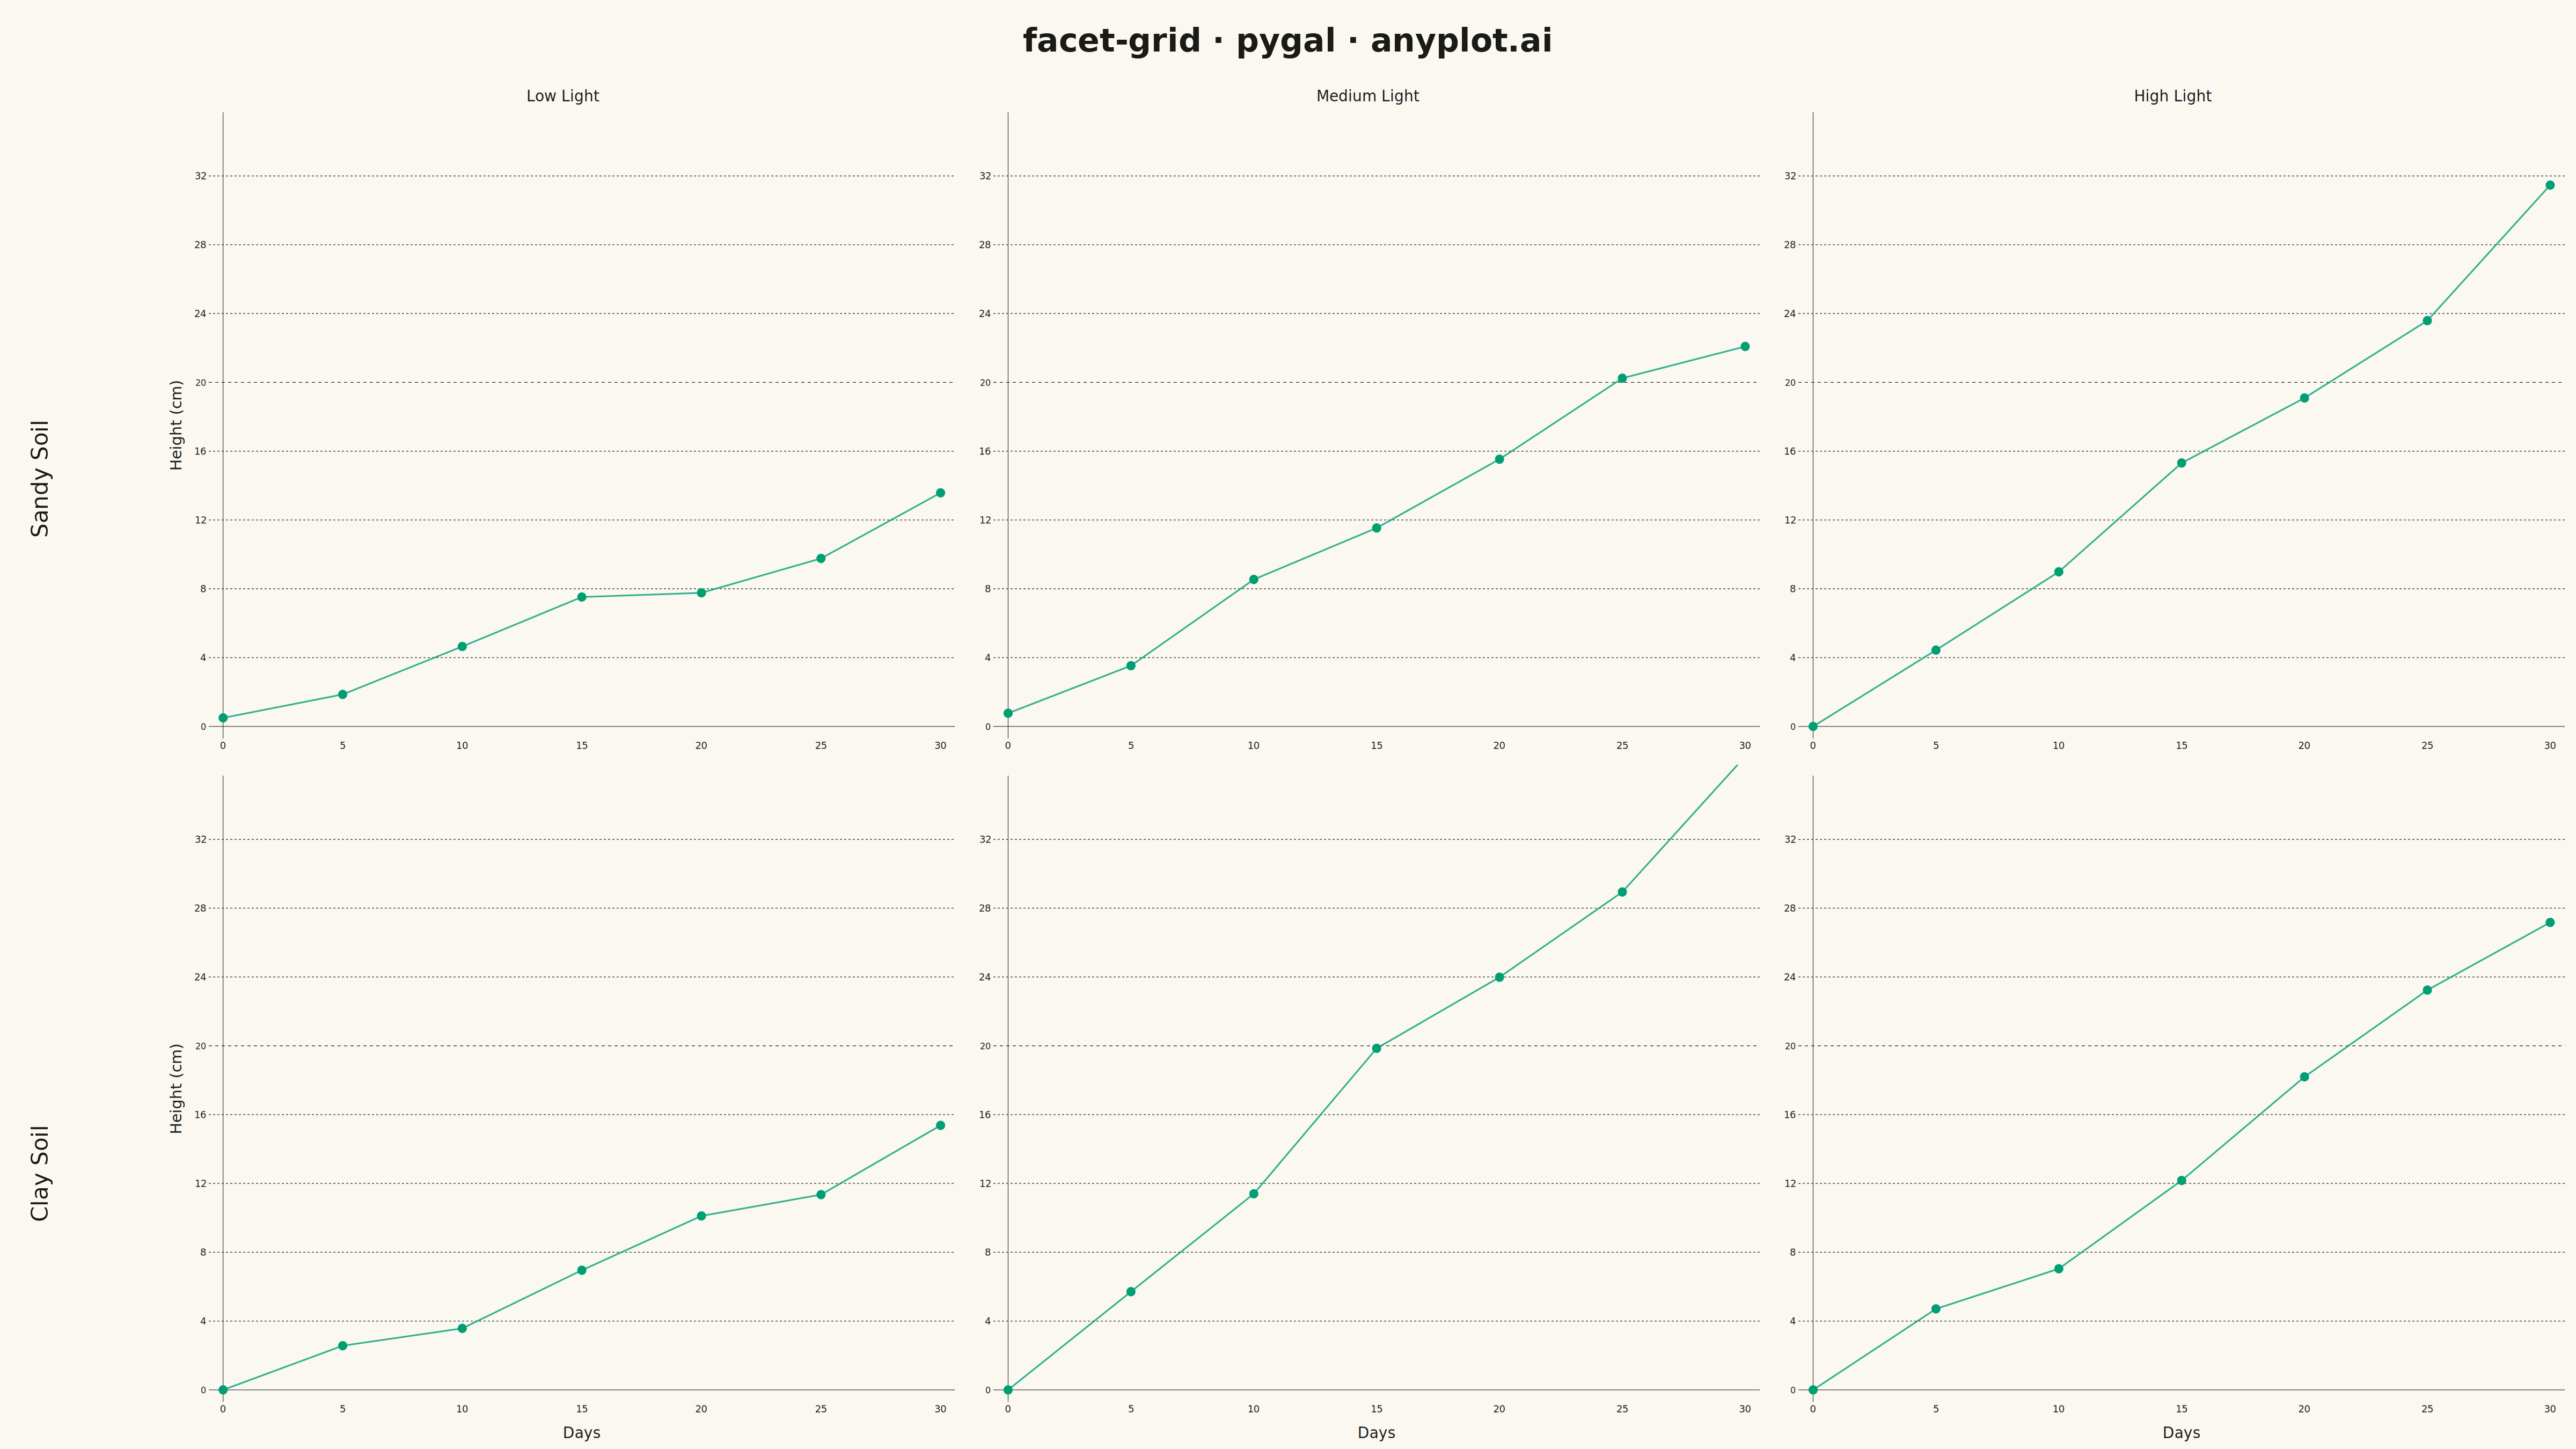
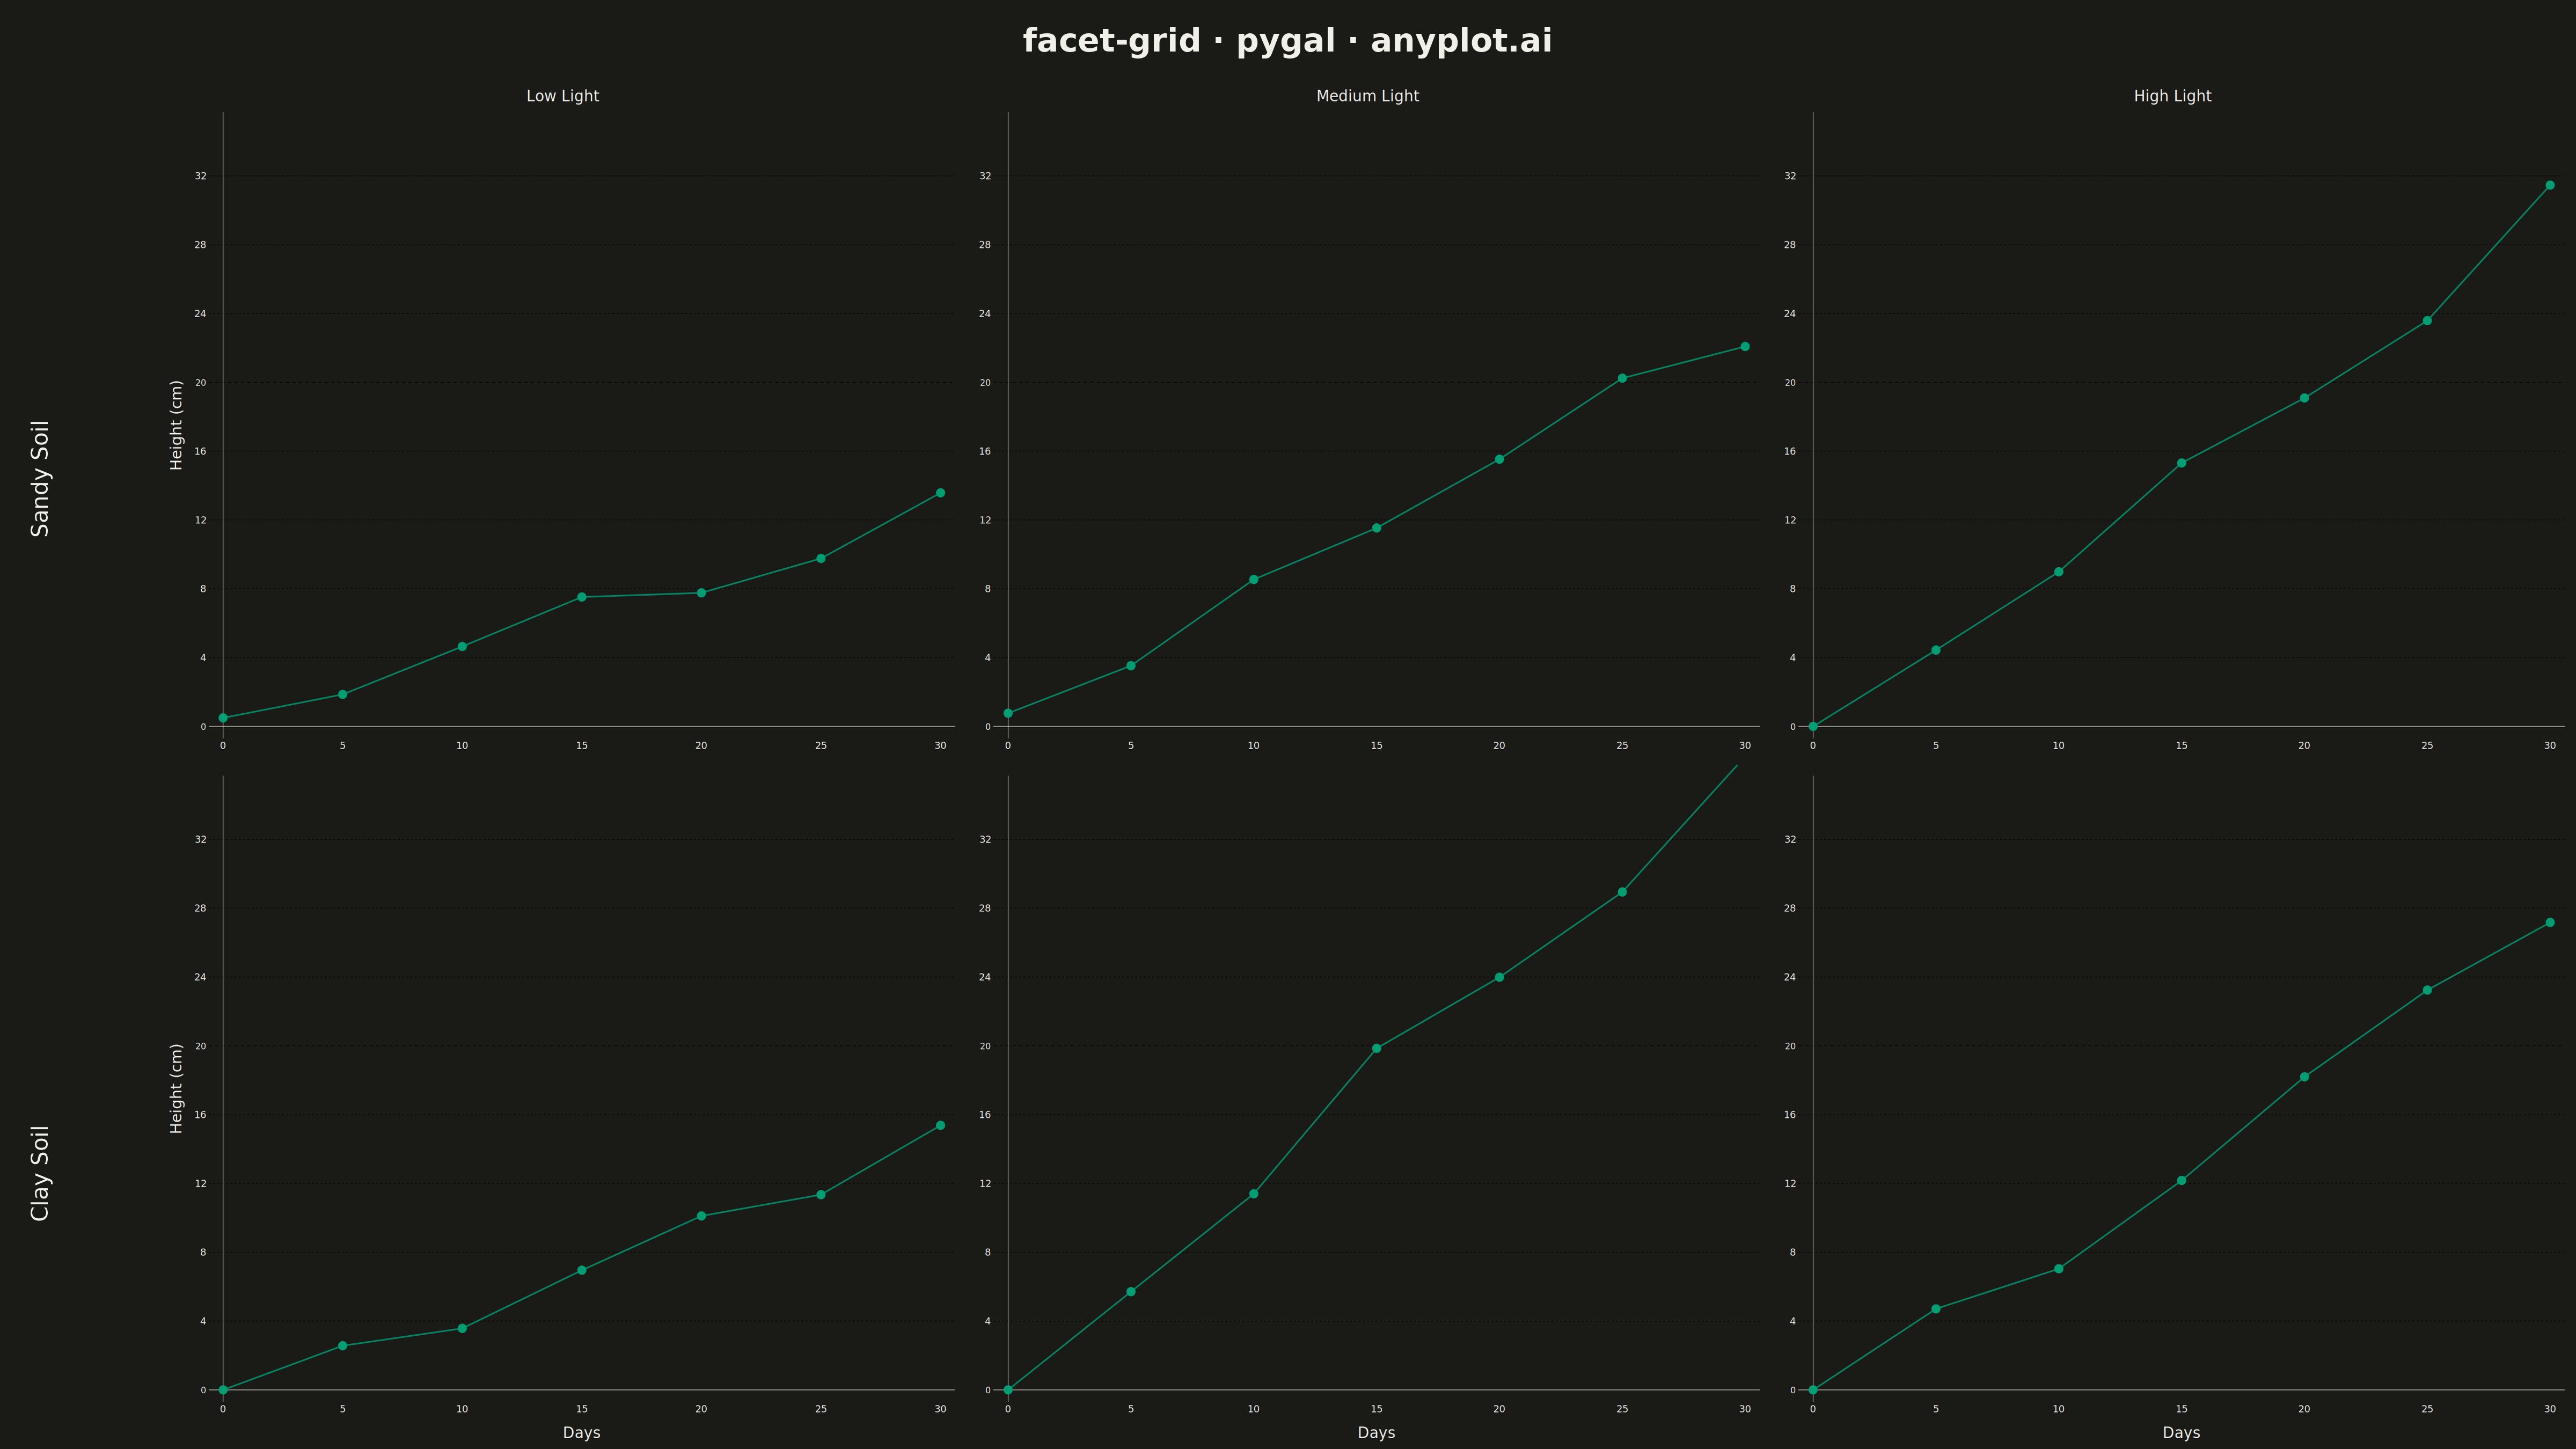
A grid of subplots where each cell shows the same type of plot for a different subset of data, split by one or two categorical variables. Enables systematic comparison across multiple dimensions.
""" anyplot.ai
facet-grid: Faceted Grid Plot
Library: pygal 3.1.0 | Python 3.13.13
Quality: 85/100 | Updated: 2026-05-13
"""

import os
from io import BytesIO

import cairosvg
import numpy as np
import pygal
from PIL import Image, ImageDraw, ImageFont
from pygal.style import Style


THEME = os.getenv("ANYPLOT_THEME", "light")

# Theme-adaptive colors
PAGE_BG = "#FAF8F1" if THEME == "light" else "#1A1A17"
INK = "#1A1A17" if THEME == "light" else "#F0EFE8"
INK_MUTED = "#6B6A63" if THEME == "light" else "#A8A79F"

# Okabe-Ito palette (first series = brand green)
IMPRINT = ("#009E73", "#C475FD", "#4467A3", "#BD8233", "#AE3030", "#2ABCCD", "#954477")

# Data - Plant growth experiment across different soil types and light conditions
np.random.seed(42)

row_cats = ["Sandy Soil", "Clay Soil"]
col_cats = ["Low Light", "Medium Light", "High Light"]

# Generate plant growth data (height vs days) for each condition
data = {}
base_growth_rates = {
    ("Sandy Soil", "Low Light"): 0.4,
    ("Sandy Soil", "Medium Light"): 0.8,
    ("Sandy Soil", "High Light"): 1.0,
    ("Clay Soil", "Low Light"): 0.5,
    ("Clay Soil", "Medium Light"): 1.2,
    ("Clay Soil", "High Light"): 0.9,
}

days = [0, 5, 10, 15, 20, 25, 30]

for row_cat in row_cats:
    for col_cat in col_cats:
        rate = base_growth_rates[(row_cat, col_cat)]
        heights = [d * rate + np.random.normal(0, 1) for d in days]
        heights = [max(0, h) for h in heights]
        data[(row_cat, col_cat)] = heights

# Custom style for theme-adaptive rendering
custom_style = Style(
    background=PAGE_BG,
    plot_background=PAGE_BG,
    foreground=INK,
    foreground_strong=INK,
    foreground_subtle=INK_MUTED,
    colors=IMPRINT,
    font_family="sans-serif",
    title_font_size=28,
    label_font_size=18,
    major_label_font_size=16,
    legend_font_size=16,
    value_font_size=14,
    stroke_width=3,
)

# Create individual charts for each facet
cell_width = 1500
cell_height = 1250

charts = []
for row_idx, row_cat in enumerate(row_cats):
    row_charts = []
    for col_idx, col_cat in enumerate(col_cats):
        chart = pygal.Line(
            width=cell_width,
            height=cell_height,
            style=custom_style,
            show_legend=False,
            show_y_guides=True,
            show_x_guides=False,
            x_title="Days" if row_idx == len(row_cats) - 1 else "",
            y_title="Height (cm)" if col_idx == 0 else "",
            title=f"{col_cat}" if row_idx == 0 else "",
            show_dots=True,
            dots_size=8,
            stroke_style={"width": 4},
            range=(0, 35),
            truncate_label=-1,
        )

        chart.x_labels = [str(d) for d in days]
        chart.add(row_cat, data[(row_cat, col_cat)])
        row_charts.append(chart)
    charts.append(row_charts)

# Render each chart to PNG and combine them
images = []
for row_charts in charts:
    row_images = []
    for chart in row_charts:
        svg_bytes = chart.render()
        png_bytes = cairosvg.svg2png(bytestring=svg_bytes, output_width=cell_width, output_height=cell_height)
        img = Image.open(BytesIO(png_bytes))
        row_images.append(img)
    images.append(row_images)

# Create combined image grid
title_height = 150
row_label_width = 300
total_width = 4800
total_height = 2700

combined = Image.new("RGB", (total_width, total_height), PAGE_BG)

# Calculate grid positioning
grid_width = total_width - row_label_width
grid_height = total_height - title_height
actual_cell_width = grid_width // len(col_cats)
actual_cell_height = grid_height // len(row_cats)

# Paste charts into grid
for row_idx, row_images in enumerate(images):
    for col_idx, img in enumerate(row_images):
        img_resized = img.resize((actual_cell_width, actual_cell_height), Image.LANCZOS)
        x = row_label_width + col_idx * actual_cell_width
        y = title_height + row_idx * actual_cell_height
        combined.paste(img_resized, (x, y))

# Add text annotations using PIL
draw = ImageDraw.Draw(combined)

try:
    title_font = ImageFont.truetype("/usr/share/fonts/truetype/dejavu/DejaVuSans-Bold.ttf", 60)
    label_font = ImageFont.truetype("/usr/share/fonts/truetype/dejavu/DejaVuSans.ttf", 42)
except OSError:
    title_font = ImageFont.load_default()
    label_font = ImageFont.load_default()

# Draw main title
title_text = "facet-grid · pygal · anyplot.ai"
bbox = draw.textbbox((0, 0), title_text, font=title_font)
title_width = bbox[2] - bbox[0]
title_x = (total_width - title_width) // 2
draw.text((title_x, 40), title_text, fill=INK, font=title_font)

# Draw row labels (rotated 90 degrees)
for row_idx, row_cat in enumerate(row_cats):
    temp_img = Image.new("RGBA", (450, 100), (255, 255, 255, 0))
    temp_draw = ImageDraw.Draw(temp_img)
    temp_draw.text((10, 10), row_cat, fill=INK, font=label_font)
    temp_img = temp_img.rotate(90, expand=True)

    label_y = title_height + row_idx * actual_cell_height + actual_cell_height // 2 - temp_img.height // 2
    combined.paste(temp_img, (40, label_y), temp_img)

# Save output files with theme-suffixed names
combined.save(f"plot-{THEME}.png", dpi=(300, 300))

# Also save as interactive HTML
html_content = (
    """<!DOCTYPE html>
<html>
<head>
    <title>facet-grid · pygal · anyplot.ai</title>
    <style>
        body { font-family: sans-serif; background: """
    + PAGE_BG
    + """; margin: 20px; }
        h1 { text-align: center; color: """
    + INK
    + """; font-size: 28px; }
        .grid { display: grid; grid-template-columns: 100px repeat(3, 1fr); gap: 10px; max-width: 1600px; margin: 0 auto; }
        .row-label { writing-mode: vertical-rl; text-orientation: mixed; transform: rotate(180deg);
                     display: flex; align-items: center; justify-content: center; font-size: 20px; font-weight: bold; color: """
    + INK
    + """; }
        .col-header { text-align: center; font-size: 20px; font-weight: bold; color: """
    + INK
    + """; padding: 10px; }
        .chart { width: 100%; }
        .empty { }
    </style>
</head>
<body>
    <h1>facet-grid · pygal · anyplot.ai</h1>
    <div class="grid">
        <div class="empty"></div>
"""
)

# Add column headers
for col_cat in col_cats:
    html_content += f'        <div class="col-header">{col_cat}</div>\n'

# Add charts with row labels
for row_idx, row_cat in enumerate(row_cats):
    html_content += f'        <div class="row-label">{row_cat}</div>\n'
    for col_idx, _col_cat in enumerate(col_cats):
        chart = charts[row_idx][col_idx]
        svg_data = chart.render(is_unicode=True)
        svg_data = svg_data.replace('<?xml version="1.0" encoding="utf-8"?>', "")
        html_content += f'        <div class="chart">{svg_data}</div>\n'

html_content += """    </div>
</body>
</html>"""

with open(f"plot-{THEME}.html", "w") as f:
    f.write(html_content)
Runnable source as JSON, for any HTTP client: https://api.anyplot.ai/specs/facet-grid/pygal/code. Any spec id and library id listed in llms-full.txt fit the same URL shape; every URL below is complete and callable.
{
  "spec_id": "facet-grid",
  "language": "python",
  "library": "pygal",
  "page": "https://anyplot.ai/facet-grid/python/pygal",
  "hub": "https://anyplot.ai/facet-grid",
  "code_json": "https://api.anyplot.ai/specs/facet-grid/pygal/code",
  "spec_json": "https://api.anyplot.ai/specs/facet-grid",
  "render_light_png": "https://storage.googleapis.com/anyplot-images/plots/facet-grid/python/pygal/plot-light.png",
  "render_dark_png": "https://storage.googleapis.com/anyplot-images/plots/facet-grid/python/pygal/plot-dark.png",
  "interactive_light_html": "https://storage.googleapis.com/anyplot-images/plots/facet-grid/python/pygal/plot-light.html",
  "interactive_dark_html": "https://storage.googleapis.com/anyplot-images/plots/facet-grid/python/pygal/plot-dark.html",
  "quality_score": 85.0,
  "license": "MIT",
  "guide": "https://anyplot.ai/llms.txt"
}
Part of Faceted Grid Plot on anyplot.ai.