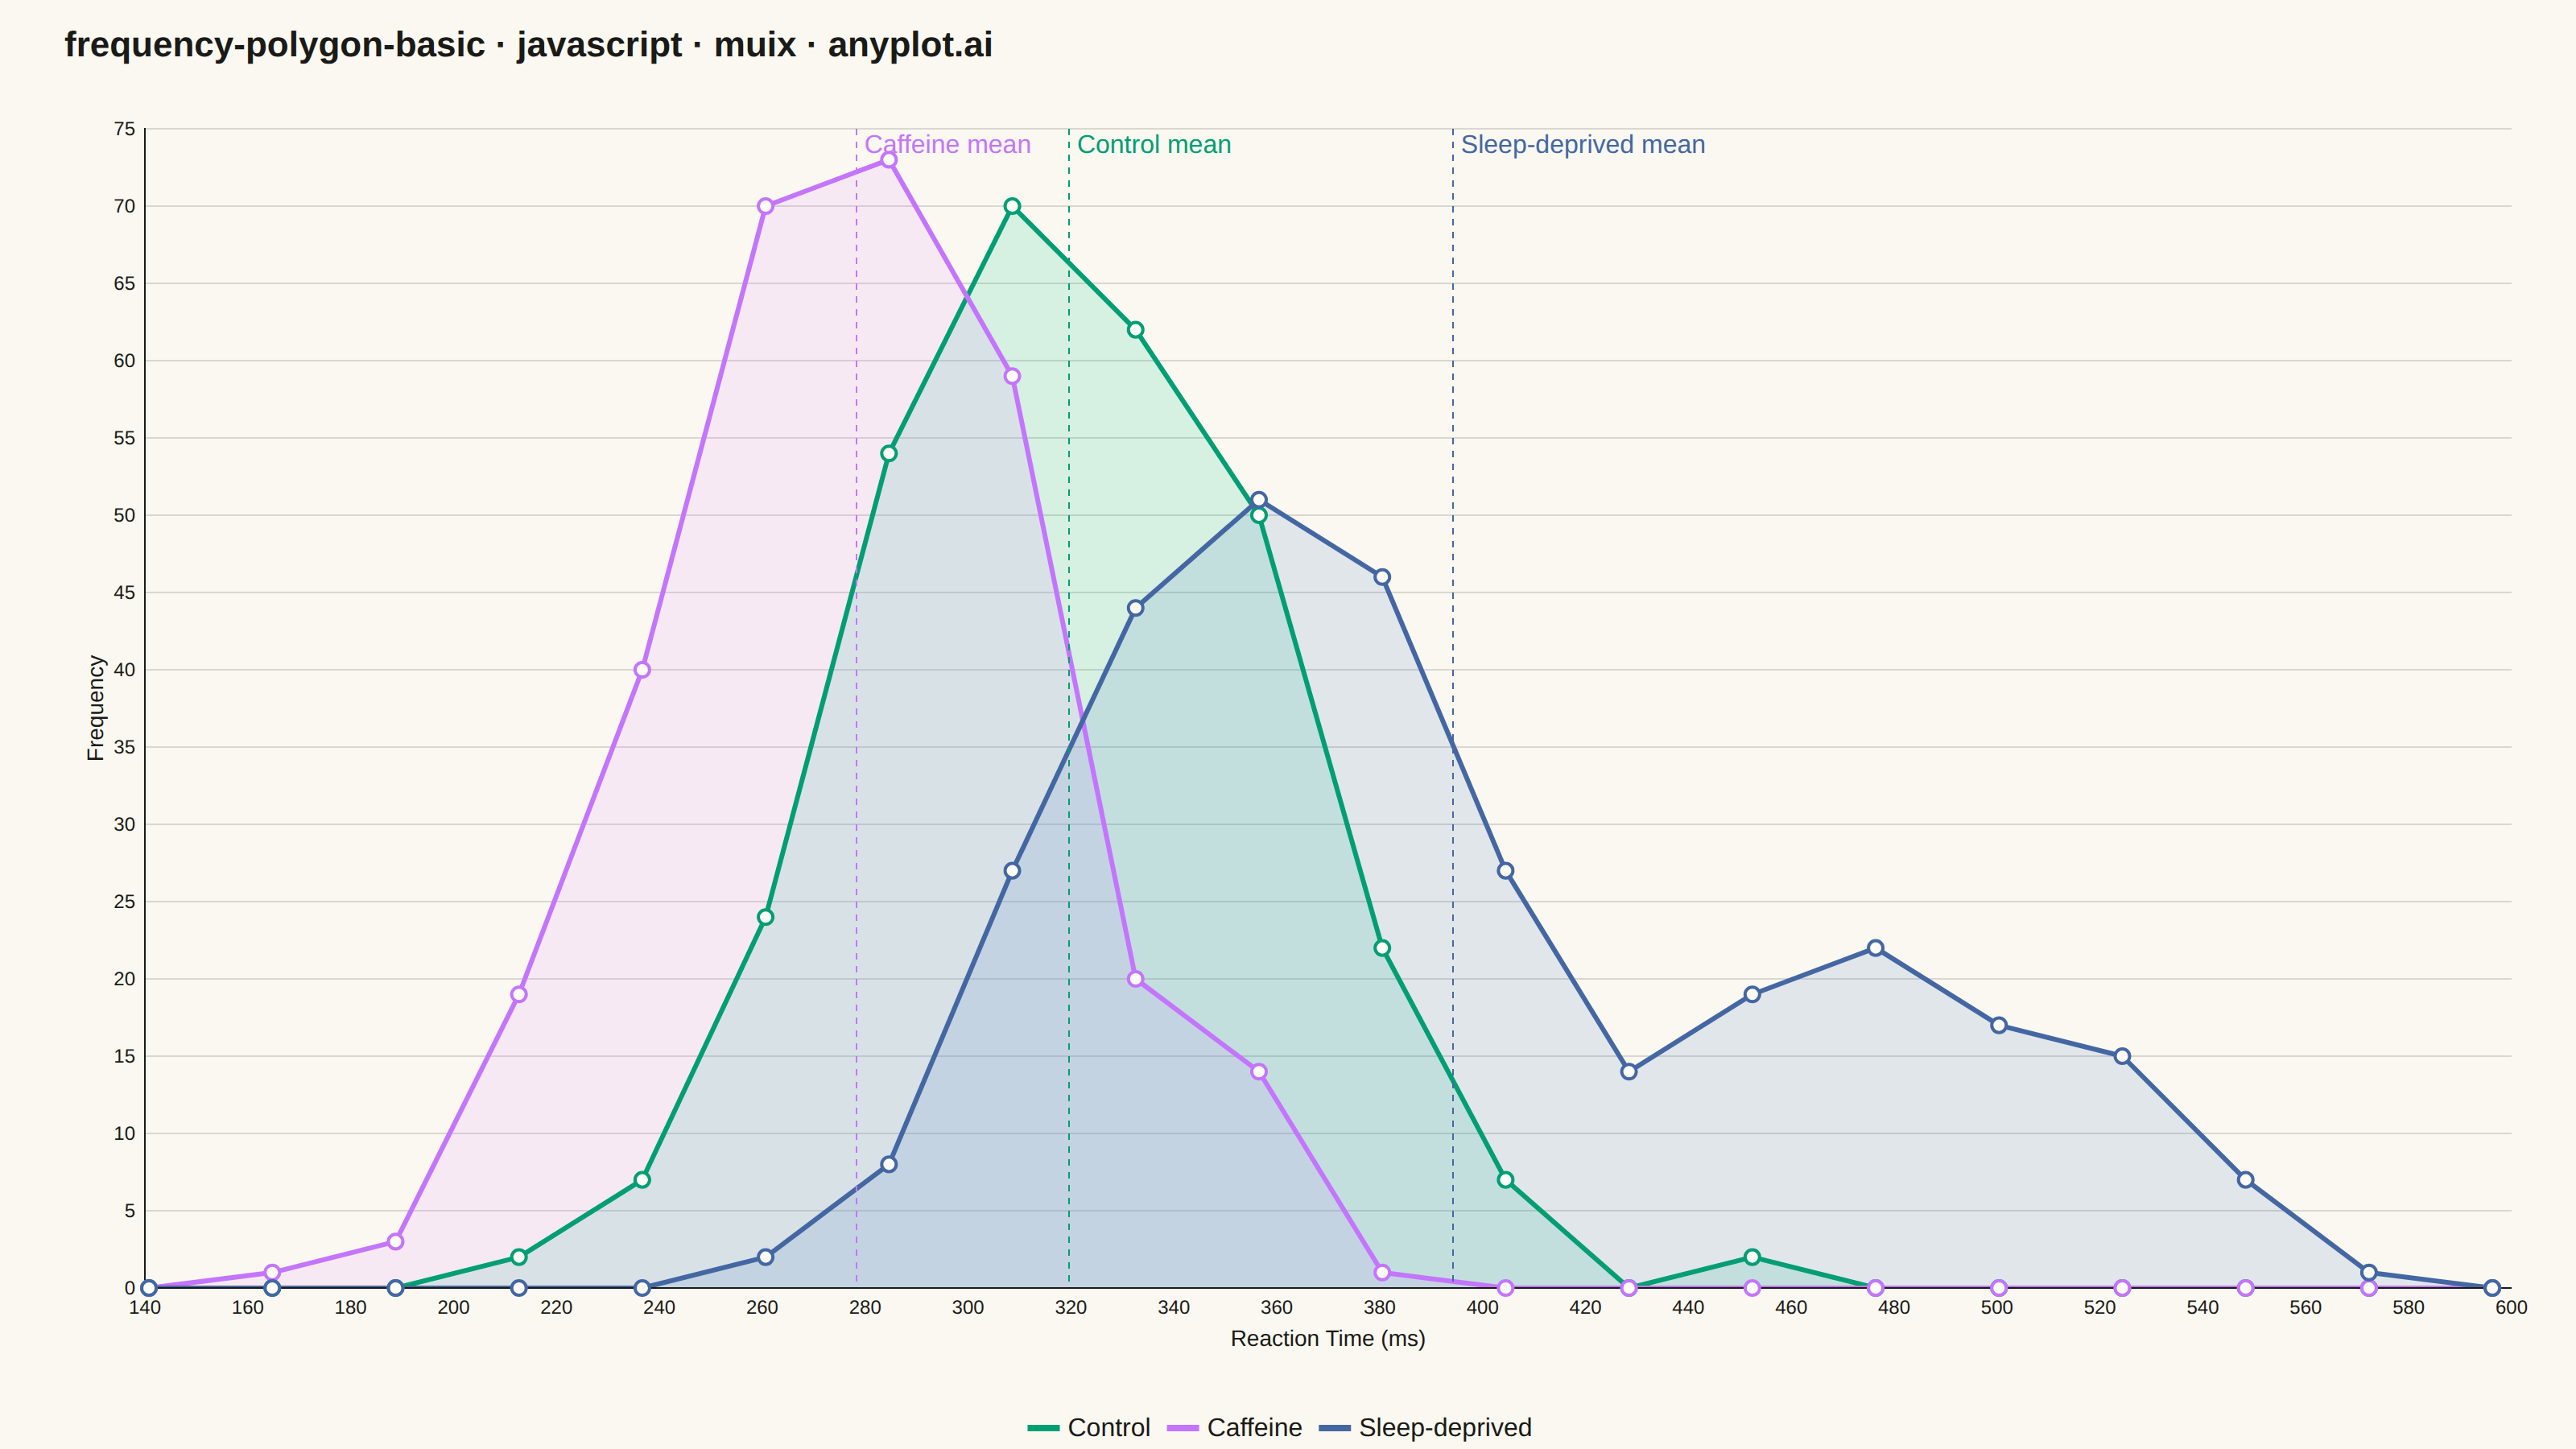
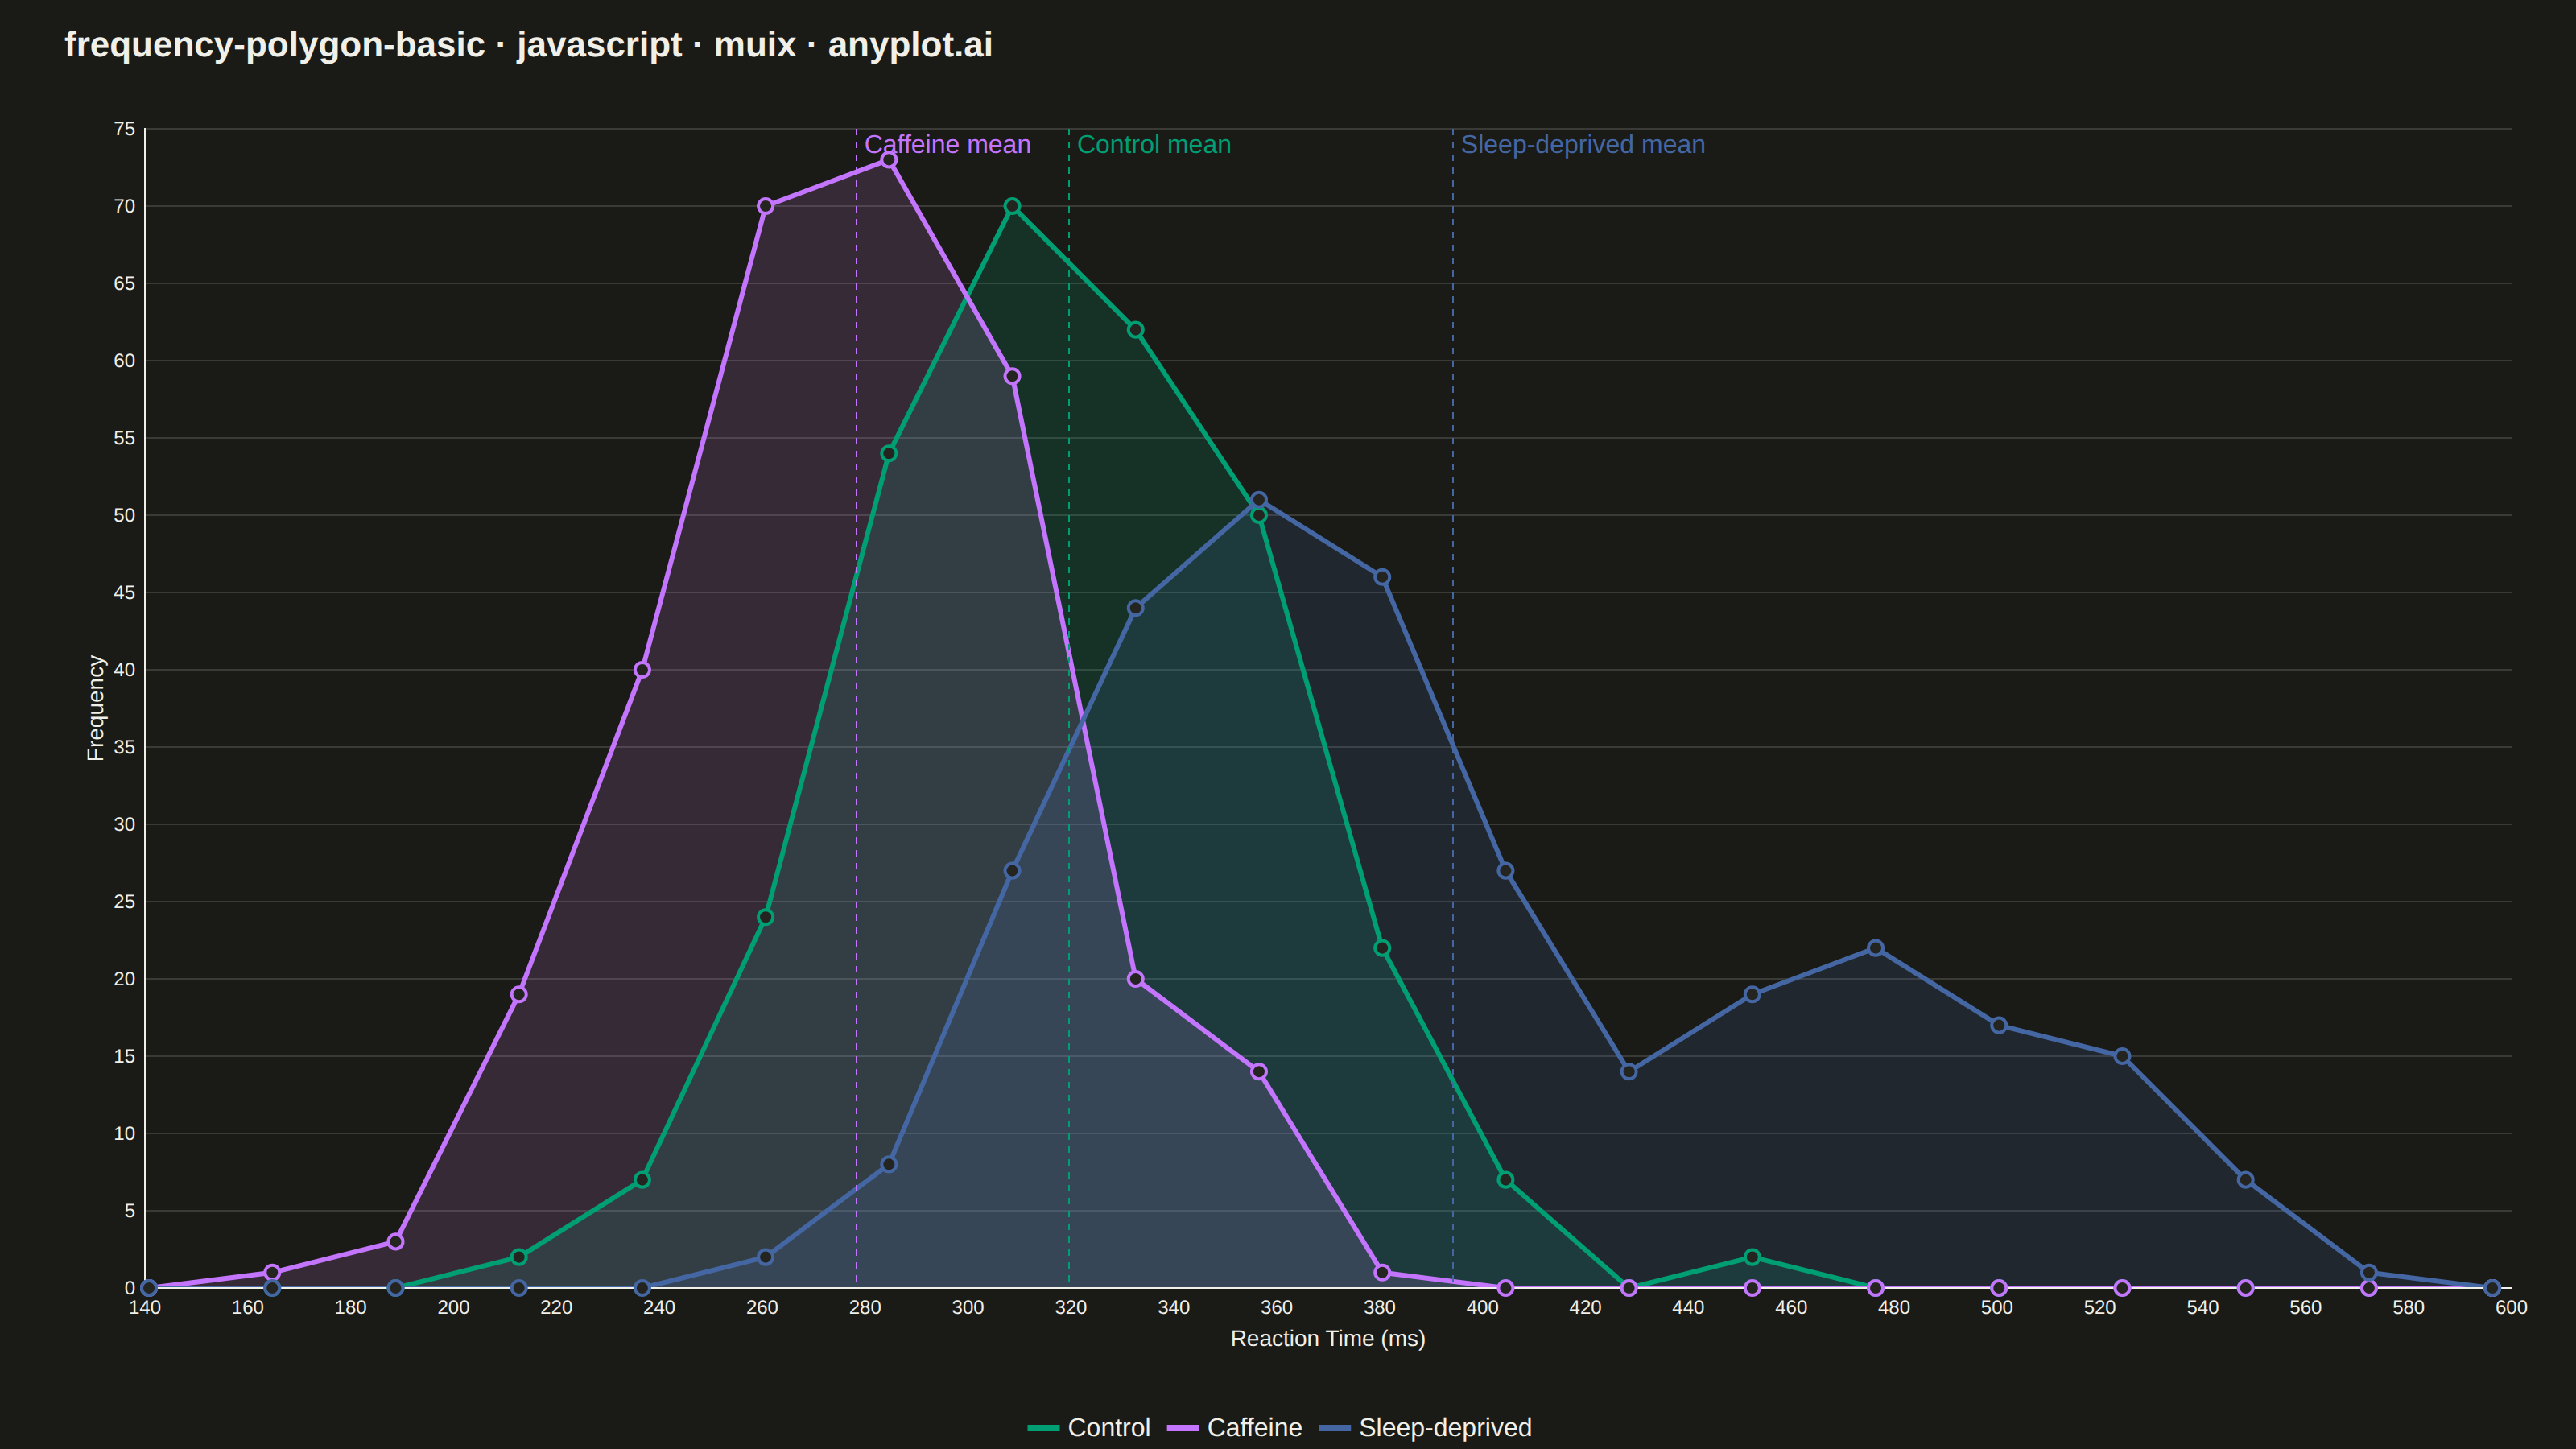
The same plot in 14 other libraries — JavaScript: Chart.js, D3.js, Apache ECharts, Highcharts; Python: Altair, Bokeh, lets-plot, Matplotlib, Plotly, plotnine, Pygal, Seaborn; R: ggplot2; Julia: Makie.jl. Compare all 15 side by side: Frequency Polygon for Distribution Comparison in Python, R, Julia and JavaScript.
A frequency polygon connects the midpoints of histogram bins with straight line segments, creating an outline of the distribution shape. This visualization excels at comparing multiple distributions simultaneously since lines overlap without obscuring each other, unlike stacked or overlapping histogram bars. Frequency polygons reveal differences in central tendency, spread, skewness, and modality across groups with minimal visual clutter.
// anyplot.ai
// frequency-polygon-basic: Frequency Polygon for Distribution Comparison
// Library: muix 7.29.1 | JavaScript 22.23.2
// Quality: 88/100 | Created: 2026-09-02
import { LineChart } from "@mui/x-charts/LineChart";
import { ChartsReferenceLine } from "@mui/x-charts/ChartsReferenceLine";
import Box from "@mui/material/Box";
import Typography from "@mui/material/Typography";

const t = window.ANYPLOT_TOKENS;
const TITLE = "frequency-polygon-basic · javascript · muix · anyplot.ai";
const TITLE_HEIGHT = 56;

// --- Data (in-memory, deterministic LCG — no seeded RNG in the browser) -----
function lcg(seed) {
  let state = seed;
  return () => {
    state = (state * 1664525 + 1013904223) % 4294967296;
    return state / 4294967296;
  };
}

function randomNormal(rand, mean, stdDev) {
  const u1 = Math.max(rand(), 1e-9);
  const u2 = rand();
  const z = Math.sqrt(-2 * Math.log(u1)) * Math.cos(2 * Math.PI * u2);
  return mean + z * stdDev;
}

// Draw from a mixture of normals: each call picks a component by weight,
// then samples from it. Used for the sleep-deprived condition to model
// occasional attentional lapses (microsleeps) on top of normal responses,
// producing a right-skewed / mildly bimodal shape.
function randomMixture(rand, components) {
  const pick = rand();
  let cumulative = 0;
  for (const component of components) {
    cumulative += component.weight;
    if (pick <= cumulative) {
      return randomNormal(rand, component.mean, component.stdDev);
    }
  }
  const last = components[components.length - 1];
  return randomNormal(rand, last.mean, last.stdDev);
}

// Simple visual-stimulus reaction times (ms) across three experimental
// conditions in a psychology lab study.
const SAMPLE_SIZE = 300;
const CONDITIONS = [
  { label: "Control", seed: 11, components: [{ weight: 1, mean: 320, stdDev: 40 }] },
  { label: "Caffeine", seed: 23, components: [{ weight: 1, mean: 280, stdDev: 35 }] },
  {
    // Mostly normal responses, plus a lapse-trial subgroup (microsleeps)
    // that pulls the tail out to the right and creates a second mode.
    label: "Sleep-deprived",
    seed: 37,
    components: [
      { weight: 0.68, mean: 350, stdDev: 35 },
      { weight: 0.32, mean: 475, stdDev: 45 },
    ],
  },
];
const samplesByCondition = CONDITIONS.map((condition) => {
  const rand = lcg(condition.seed);
  return Array.from({ length: SAMPLE_SIZE }, () =>
    Math.max(150, randomMixture(rand, condition.components)),
  );
});
const meanByCondition = samplesByCondition.map(
  (samples) => samples.reduce((sum, value) => sum + value, 0) / samples.length,
);

// Shared bin edges across all conditions so the polygons stay comparable.
const allTimes = samplesByCondition.flat();
const dataMin = Math.min(...allTimes);
const dataMax = Math.max(...allTimes);
const BIN_COUNT = 18;
const binWidth = (dataMax - dataMin) / BIN_COUNT;
const binEdges = Array.from({ length: BIN_COUNT + 1 }, (_, i) => dataMin + i * binWidth);
const binMidpoints = Array.from(
  { length: BIN_COUNT },
  (_, i) => (binEdges[i] + binEdges[i + 1]) / 2,
);

function histogram(samples) {
  const counts = new Array(BIN_COUNT).fill(0);
  samples.forEach((value) => {
    const index = Math.min(BIN_COUNT - 1, Math.floor((value - dataMin) / binWidth));
    counts[Math.max(0, index)] += 1;
  });
  return counts;
}
const countsByCondition = samplesByCondition.map(histogram);

// Extend each polygon one bin-width past the outer midpoints at zero so the
// outline closes at the baseline instead of hanging in mid-air.
const reactionTimes = [
  binMidpoints[0] - binWidth,
  ...binMidpoints,
  binMidpoints[BIN_COUNT - 1] + binWidth,
];
const frequenciesByCondition = countsByCondition.map((counts) => [0, ...counts, 0]);

// --- Chart (default-exported component — the harness mounts it) -------------
export default function Chart() {
  const { width, height } = window.ANYPLOT_SIZE;
  const chartHeight = height - TITLE_HEIGHT;

  return (
    <Box sx={{ width, height, bgcolor: t.pageBg }}>
      <Box
        sx={{
          height: TITLE_HEIGHT,
          display: "flex",
          alignItems: "center",
          px: "40px",
        }}
      >
        <Typography sx={{ color: t.ink, fontSize: "22px", fontWeight: 600, lineHeight: 1 }}>
          {TITLE}
        </Typography>
      </Box>
      <LineChart
        width={width}
        height={chartHeight}
        skipAnimation
        colors={t.palette.slice(0, CONDITIONS.length)}
        grid={{ horizontal: true }}
        xAxis={[
          {
            data: reactionTimes,
            scaleType: "linear",
            label: "Reaction Time (ms)",
            valueFormatter: (v) => Math.round(v).toString(),
            disableTicks: true,
          },
        ]}
        yAxis={[
          {
            min: 0,
            label: "Frequency",
            disableTicks: true,
          },
        ]}
        series={CONDITIONS.map((condition, index) => ({
          id: condition.label,
          data: frequenciesByCondition[index],
          label: condition.label,
          curve: "linear",
          area: true,
          showMark: true,
        }))}
        margin={{ top: 24, bottom: 100, left: 90, right: 40 }}
        sx={{
          "& .MuiAreaElement-root": { fillOpacity: 0.14 },
          "& .MuiLineElement-root": { strokeWidth: 3 },
          "& .MuiMarkElement-root": { strokeWidth: 2, r: 3.5 },
          "& .MuiChartsAxis-tickLabel": { fontSize: "14px" },
          "& .MuiChartsAxis-label": { fontSize: "16px" },
          "& .MuiChartsAxis-line": { stroke: t.grid },
          "& .MuiChartsLegend-label": { fontSize: "15px" },
          "& .MuiChartsGrid-line": { stroke: t.grid, strokeWidth: 0.75 },
          "& .MuiChartsReferenceLine-line": { strokeDasharray: "4 4", strokeWidth: 1.5 },
          "& .MuiChartsReferenceLine-label": { fontSize: "11px" },
        }}
        slotProps={{
          legend: {
            position: { vertical: "bottom", horizontal: "middle" },
            itemMarkWidth: 20,
            itemMarkHeight: 4,
            padding: { top: 20 },
          },
        }}
      >
        {CONDITIONS.map((condition, index) => (
          <ChartsReferenceLine
            key={condition.label}
            x={meanByCondition[index]}
            lineStyle={{ stroke: t.palette[index] }}
            labelStyle={{ fill: t.palette[index] }}
            label={`${condition.label} mean`}
            labelAlign="start"
          />
        ))}
      </LineChart>
    </Box>
  );
}
Runnable source as JSON, for any HTTP client: https://api.anyplot.ai/specs/frequency-polygon-basic/muix/code. Any spec id and library id listed in llms-full.txt fit the same URL shape; every URL below is complete and callable.
{
  "spec_id": "frequency-polygon-basic",
  "language": "javascript",
  "library": "muix",
  "page": "https://anyplot.ai/frequency-polygon-basic/javascript/muix",
  "hub": "https://anyplot.ai/frequency-polygon-basic",
  "code_json": "https://api.anyplot.ai/specs/frequency-polygon-basic/muix/code",
  "spec_json": "https://api.anyplot.ai/specs/frequency-polygon-basic",
  "render_light_png": "https://storage.googleapis.com/anyplot-images/plots/frequency-polygon-basic/javascript/muix/plot-light.png",
  "render_dark_png": "https://storage.googleapis.com/anyplot-images/plots/frequency-polygon-basic/javascript/muix/plot-dark.png",
  "interactive_light_html": "https://storage.googleapis.com/anyplot-images/plots/frequency-polygon-basic/javascript/muix/plot-light.html",
  "interactive_dark_html": "https://storage.googleapis.com/anyplot-images/plots/frequency-polygon-basic/javascript/muix/plot-dark.html",
  "quality_score": 88.0,
  "license": "MIT",
  "guide": "https://anyplot.ai/llms.txt"
}
Part of Frequency Polygon for Distribution Comparison on anyplot.ai.