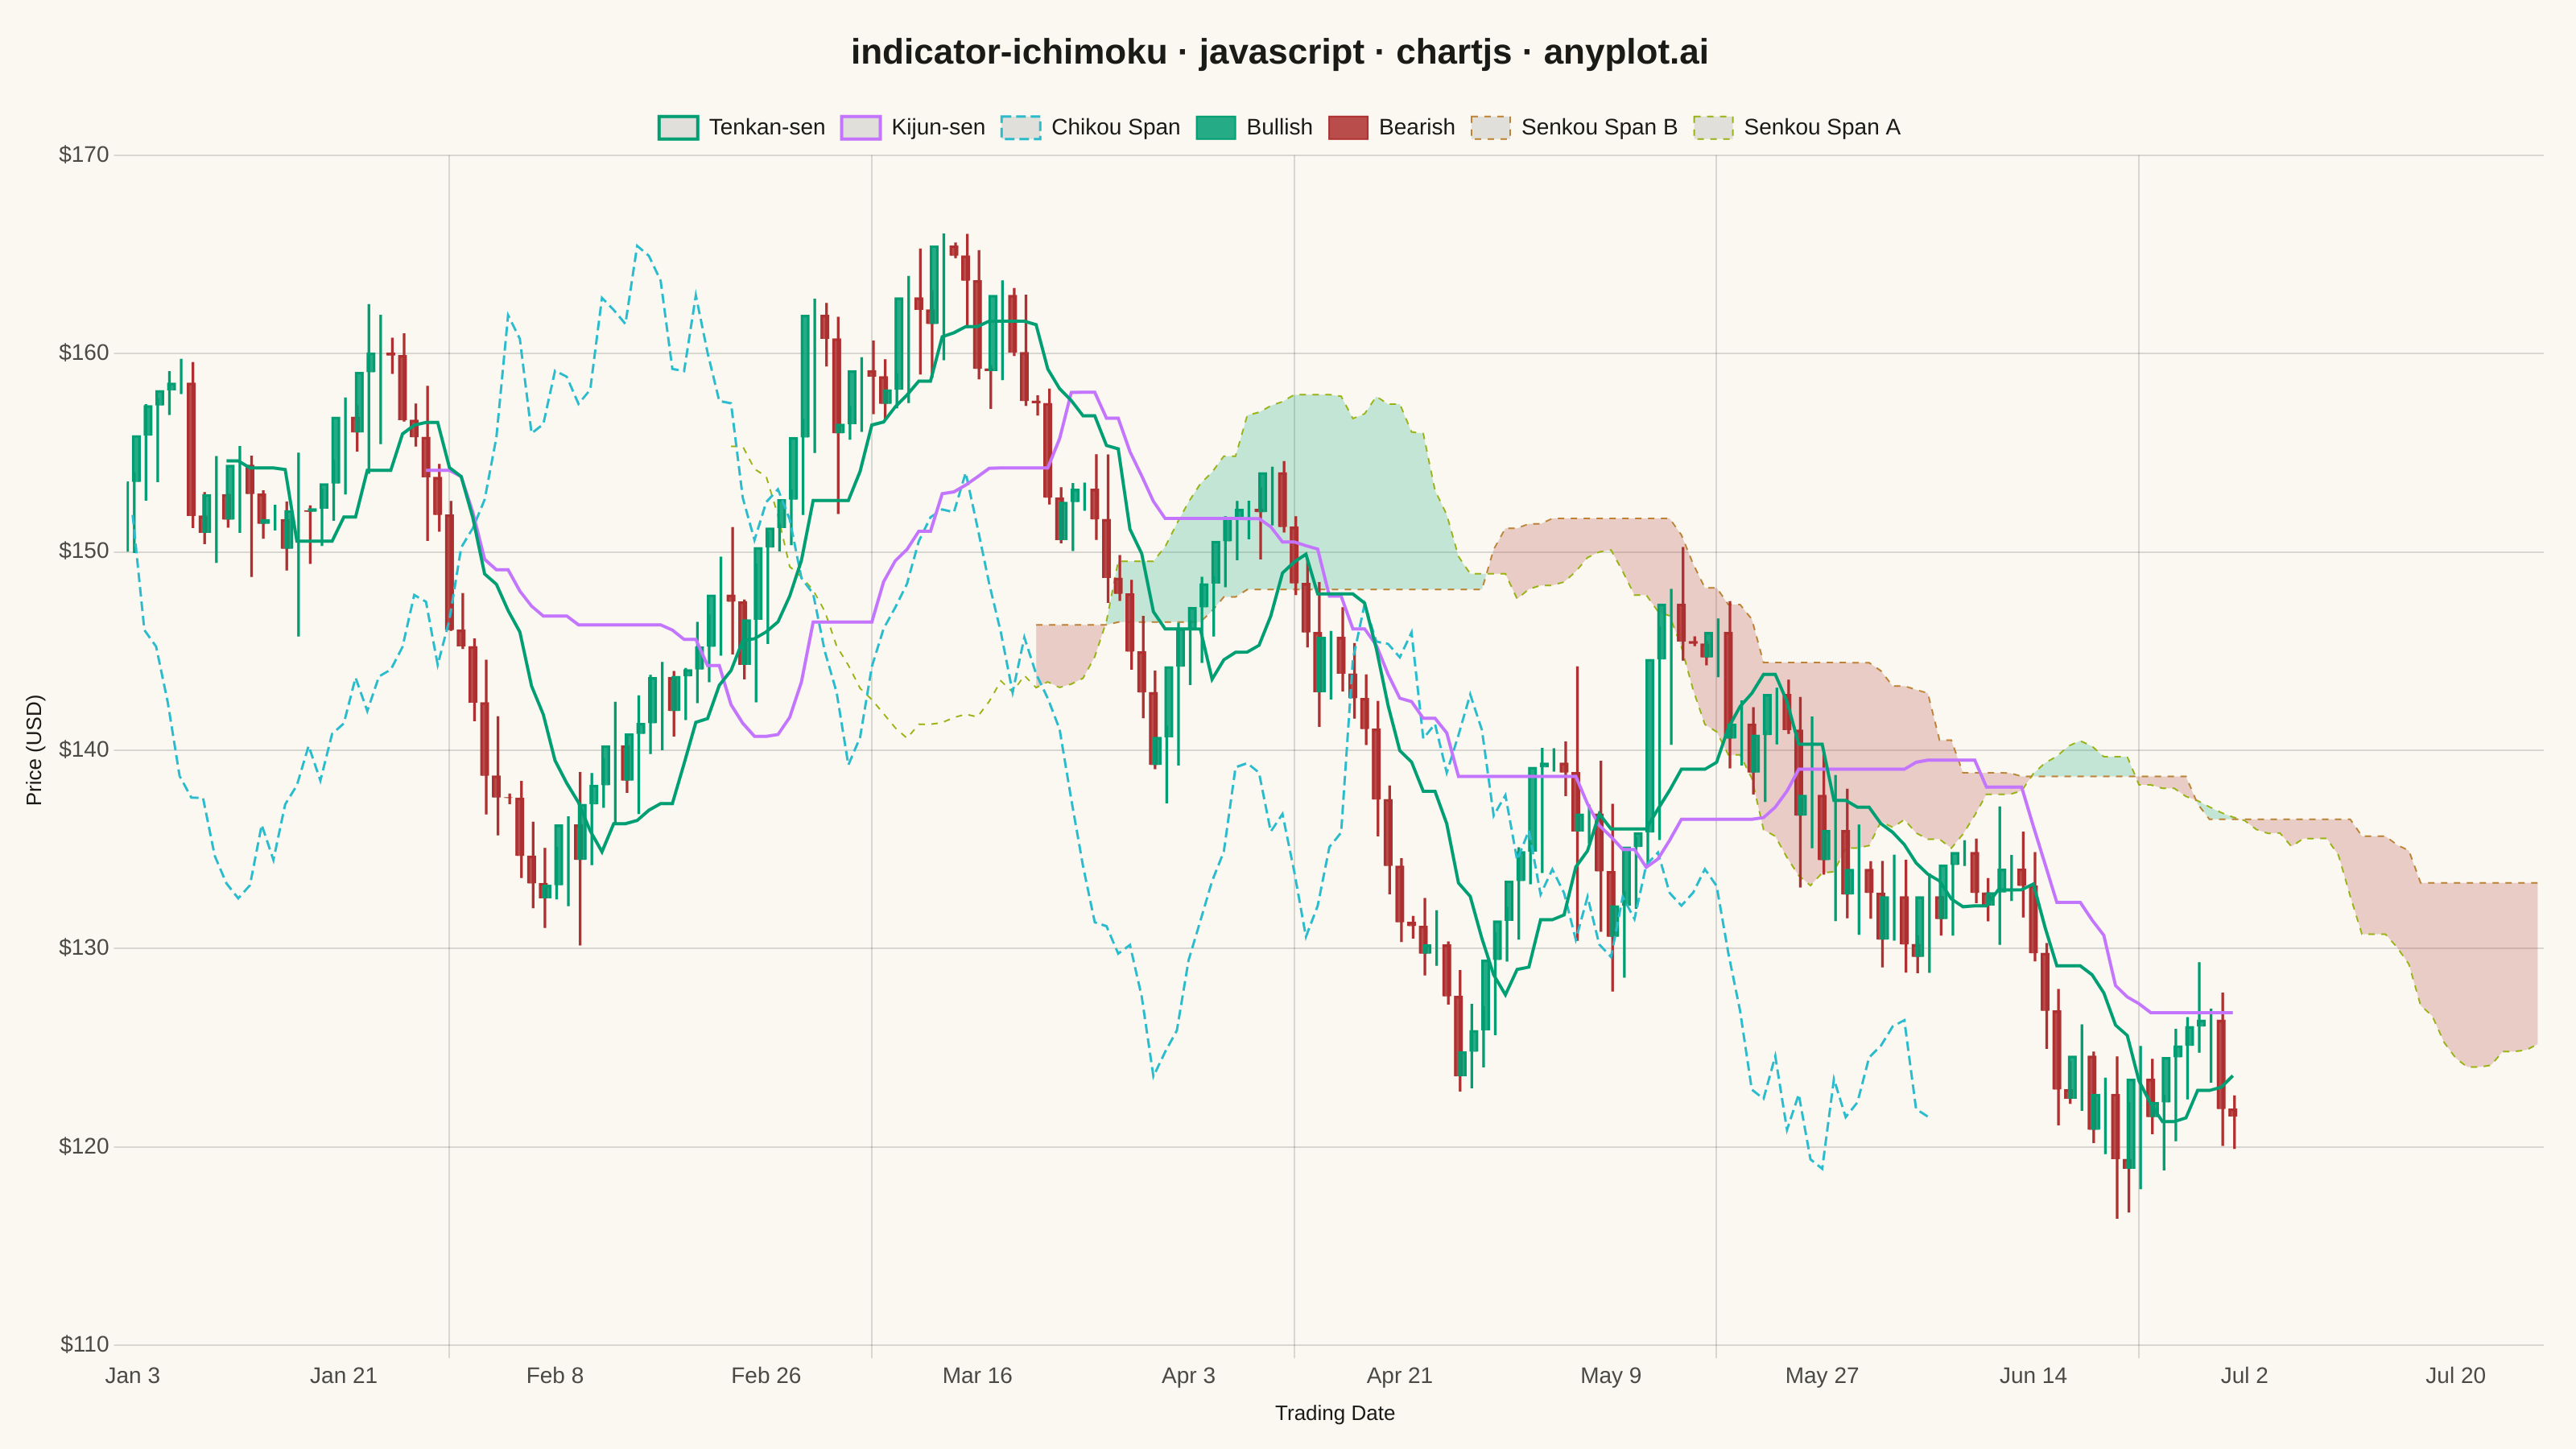
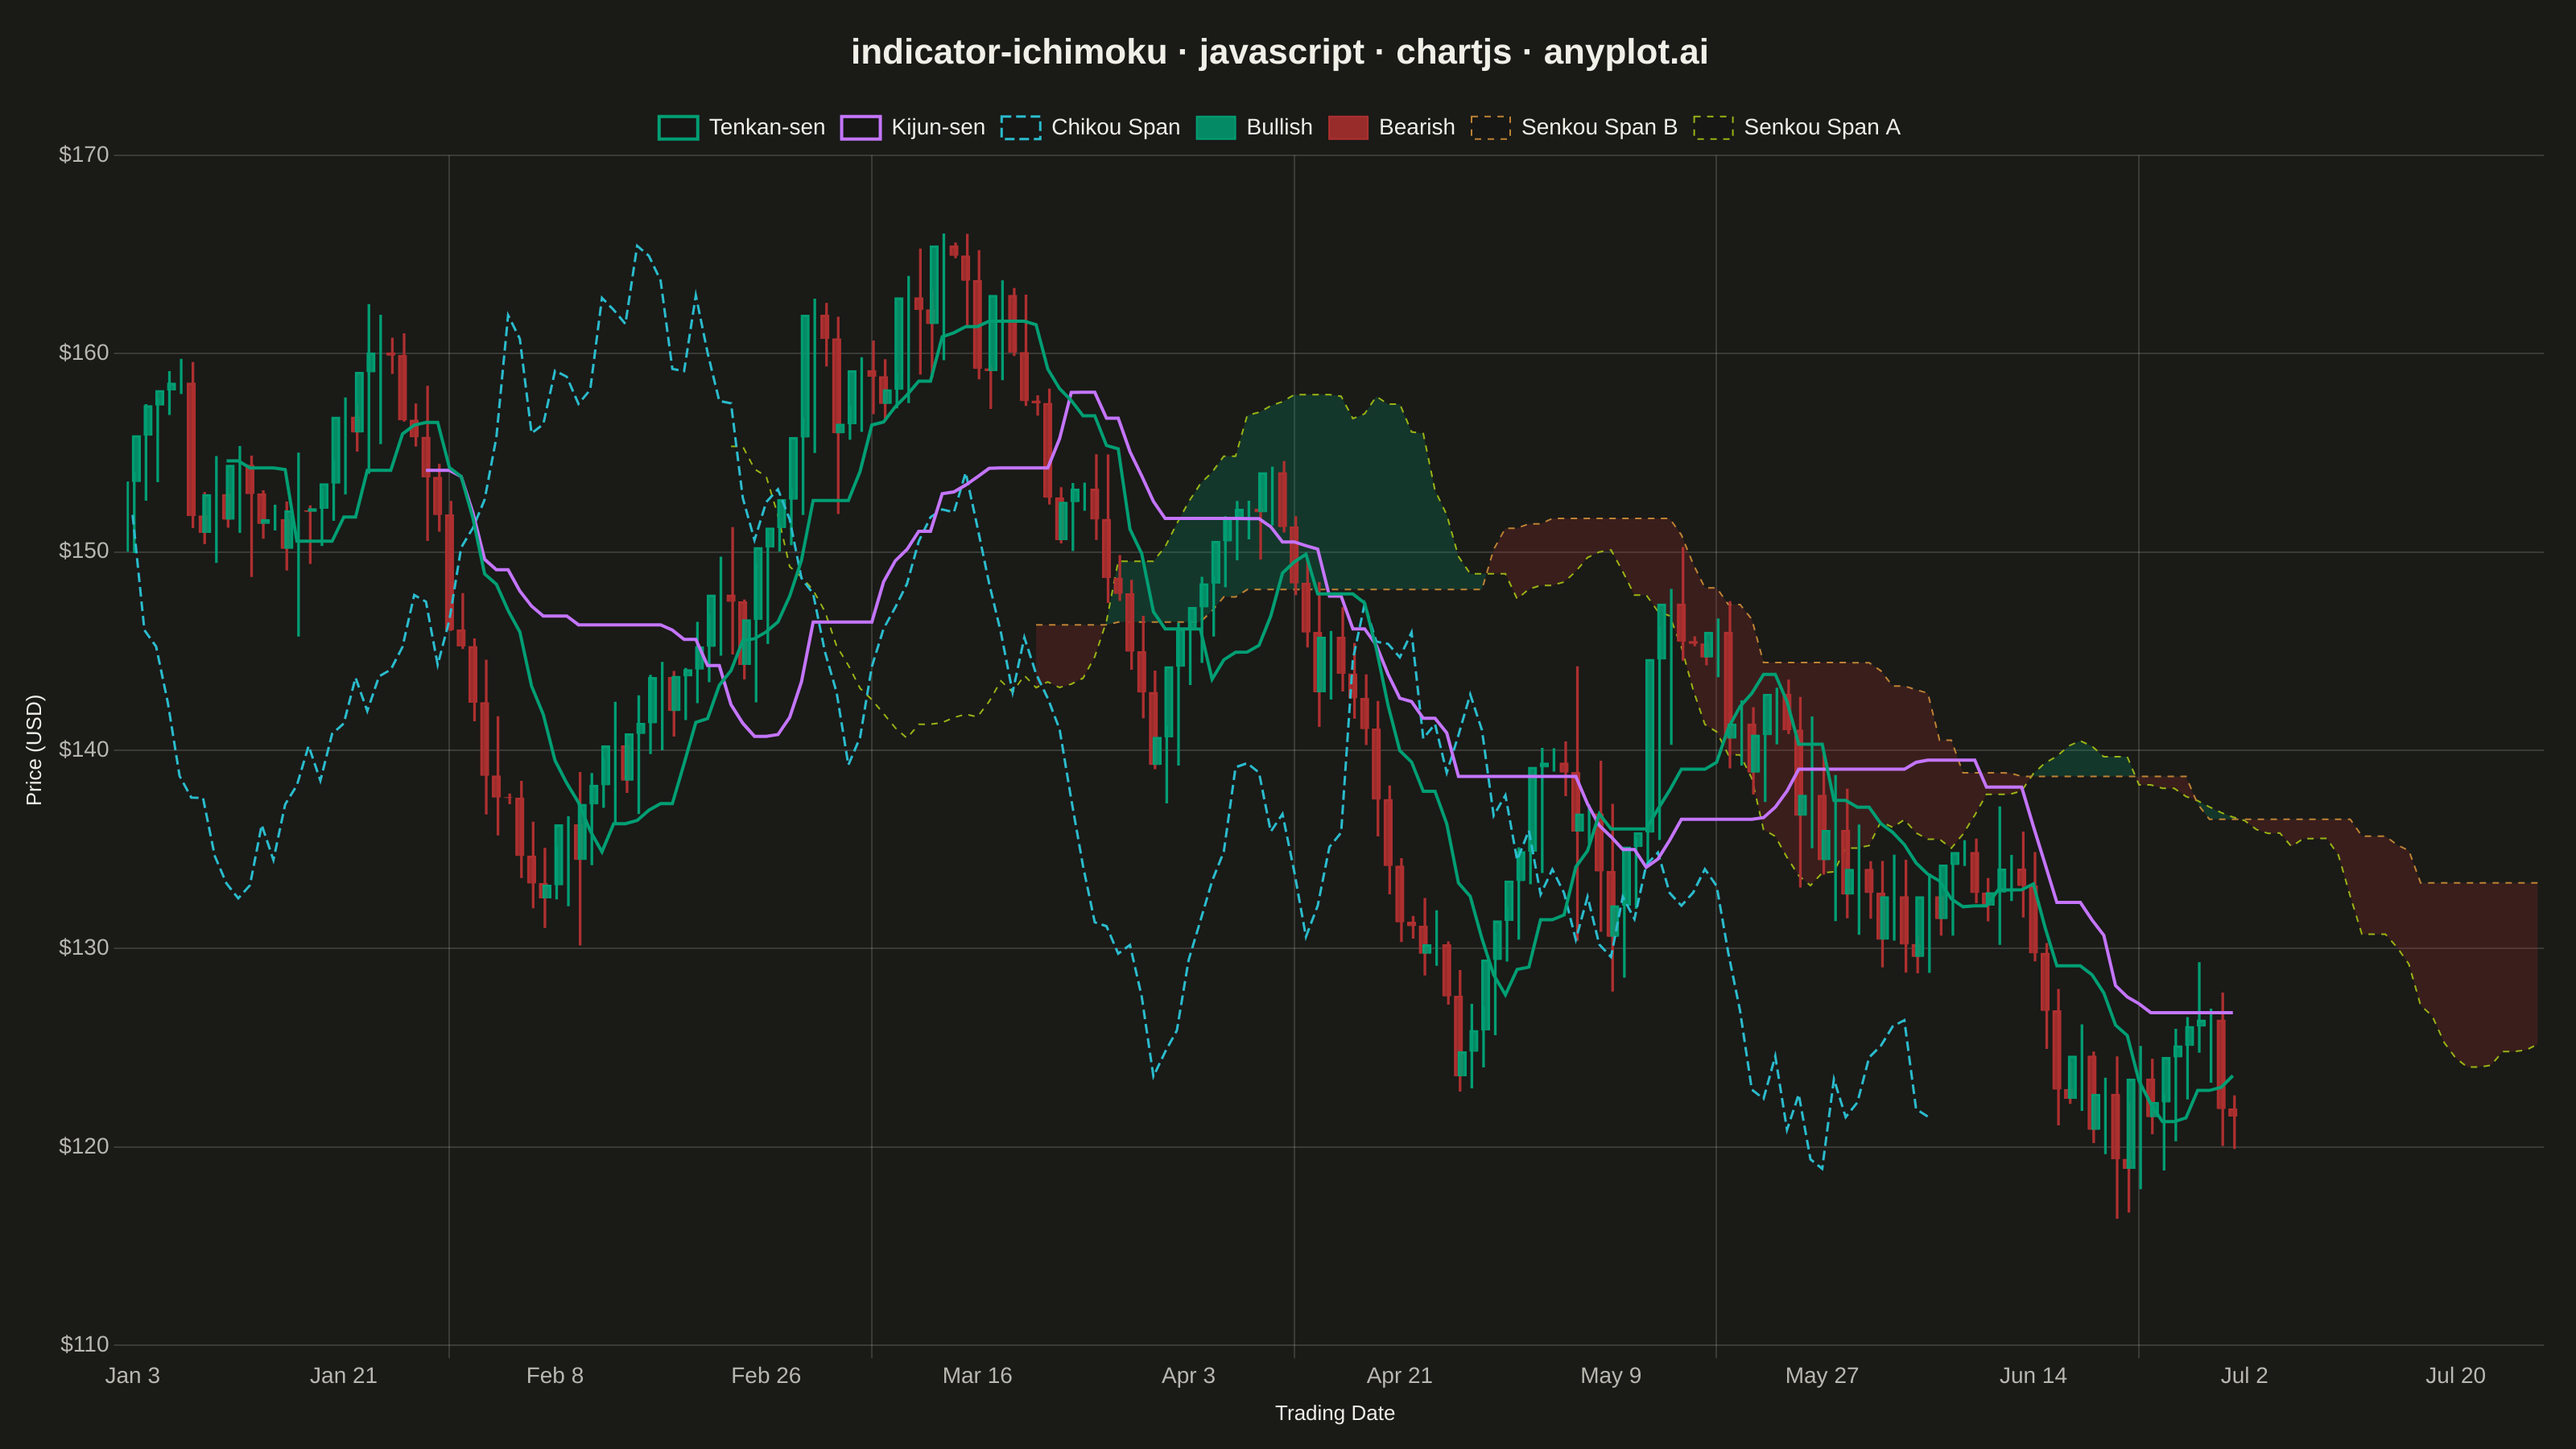
The same plot in 14 other libraries — JavaScript: D3.js, Apache ECharts, Highcharts, MUI X Charts; Python: Altair, Bokeh, lets-plot, Matplotlib, Plotly, plotnine, Pygal, Seaborn; R: ggplot2; Julia: Makie.jl. Compare all 15 side by side: Ichimoku Cloud Technical Indicator Chart in Python, R, Julia and JavaScript.
Displays the Ichimoku Kinko Hyo ("one glance equilibrium chart") overlay on a candlestick price chart. The indicator plots five lines — Tenkan-sen (conversion), Kijun-sen (base), Senkou Span A, Senkou Span B, and Chikou Span (lagging) — with the area between Senkou Span A and B filled as the "Kumo" (cloud). The cloud color changes depending on which span is on top, providing an at-a-glance view of trend direction, momentum, and support/resistance zones.
// anyplot.ai
// indicator-ichimoku: Ichimoku Cloud Technical Indicator Chart
// Library: chartjs 4.4.7 | JavaScript 22.22.3
// Quality: 88/100 | Created: 2026-06-08
//# anyplot-orientation: landscape

const t = window.ANYPLOT_TOKENS;

// --- Data (deterministic OHLC + Ichimoku indicators) -----------------------
const N      = 180;   // trading periods
const FUTURE = 26;    // Ichimoku look-forward shift
const TOTAL  = N + FUTURE;

// Seeded LCG for reproducible pseudo-random data (no seedable Math.random in browser)
let seed = 42;
function rng() {
  seed = (seed * 1664525 + 1013904223) & 0xffffffff;
  return (seed >>> 0) / 0xffffffff;
}
function randn() {
  const u = rng() + 1e-10;
  return Math.sqrt(-2 * Math.log(u)) * Math.cos(2 * Math.PI * rng());
}

// Simulated equity OHLC price series
const opens  = new Array(N);
const closes = new Array(N);
const highs  = new Array(N);
const lows   = new Array(N);
let price = 150;
for (let i = 0; i < N; i++) {
  const drift = randn() * 2.5;
  const range = (Math.abs(randn()) + 0.5) * 1.8;
  opens[i]  = price;
  closes[i] = price + drift;
  highs[i]  = Math.max(opens[i], closes[i]) + range * rng();
  lows[i]   = Math.min(opens[i], closes[i]) - range * rng();
  price     = closes[i];
}

// Period high/low helpers for Ichimoku computation
function hiN(arr, end, n) {
  let m = -Infinity;
  for (let j = Math.max(0, end - n + 1); j <= end; j++) m = Math.max(m, arr[j]);
  return m;
}
function loN(arr, end, n) {
  let m = Infinity;
  for (let j = Math.max(0, end - n + 1); j <= end; j++) m = Math.min(m, arr[j]);
  return m;
}

// Ichimoku components (standard 9 / 26 / 52 parameters)
const tenkan = new Array(TOTAL).fill(null);
const kijun  = new Array(TOTAL).fill(null);
const spanA  = new Array(TOTAL).fill(null);
const spanB  = new Array(TOTAL).fill(null);
const chikou = new Array(TOTAL).fill(null);

for (let i = 0; i < N; i++) {
  if (i >= 8)
    tenkan[i] = (hiN(highs, i, 9)  + loN(lows, i, 9))  / 2;
  if (i >= 25)
    kijun[i]  = (hiN(highs, i, 26) + loN(lows, i, 26)) / 2;
  if (tenkan[i] !== null && kijun[i] !== null)
    spanA[i + FUTURE] = (tenkan[i] + kijun[i]) / 2;
  if (i >= 51)
    spanB[i + FUTURE] = (hiN(highs, i, 52) + loN(lows, i, 52)) / 2;
  if (i >= FUTURE)
    chikou[i - FUTURE] = closes[i];
}

// X-axis labels (sequential calendar dates starting 2023-01-03)
const dateStart = new Date('2023-01-03');
const labels = Array.from({ length: TOTAL }, (_, i) => {
  const d = new Date(dateStart);
  d.setDate(d.getDate() + i);
  return d.toLocaleDateString('en-US', { month: 'short', day: 'numeric' });
});

// Floating-bar arrays for candlestick simulation
const wickData   = Array.from({ length: TOTAL }, (_, i) =>
  i < N ? [lows[i], highs[i]] : null);
const bodyUpData = Array.from({ length: TOTAL }, (_, i) =>
  i < N && closes[i] >= opens[i] ? [opens[i], closes[i]] : null);
const bodyDnData = Array.from({ length: TOTAL }, (_, i) =>
  i < N && closes[i] <  opens[i] ? [closes[i], opens[i]] : null);

// Per-bar wick colour (Imprint: green = up / matte-red = down, semantic exception)
const wickColors = Array.from({ length: TOTAL }, (_, i) =>
  i < N ? (closes[i] >= opens[i] ? t.palette[0] : t.palette[4]) : 'transparent');

// --- Mount ------------------------------------------------------------------
document.getElementById('container').style.backgroundColor = t.pageBg;
const canvas = document.createElement('canvas');
document.getElementById('container').appendChild(canvas);

// --- Chart ------------------------------------------------------------------
const titleText = 'indicator-ichimoku · javascript · chartjs · anyplot.ai';
const titleSize = Math.max(14, Math.round(22 * Math.min(1, 67 / titleText.length)));

new Chart(canvas, {
  type: 'bar',
  plugins: [{
    id: 'bgFill',
    beforeDraw(chart) {
      const ctx = chart.ctx;
      ctx.save();
      ctx.fillStyle = t.pageBg;
      ctx.fillRect(0, 0, chart.width, chart.height);
      ctx.restore();
    },
  }],
  data: {
    labels,
    datasets: [
      // ── Ichimoku Kumo cloud (rendered behind price data) ─────────────────
      {
        type: 'line',
        label: 'Senkou Span B',
        data: spanB,
        borderColor: t.palette[3],        // #BD8233 ochre — cloud boundary
        borderWidth: 1,
        borderDash: [4, 4],
        pointRadius: 0,
        spanGaps: false,
        fill: false,
        order: 10,
      },
      {
        type: 'line',
        label: 'Senkou Span A',
        data: spanA,
        borderColor: t.palette[7],        // #99B314 lime — cloud boundary
        borderWidth: 1,
        borderDash: [4, 4],
        pointRadius: 0,
        spanGaps: false,
        // Fill between Span A and Span B (dataset index 0):
        // above = Span A > Span B = bullish Kumo (green)
        // below = Span A < Span B = bearish Kumo (red)
        fill: {
          target: 0,
          above: 'rgba(0,158,115,0.22)',
          below: 'rgba(174,48,48,0.22)',
        },
        order: 10,
      },
      // ── Candlestick wicks (thin floating bars: low → high) ───────────────
      {
        type: 'bar',
        label: '_wick',
        data: wickData,
        backgroundColor: wickColors,
        borderWidth: 0,
        barThickness: 1,
        order: 5,
      },
      // ── Candlestick bodies (floating bars: open → close) ─────────────────
      {
        type: 'bar',
        label: 'Bullish',
        data: bodyUpData,
        backgroundColor: 'rgba(0,158,115,0.85)',
        borderColor: t.palette[0],
        borderWidth: 1,
        barThickness: 5,
        order: 4,
      },
      {
        type: 'bar',
        label: 'Bearish',
        data: bodyDnData,
        backgroundColor: 'rgba(174,48,48,0.85)',
        borderColor: t.palette[4],
        borderWidth: 1,
        barThickness: 5,
        order: 4,
      },
      // ── Tenkan-sen & Kijun-sen (primary Ichimoku signal lines) ────────────
      {
        type: 'line',
        label: 'Tenkan-sen',
        data: tenkan,
        borderColor: t.palette[0],        // #009E73 brand green — first categorical series
        borderWidth: 2,
        pointRadius: 0,
        spanGaps: false,
        fill: false,
        order: 1,
      },
      {
        type: 'line',
        label: 'Kijun-sen',
        data: kijun,
        borderColor: t.palette[1],        // #C475FD lavender
        borderWidth: 2,
        pointRadius: 0,
        spanGaps: false,
        fill: false,
        order: 1,
      },
      // ── Chikou Span (lagging line: close plotted 26 periods in the past) ──
      {
        type: 'line',
        label: 'Chikou Span',
        data: chikou,
        borderColor: t.palette[5],        // #2ABCCD cyan
        borderWidth: 1.5,
        borderDash: [6, 3],
        pointRadius: 0,
        spanGaps: false,
        fill: false,
        order: 1,
      },
    ],
  },
  options: {
    responsive: true,
    maintainAspectRatio: false,
    animation: false,
    layout: { padding: { top: 10, right: 20, bottom: 10, left: 10 } },
    plugins: {
      title: {
        display: true,
        text: titleText,
        color: t.ink,
        font: { size: titleSize },
        padding: { top: 10, bottom: 16 },
      },
      legend: {
        labels: {
          color: t.ink,
          font: { size: 14 },
          filter: (item) => !item.text.startsWith('_'),
          boxWidth: 24,
        },
      },
    },
    scales: {
      x: {
        ticks: {
          color: t.inkSoft,
          font: { size: 14 },
          maxTicksLimit: 12,
          maxRotation: 0,
        },
        grid: { color: t.grid },
        border: { display: false },
        title: {
          display: true,
          text: 'Trading Date',
          color: t.ink,
          font: { size: 13 },
        },
      },
      y: {
        beginAtZero: false,
        ticks: {
          color: t.inkSoft,
          font: { size: 14 },
          callback: (v) => '$' + v.toFixed(0),
        },
        grid: { color: t.grid },
        border: { display: false },
        title: {
          display: true,
          text: 'Price (USD)',
          color: t.ink,
          font: { size: 13 },
        },
      },
    },
  },
});
Runnable source as JSON, for any HTTP client: https://api.anyplot.ai/specs/indicator-ichimoku/chartjs/code. Any spec id and library id listed in llms-full.txt fit the same URL shape; every URL below is complete and callable.
{
  "spec_id": "indicator-ichimoku",
  "language": "javascript",
  "library": "chartjs",
  "page": "https://anyplot.ai/indicator-ichimoku/javascript/chartjs",
  "hub": "https://anyplot.ai/indicator-ichimoku",
  "code_json": "https://api.anyplot.ai/specs/indicator-ichimoku/chartjs/code",
  "spec_json": "https://api.anyplot.ai/specs/indicator-ichimoku",
  "render_light_png": "https://storage.googleapis.com/anyplot-images/plots/indicator-ichimoku/javascript/chartjs/plot-light.png",
  "render_dark_png": "https://storage.googleapis.com/anyplot-images/plots/indicator-ichimoku/javascript/chartjs/plot-dark.png",
  "interactive_light_html": "https://storage.googleapis.com/anyplot-images/plots/indicator-ichimoku/javascript/chartjs/plot-light.html",
  "interactive_dark_html": "https://storage.googleapis.com/anyplot-images/plots/indicator-ichimoku/javascript/chartjs/plot-dark.html",
  "quality_score": 88.0,
  "license": "MIT",
  "guide": "https://anyplot.ai/llms.txt"
}
Part of Ichimoku Cloud Technical Indicator Chart on anyplot.ai.