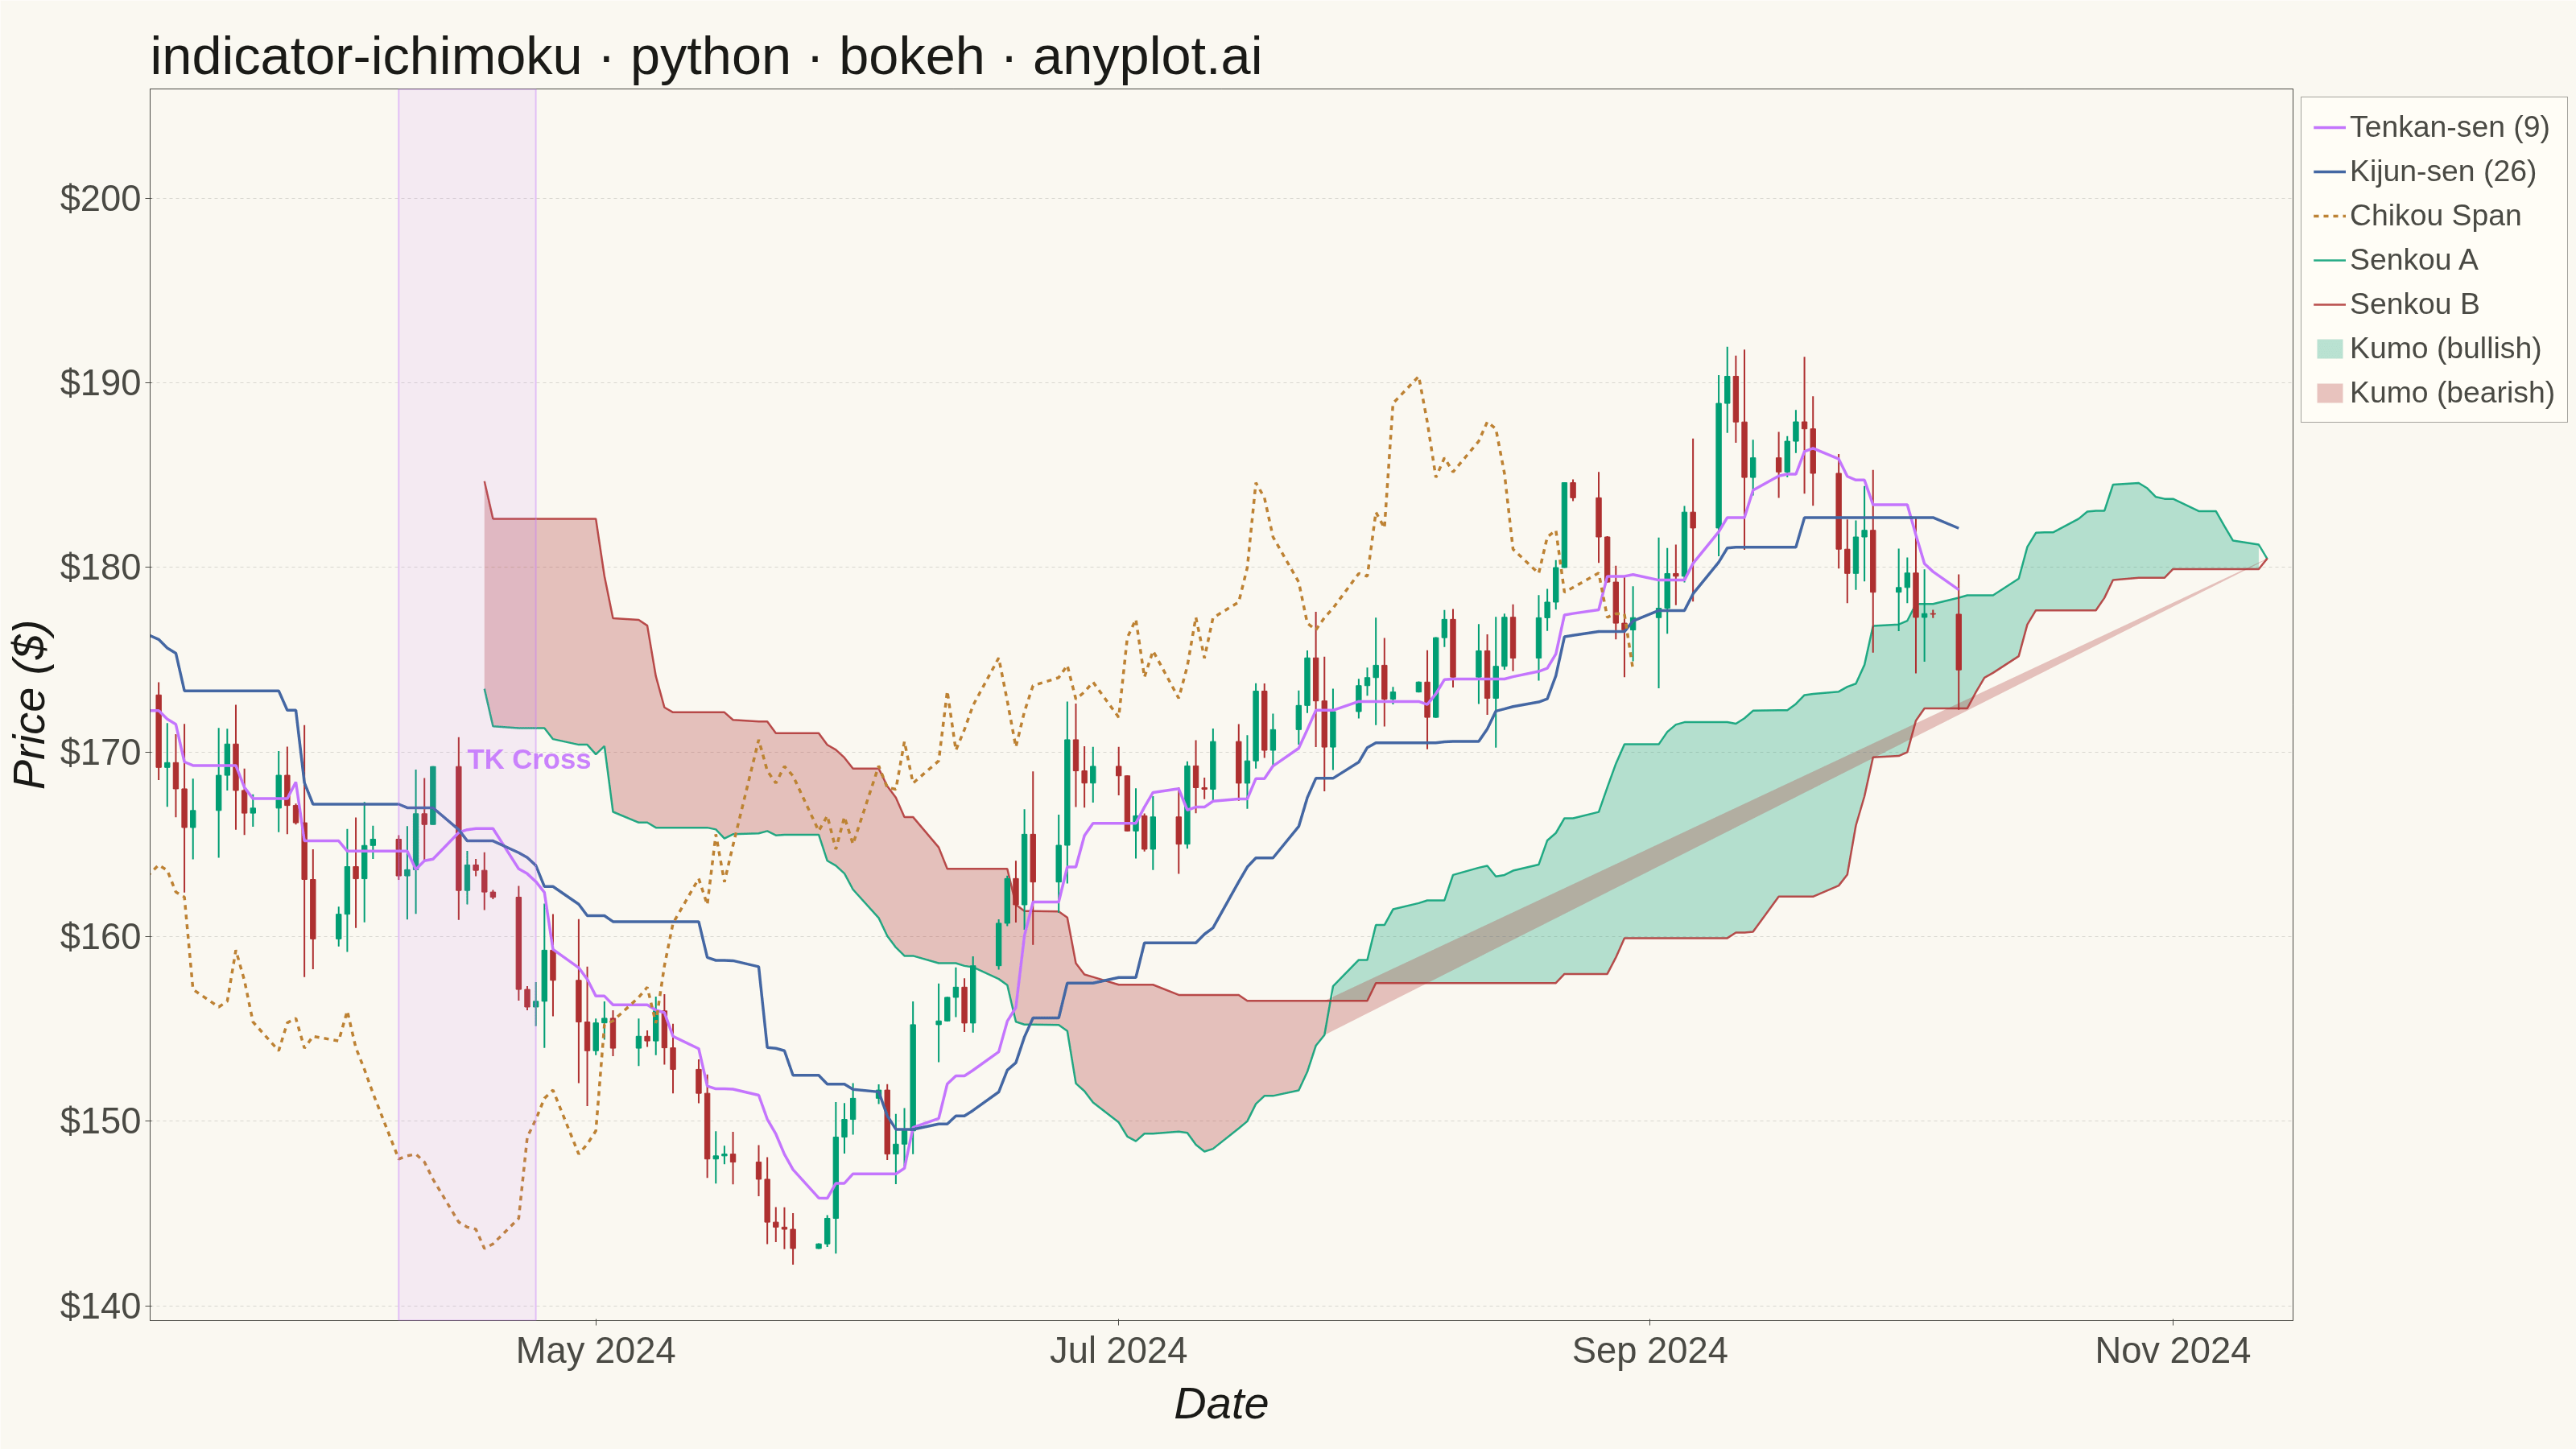
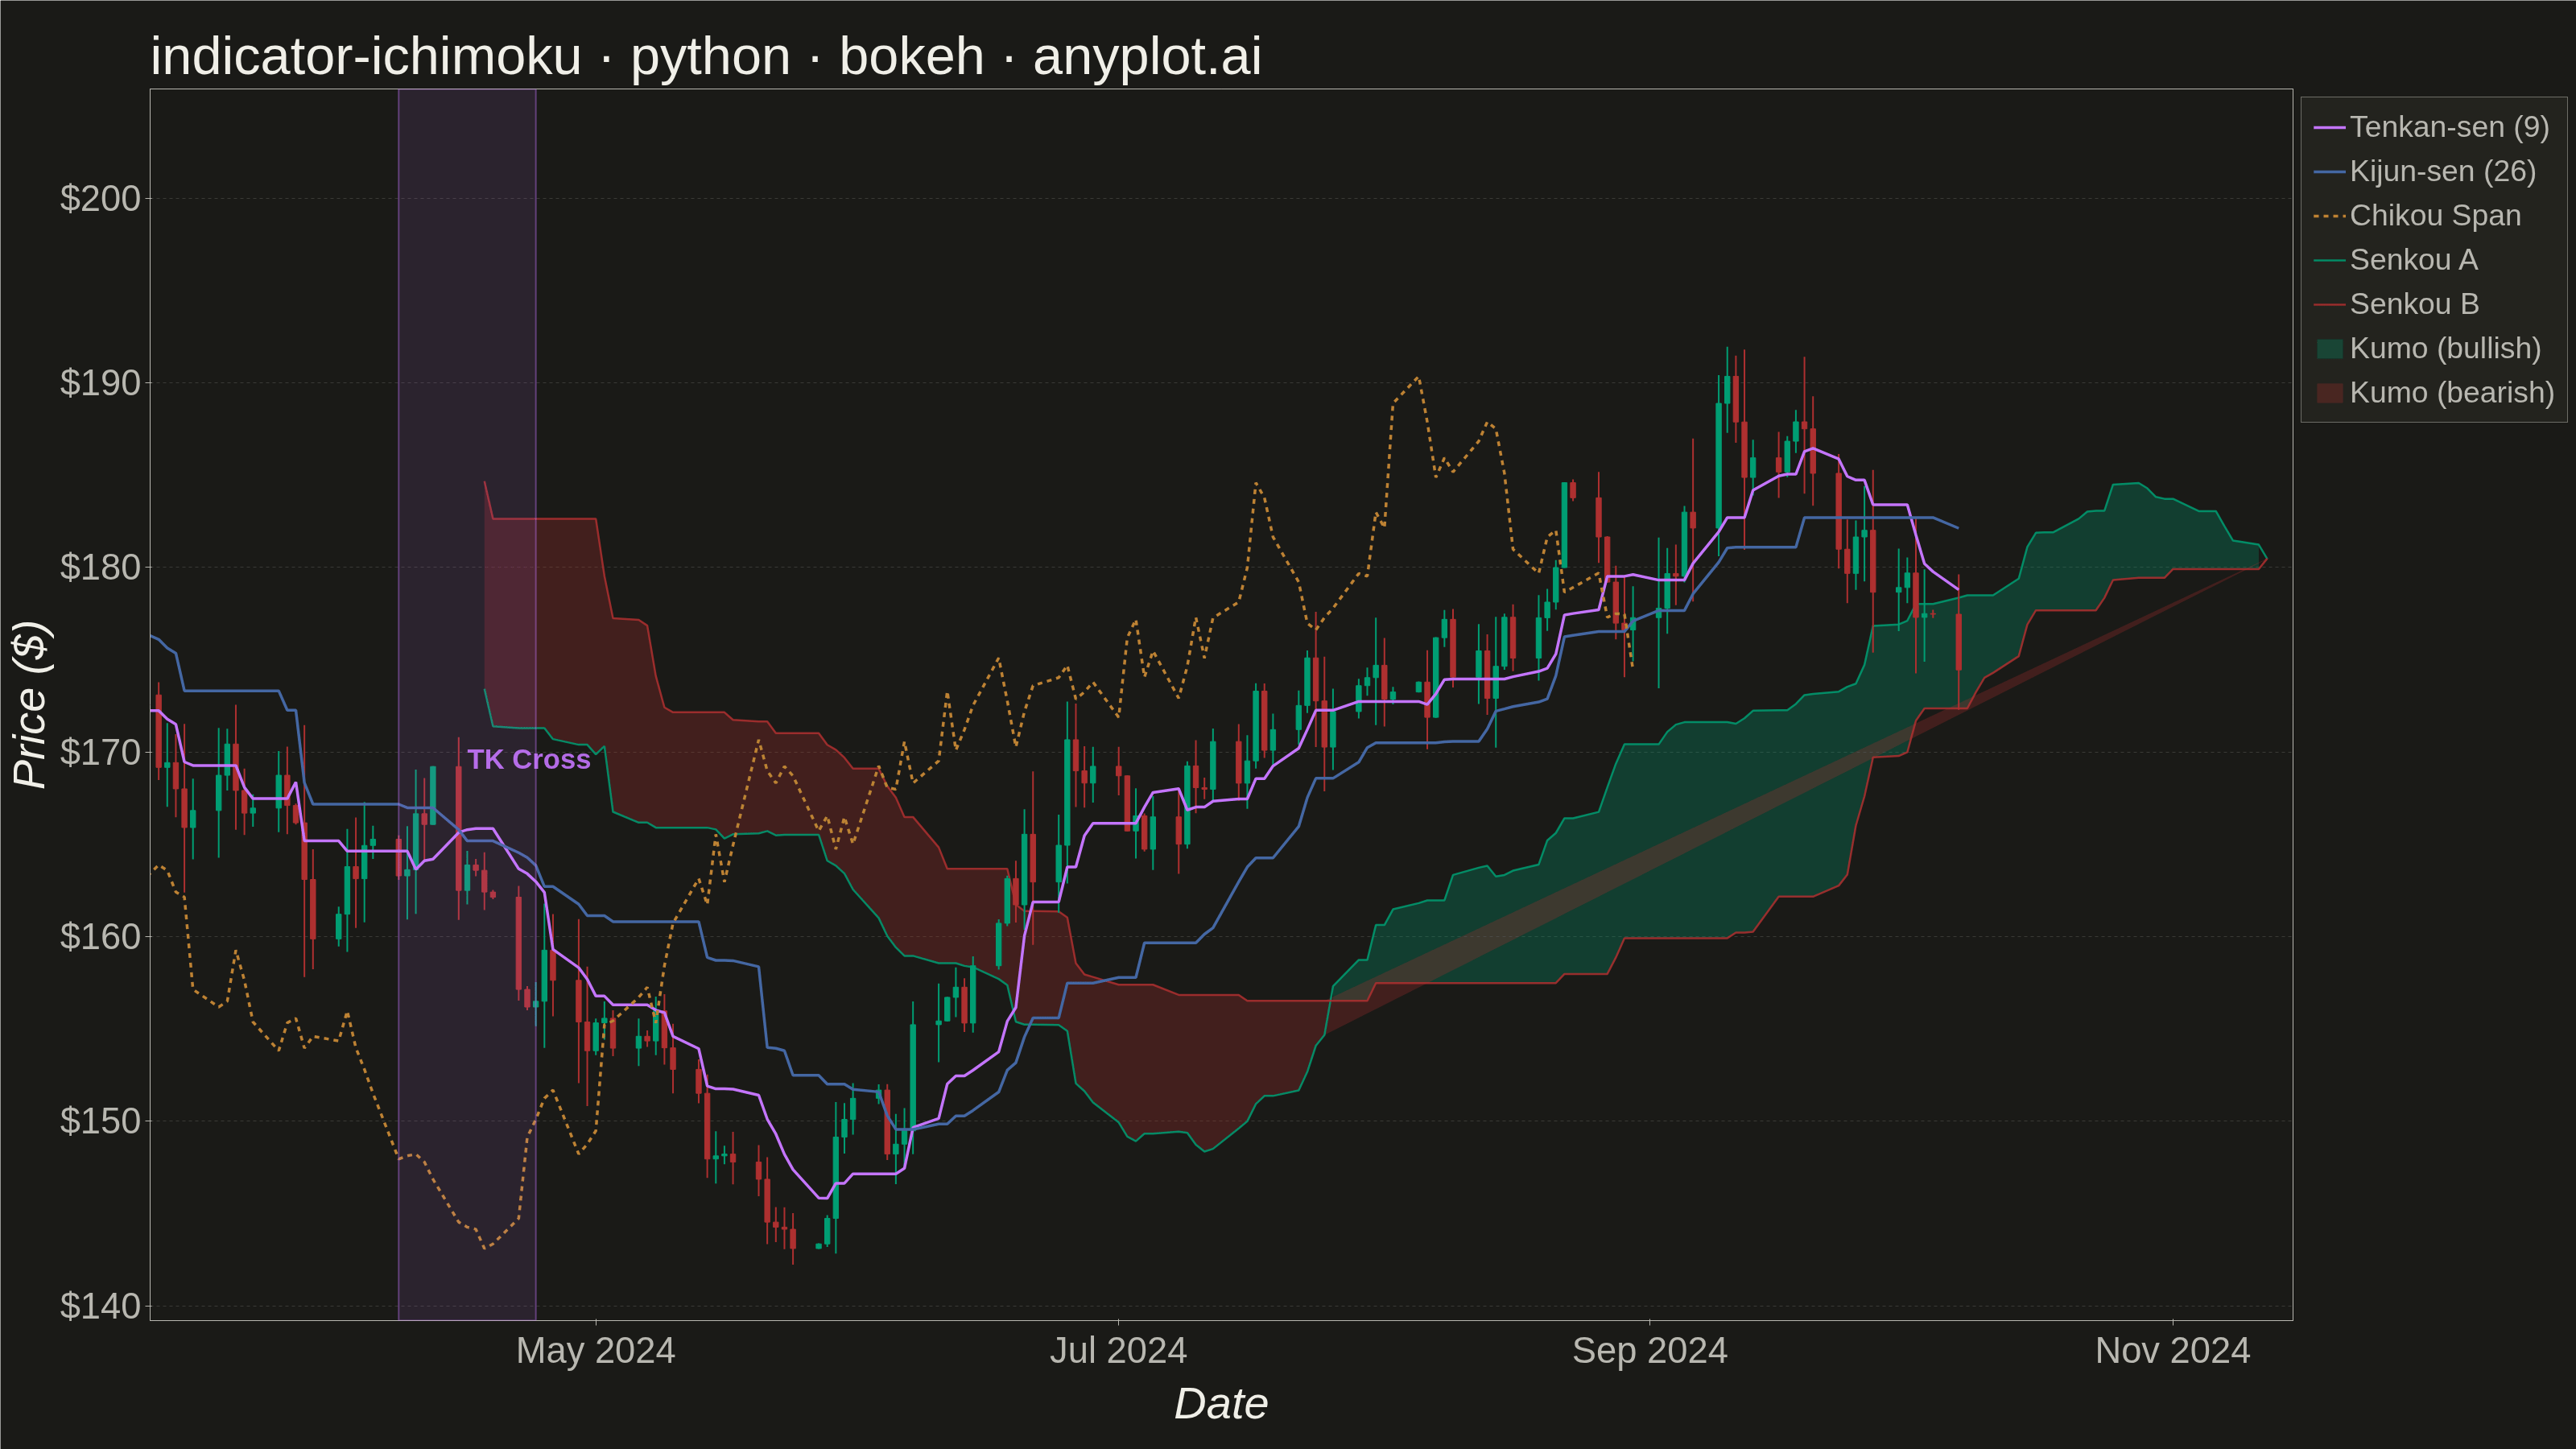
Displays the Ichimoku Kinko Hyo ("one glance equilibrium chart") overlay on a candlestick price chart. The indicator plots five lines — Tenkan-sen (conversion), Kijun-sen (base), Senkou Span A, Senkou Span B, and Chikou Span (lagging) — with the area between Senkou Span A and B filled as the "Kumo" (cloud). The cloud color changes depending on which span is on top, providing an at-a-glance view of trend direction, momentum, and support/resistance zones.
""" anyplot.ai
indicator-ichimoku: Ichimoku Cloud Technical Indicator Chart
Library: bokeh 3.9.1 | Python 3.13.13
Quality: 93/100 | Updated: 2026-06-08
"""

import os
import sys
import time
from pathlib import Path


# Prevent this script (bokeh.py) from shadowing the installed bokeh package when
# Python adds its own directory to sys.path[0] on direct invocation.
sys.path = [p for p in sys.path if os.path.abspath(p or os.getcwd()) != os.path.dirname(os.path.abspath(__file__))]

import numpy as np
import pandas as pd
from bokeh.io import output_file, save
from bokeh.models import BoxAnnotation, ColumnDataSource, HoverTool, Label, Legend, NumeralTickFormatter, Range1d
from bokeh.plotting import figure
from selenium import webdriver
from selenium.webdriver.chrome.options import Options


# Theme tokens — Imprint palette
THEME = os.getenv("ANYPLOT_THEME", "light")
PAGE_BG = "#FAF8F1" if THEME == "light" else "#1A1A17"
ELEVATED_BG = "#FFFDF6" if THEME == "light" else "#242420"
INK = "#1A1A17" if THEME == "light" else "#F0EFE8"
INK_SOFT = "#4A4A44" if THEME == "light" else "#B8B7B0"
INK_MUTED = "#6B6A63" if THEME == "light" else "#A8A79F"

# Imprint palette — semantic assignments for Ichimoku components
COLOR_BULL_CANDLE = "#009E73"  # Imprint green — bullish (up) candles
COLOR_BEAR_CANDLE = "#AE3030"  # Imprint matte red — bearish (down) candles
COLOR_TENKAN = "#C475FD"  # Imprint lavender — Tenkan-sen (9-period)
COLOR_KIJUN = "#4467A3"  # Imprint blue — Kijun-sen (26-period)
COLOR_CHIKOU = "#BD8233"  # Imprint ochre — Chikou Span (lagging)
COLOR_CLOUD_BULL = "#009E73"  # Imprint green — bullish cloud (Span A >= Span B)
COLOR_CLOUD_BEAR = "#AE3030"  # Imprint matte red — bearish cloud (Span B > Span A)

# Data — 200 trading days of OHLC with trending phases for Ichimoku analysis
np.random.seed(42)
n_days = 200
start_price = 180.0
dates = pd.date_range(start="2024-01-02", periods=n_days, freq="B")

returns = np.random.randn(n_days) * 0.014
returns[:50] += 0.002
returns[50:100] -= 0.003
returns[100:150] += 0.004
returns[150:] -= 0.001
prices = start_price * np.cumprod(1 + returns)

open_prices = np.empty(n_days)
high_prices = np.empty(n_days)
low_prices = np.empty(n_days)
close_prices = prices.copy()

open_prices[0] = start_price
for i in range(1, n_days):
    open_prices[i] = close_prices[i - 1]

for i in range(n_days):
    daily_range = abs(np.random.randn()) * 0.01 * close_prices[i]
    high_prices[i] = max(open_prices[i], close_prices[i]) + daily_range
    low_prices[i] = min(open_prices[i], close_prices[i]) - daily_range

# Ichimoku components using standard parameters (9, 26, 52)
ohlc_df = pd.DataFrame({"high": high_prices, "low": low_prices, "close": close_prices})

tenkan_sen = ((ohlc_df["high"].rolling(9).max() + ohlc_df["low"].rolling(9).min()) / 2).values
kijun_sen = ((ohlc_df["high"].rolling(26).max() + ohlc_df["low"].rolling(26).min()) / 2).values

senkou_a_unshifted = (tenkan_sen + kijun_sen) / 2
senkou_b_unshifted = ((ohlc_df["high"].rolling(52).max() + ohlc_df["low"].rolling(52).min()) / 2).values

# Senkou Spans shifted 26 periods into the future
future_dates = pd.date_range(start=dates[-1] + pd.tseries.offsets.BDay(1), periods=26, freq="B")
all_dates = dates.union(future_dates)

senkou_span_a = np.full(n_days + 26, np.nan)
senkou_span_b = np.full(n_days + 26, np.nan)
senkou_span_a[26 : n_days + 26] = senkou_a_unshifted
senkou_span_b[26 : n_days + 26] = senkou_b_unshifted

# Chikou Span: close shifted 26 periods into the past
chikou_span = np.full(n_days, np.nan)
chikou_span[: n_days - 26] = close_prices[26:]

df = pd.DataFrame(
    {
        "date": dates,
        "open": open_prices,
        "high": high_prices,
        "low": low_prices,
        "close": close_prices,
        "tenkan": tenkan_sen,
        "kijun": kijun_sen,
        "chikou": chikou_span,
    }
)
df["bullish"] = df["close"] >= df["open"]
df["date_str"] = df["date"].dt.strftime("%b %d, %Y")

cloud_df = pd.DataFrame({"date": all_dates, "span_a": senkou_span_a, "span_b": senkou_span_b})
cloud_df = cloud_df.dropna().reset_index(drop=True)
cloud_df["bullish_cloud"] = cloud_df["span_a"] >= cloud_df["span_b"]

bullish_df = df[df["bullish"]].copy()
bearish_df = df[~df["bullish"]].copy()
source_bull = ColumnDataSource(bullish_df)
source_bear = ColumnDataSource(bearish_df)

# Figure — 3200×1800, toolbar off for PNG, min_border reserves room for large labels
p = figure(
    width=3200,
    height=1800,
    x_axis_type="datetime",
    title="indicator-ichimoku · python · bokeh · anyplot.ai",
    x_axis_label="Date",
    y_axis_label="Price ($)",
    toolbar_location=None,
    min_border_bottom=160,
    min_border_left=180,
    min_border_top=110,
    min_border_right=50,
)

x_pad = pd.Timedelta(days=3)
p.x_range = Range1d(start=dates[51] - x_pad, end=all_dates[-1] + x_pad)

# Kumo (cloud) — filled area between Senkou Span A and B, alpha raised for thin regions
bull_cloud = cloud_df[cloud_df["bullish_cloud"]].copy()
bear_cloud = cloud_df[~cloud_df["bullish_cloud"]].copy()

if len(bull_cloud) > 0:
    r_cloud_bull = p.varea(
        x="date",
        y1="span_a",
        y2="span_b",
        source=ColumnDataSource(bull_cloud),
        fill_color=COLOR_CLOUD_BULL,
        fill_alpha=0.28,
    )

if len(bear_cloud) > 0:
    r_cloud_bear = p.varea(
        x="date",
        y1="span_a",
        y2="span_b",
        source=ColumnDataSource(bear_cloud),
        fill_color=COLOR_CLOUD_BEAR,
        fill_alpha=0.28,
    )

# Cloud boundary lines
r_span_a = p.line(
    x="date",
    y="value",
    source=ColumnDataSource(cloud_df[["date", "span_a"]].rename(columns={"span_a": "value"})),
    line_color=COLOR_CLOUD_BULL,
    line_width=2.5,
    line_alpha=0.85,
)
r_span_b = p.line(
    x="date",
    y="value",
    source=ColumnDataSource(cloud_df[["date", "span_b"]].rename(columns={"span_b": "value"})),
    line_color=COLOR_CLOUD_BEAR,
    line_width=2.5,
    line_alpha=0.85,
)

# Candlestick wicks and bodies
candle_width = 0.6 * 24 * 60 * 60 * 1000
p.segment(x0="date", y0="high", x1="date", y1="low", source=source_bull, color=COLOR_BULL_CANDLE, line_width=2)
p.segment(x0="date", y0="high", x1="date", y1="low", source=source_bear, color=COLOR_BEAR_CANDLE, line_width=2)

bull_bars = p.vbar(
    x="date",
    top="close",
    bottom="open",
    width=candle_width,
    source=source_bull,
    fill_color=COLOR_BULL_CANDLE,
    line_color=COLOR_BULL_CANDLE,
)
bear_bars = p.vbar(
    x="date",
    top="open",
    bottom="close",
    width=candle_width,
    source=source_bear,
    fill_color=COLOR_BEAR_CANDLE,
    line_color=COLOR_BEAR_CANDLE,
)

# Ichimoku lines — Tenkan and Kijun with strong visual weight
line_df = df.dropna(subset=["tenkan", "kijun"]).copy()
line_source = ColumnDataSource(line_df)

r_tenkan = p.line(x="date", y="tenkan", source=line_source, line_color=COLOR_TENKAN, line_width=3.5)
r_kijun = p.line(x="date", y="kijun", source=line_source, line_color=COLOR_KIJUN, line_width=3.5)

# Chikou Span — wider line improves visibility in dense candlestick areas
chikou_df = df.dropna(subset=["chikou"]).copy()
r_chikou = p.line(
    x="date",
    y="chikou",
    source=ColumnDataSource(chikou_df),
    line_color=COLOR_CHIKOU,
    line_width=3.5,
    line_dash="dashed",
)

# TK Cross BoxAnnotation — highlights first bullish Tenkan/Kijun crossover
valid = line_df.dropna(subset=["tenkan", "kijun"]).copy()
valid["tk_diff"] = valid["tenkan"] - valid["kijun"]
valid["cross"] = np.sign(valid["tk_diff"]).diff()
bullish_crosses = valid[valid["cross"] == 2.0]

if len(bullish_crosses) > 0:
    cross_idx = bullish_crosses.index[0]
    cross_date = valid.loc[cross_idx, "date"]
    cross_price = valid.loc[cross_idx, "tenkan"]
    p.add_layout(
        BoxAnnotation(
            left=cross_date - pd.Timedelta(days=8),
            right=cross_date + pd.Timedelta(days=8),
            fill_alpha=0.10,
            fill_color=COLOR_TENKAN,
            line_color=COLOR_TENKAN,
            line_alpha=0.4,
            line_width=2,
        )
    )
    p.add_layout(
        Label(
            x=cross_date,
            y=cross_price + 3,
            text="TK Cross",
            text_font_size="26pt",
            text_color=COLOR_TENKAN,
            text_font_style="bold",
            text_alpha=0.9,
        )
    )

# Legend — theme-adaptive, placed in right panel
legend_items = [
    ("Tenkan-sen (9)", [r_tenkan]),
    ("Kijun-sen (26)", [r_kijun]),
    ("Chikou Span", [r_chikou]),
    ("Senkou A", [r_span_a]),
    ("Senkou B", [r_span_b]),
    ("Kumo (bullish)", [r_cloud_bull]),
    ("Kumo (bearish)", [r_cloud_bear]),
]
legend = Legend(items=legend_items, location="top_left")
legend.label_text_font_size = "28pt"
legend.label_text_color = INK_SOFT
legend.glyph_height = 30
legend.glyph_width = 40
legend.spacing = 12
legend.padding = 15
legend.background_fill_color = ELEVATED_BG
legend.background_fill_alpha = 0.92
legend.border_line_color = INK_SOFT
legend.border_line_width = 1
p.add_layout(legend, "right")

# Hover tooltip for candlesticks
p.add_tools(
    HoverTool(
        renderers=[bull_bars, bear_bars],
        tooltips="""
        <div style="font-size:16px; padding:8px;">
            <strong>@date_str</strong><br/>
            Open: @open{$0.00}<br/>
            High: @high{$0.00}<br/>
            Low: @low{$0.00}<br/>
            Close: @close{$0.00}
        </div>
        """,
        mode="vline",
    )
)

# Text sizing for 3200×1800
p.title.text_font_size = "50pt"
p.title.text_font_style = "normal"
p.title.text_color = INK
p.xaxis.axis_label_text_font_size = "42pt"
p.yaxis.axis_label_text_font_size = "42pt"
p.xaxis.axis_label_text_color = INK
p.yaxis.axis_label_text_color = INK
p.xaxis.major_label_text_font_size = "34pt"
p.yaxis.major_label_text_font_size = "34pt"
p.xaxis.major_label_text_color = INK_SOFT
p.yaxis.major_label_text_color = INK_SOFT

p.yaxis.formatter = NumeralTickFormatter(format="$0")

# Grid — y-axis only, subtle dashed lines
p.xgrid.grid_line_color = None
p.ygrid.grid_line_color = INK
p.ygrid.grid_line_alpha = 0.15
p.ygrid.grid_line_width = 1
p.ygrid.grid_line_dash = [4, 4]

# Axis chrome — theme-adaptive
p.outline_line_color = INK_SOFT
p.xaxis.axis_line_color = INK_SOFT
p.yaxis.axis_line_color = INK_SOFT
p.xaxis.axis_line_width = 1
p.yaxis.axis_line_width = 1
p.xaxis.minor_tick_line_color = None
p.yaxis.minor_tick_line_color = None
p.xaxis.major_tick_line_color = INK_SOFT
p.yaxis.major_tick_line_color = INK_SOFT

p.background_fill_color = PAGE_BG
p.border_fill_color = PAGE_BG

# Save HTML (interactive artifact)
output_file(f"plot-{THEME}.html")
save(p)

# Screenshot with Selenium — avoids export_png chromedriver snap issues
W, H = 3200, 1800
opts = Options()
for arg in (
    "--headless=new",
    "--no-sandbox",
    "--disable-dev-shm-usage",
    "--disable-gpu",
    f"--window-size={W},{H}",
    "--hide-scrollbars",
):
    opts.add_argument(arg)
driver = webdriver.Chrome(options=opts)
driver.set_window_size(W, H)

# Chrome headless has ~139 px of browser chrome overhead; resize so the
# viewport (window.innerHeight) is exactly H, not H minus that overhead.
vh = driver.execute_script("return window.innerHeight")
if vh != H:
    driver.set_window_size(W, H + (H - vh))

driver.get(f"file://{Path(f'plot-{THEME}.html').resolve()}")
time.sleep(3)
driver.save_screenshot(f"plot-{THEME}.png")
driver.quit()
Runnable source as JSON, for any HTTP client: https://api.anyplot.ai/specs/indicator-ichimoku/bokeh/code. Any spec id and library id listed in llms-full.txt fit the same URL shape; every URL below is complete and callable.
{
  "spec_id": "indicator-ichimoku",
  "language": "python",
  "library": "bokeh",
  "page": "https://anyplot.ai/indicator-ichimoku/python/bokeh",
  "hub": "https://anyplot.ai/indicator-ichimoku",
  "code_json": "https://api.anyplot.ai/specs/indicator-ichimoku/bokeh/code",
  "spec_json": "https://api.anyplot.ai/specs/indicator-ichimoku",
  "render_light_png": "https://storage.googleapis.com/anyplot-images/plots/indicator-ichimoku/python/bokeh/plot-light.png",
  "render_dark_png": "https://storage.googleapis.com/anyplot-images/plots/indicator-ichimoku/python/bokeh/plot-dark.png",
  "interactive_light_html": "https://storage.googleapis.com/anyplot-images/plots/indicator-ichimoku/python/bokeh/plot-light.html",
  "interactive_dark_html": "https://storage.googleapis.com/anyplot-images/plots/indicator-ichimoku/python/bokeh/plot-dark.html",
  "quality_score": 93.0,
  "license": "MIT",
  "guide": "https://anyplot.ai/llms.txt"
}
Part of Ichimoku Cloud Technical Indicator Chart on anyplot.ai.