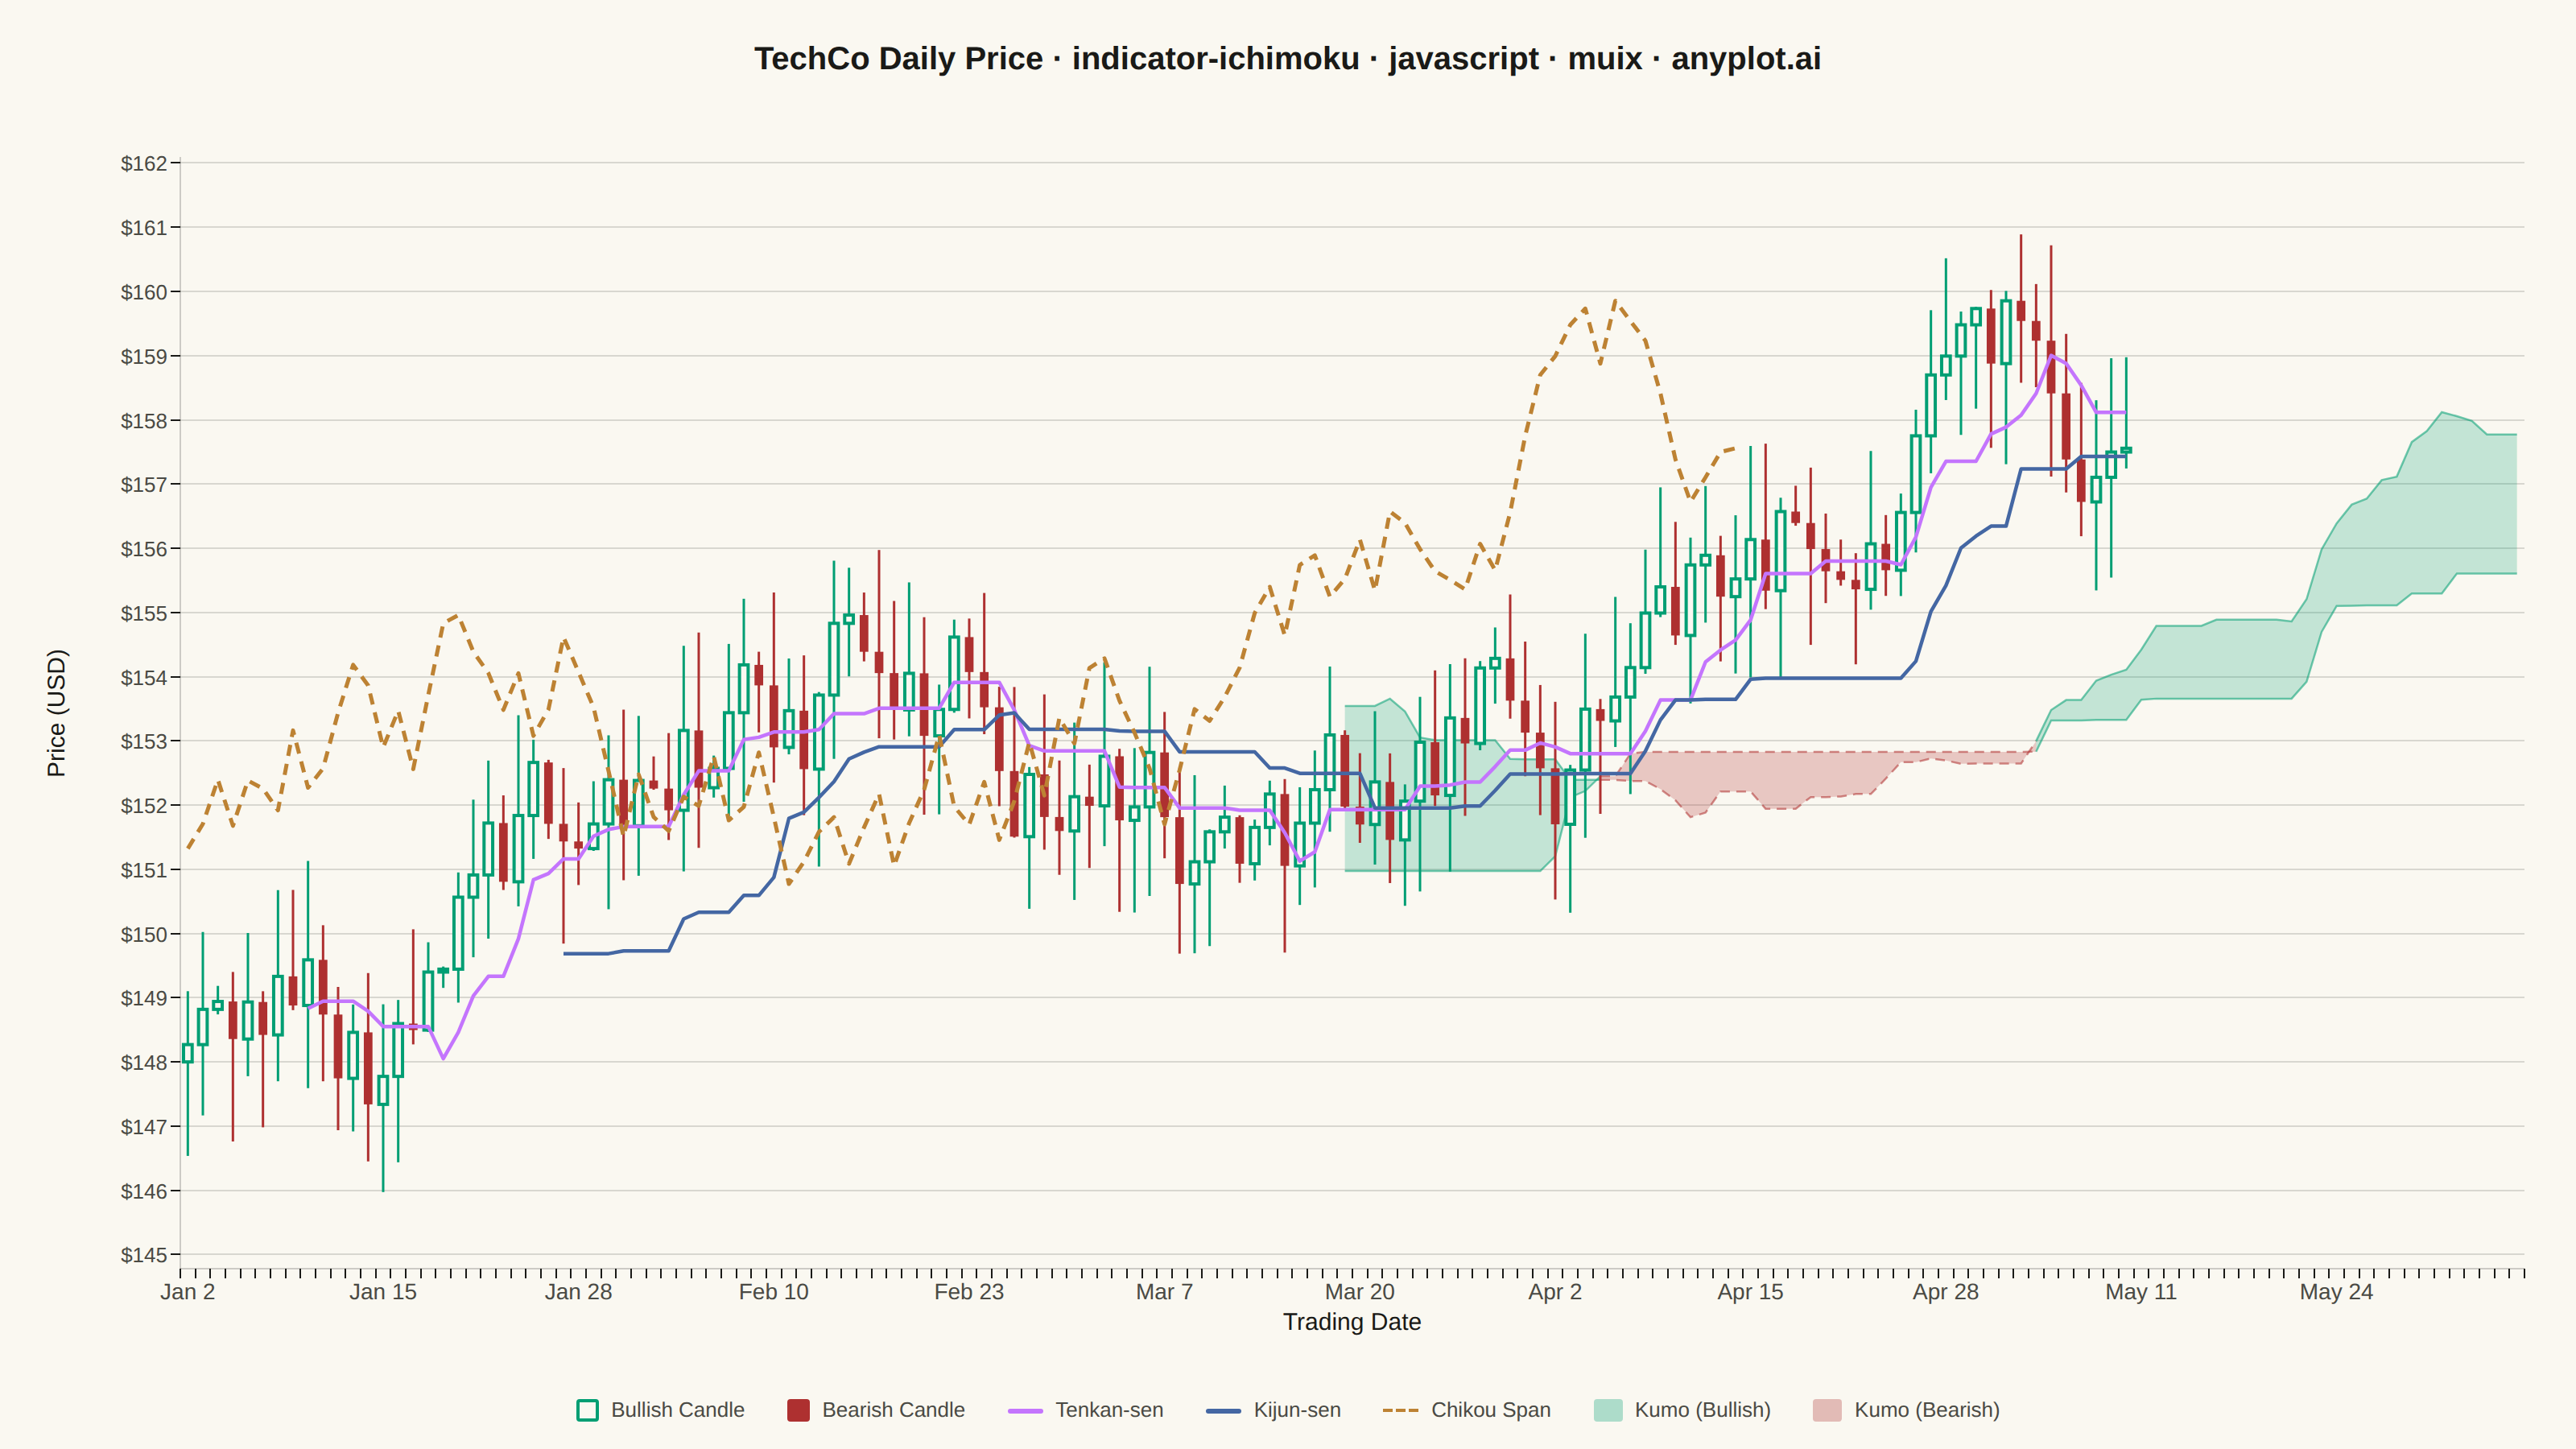
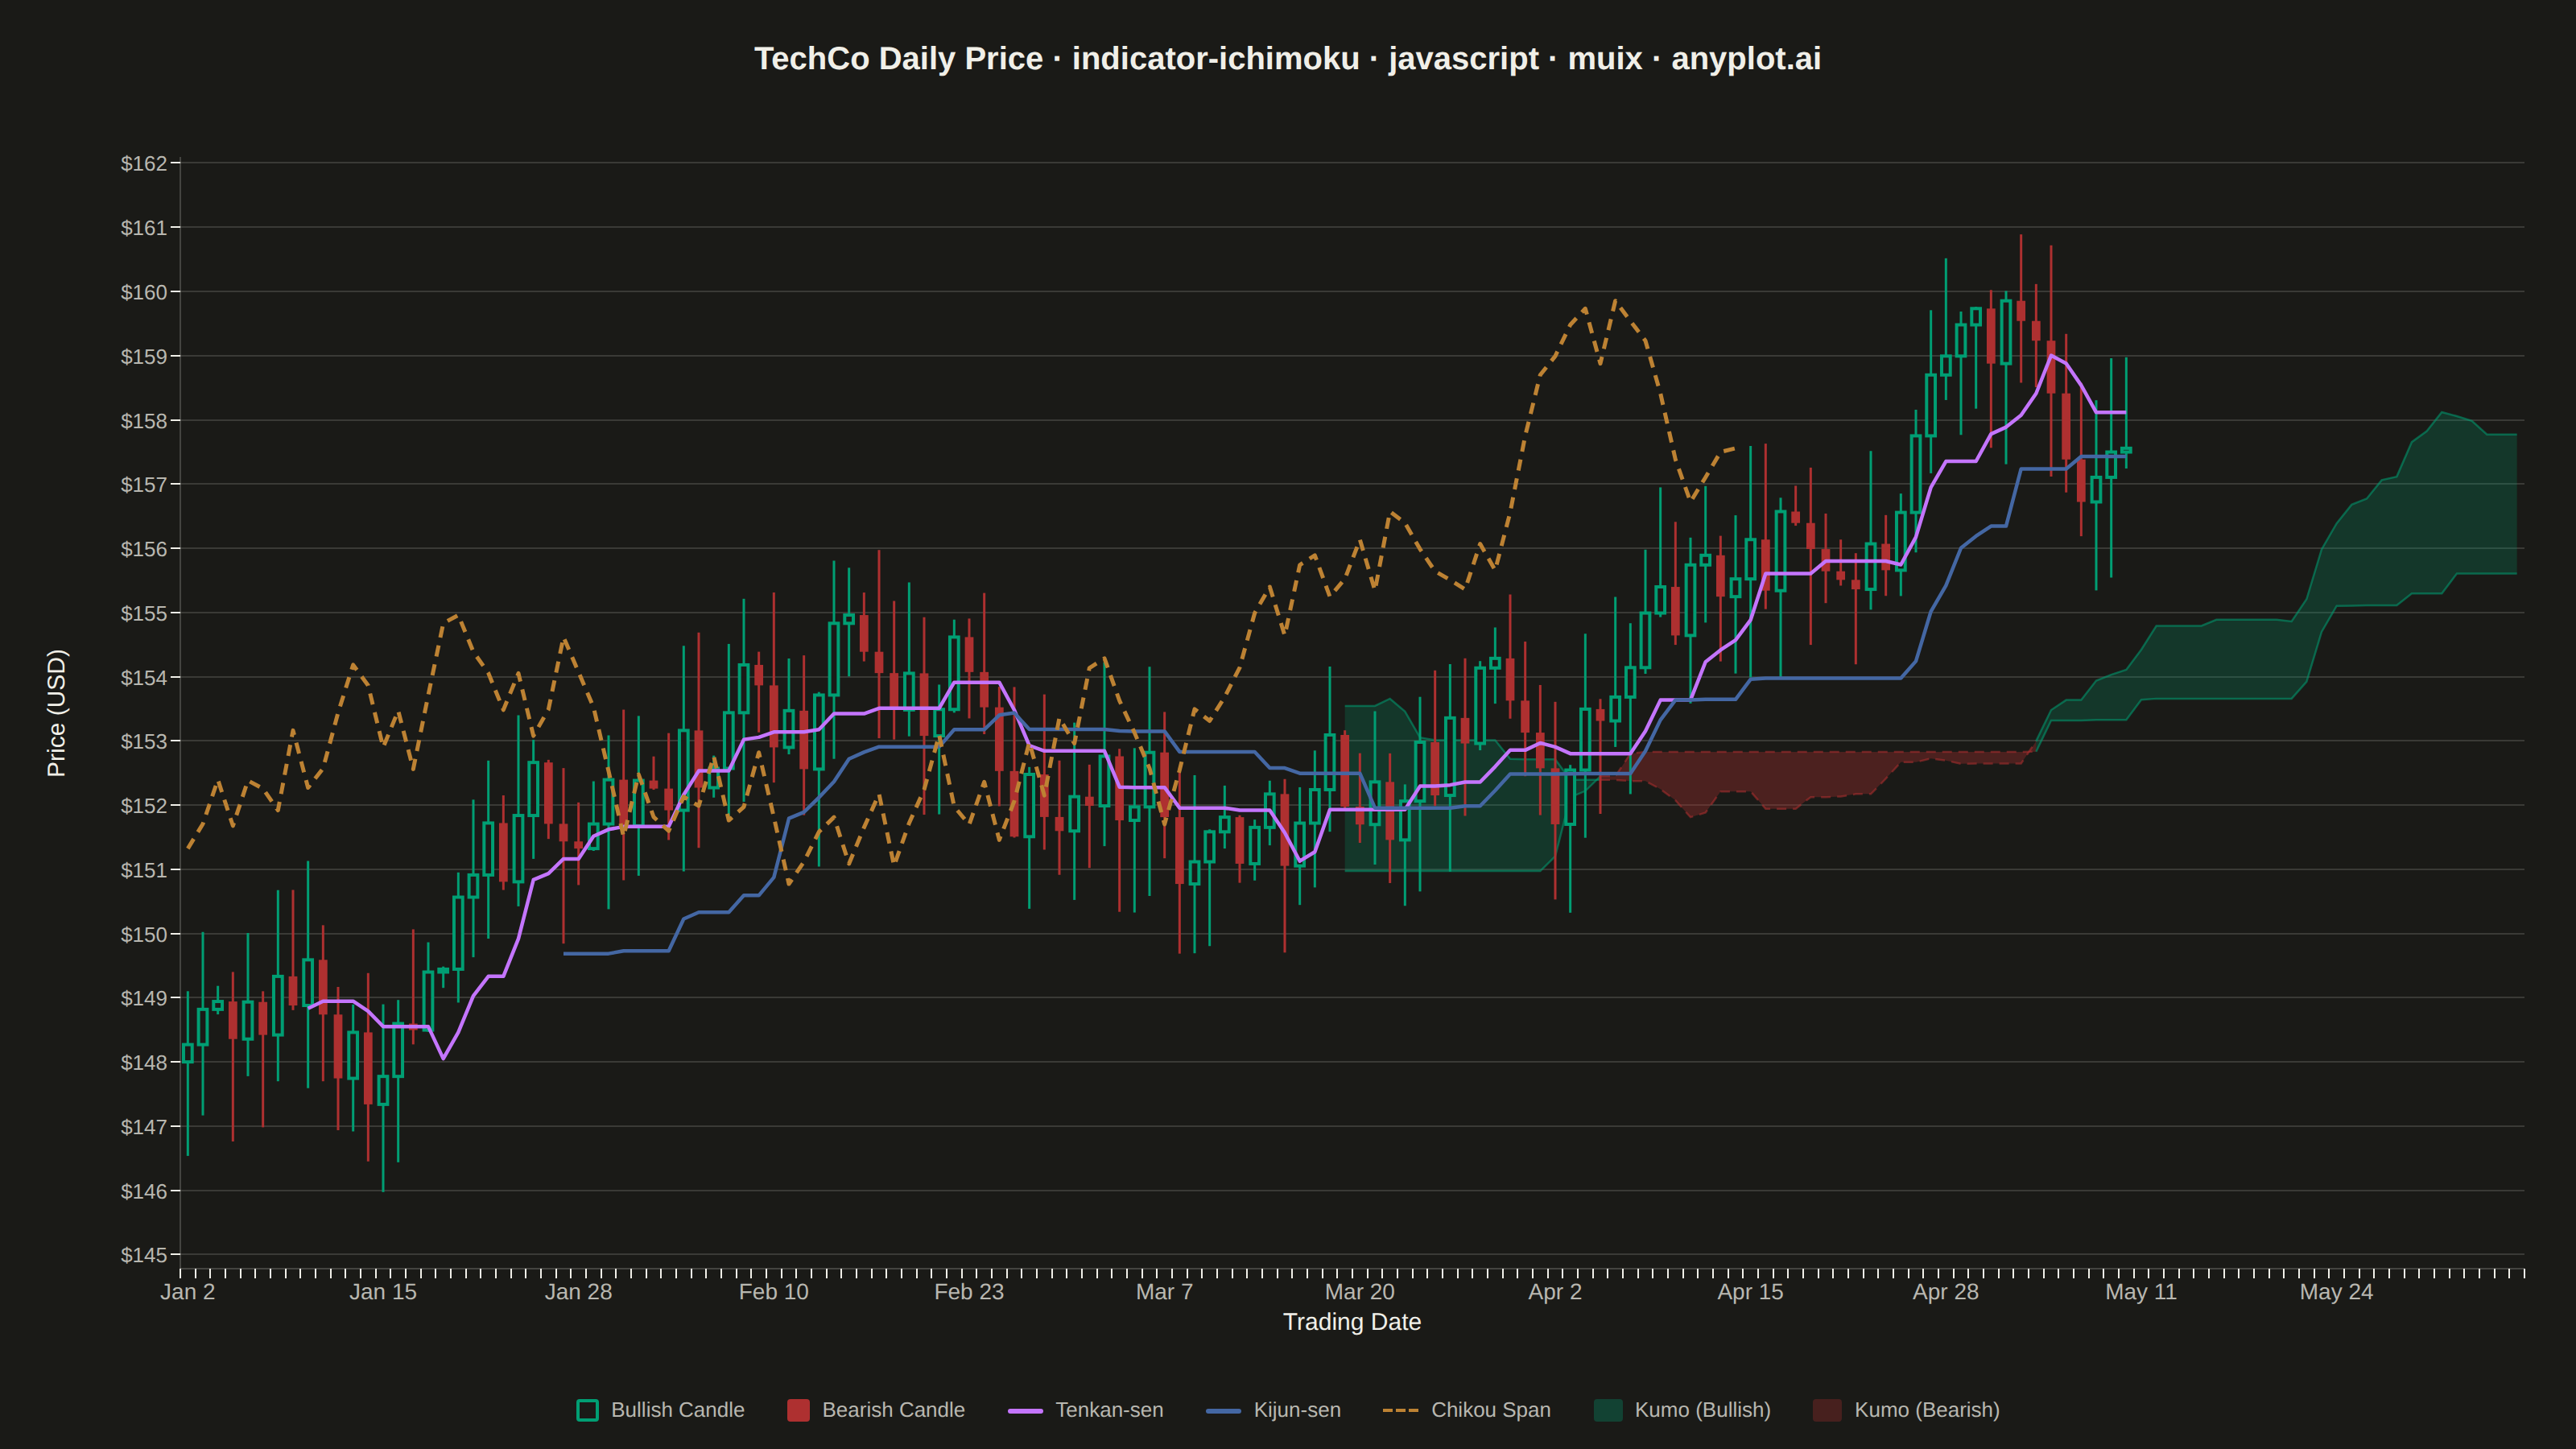
The same plot in 14 other libraries — JavaScript: Chart.js, D3.js, Apache ECharts, Highcharts; Python: Altair, Bokeh, lets-plot, Matplotlib, Plotly, plotnine, Pygal, Seaborn; R: ggplot2; Julia: Makie.jl. Compare all 15 side by side: Ichimoku Cloud Technical Indicator Chart in Python, R, Julia and JavaScript.
Displays the Ichimoku Kinko Hyo ("one glance equilibrium chart") overlay on a candlestick price chart. The indicator plots five lines — Tenkan-sen (conversion), Kijun-sen (base), Senkou Span A, Senkou Span B, and Chikou Span (lagging) — with the area between Senkou Span A and B filled as the "Kumo" (cloud). The cloud color changes depending on which span is on top, providing an at-a-glance view of trend direction, momentum, and support/resistance zones.
// anyplot.ai
// indicator-ichimoku: Ichimoku Cloud Technical Indicator Chart
// Library: muix 7.29.1 | JavaScript 22.23.2
// Quality: 92/100 | Created: 2026-08-20
//# anyplot-orientation: landscape
// anyplot.ai
// indicator-ichimoku: Ichimoku Cloud Technical Indicator Chart
// Library: MUI X Charts | React | Node 22
// License: @mui/x-charts — MIT (community). Pro/Premium are out of scope.
// Quality: pending | Created: 2026-08-20

import { ChartContainer } from "@mui/x-charts/ChartContainer";
import { LinePlot } from "@mui/x-charts/LineChart";
import { ChartsXAxis } from "@mui/x-charts/ChartsXAxis";
import { ChartsYAxis } from "@mui/x-charts/ChartsYAxis";
import { ChartsGrid } from "@mui/x-charts/ChartsGrid";
import { useXScale, useYScale } from "@mui/x-charts/hooks";
import Box from "@mui/material/Box";
import Typography from "@mui/material/Typography";

const t = window.ANYPLOT_TOKENS;

// --- Data (in-memory, deterministic LCG PRNG — no fetch, no Math.random) ----
let seed = 42;
function rand() {
  seed = (seed * 1103515245 + 12345) & 0x7fffffff;
  return seed / 0x7fffffff;
}

const HISTORY = 130; // trading periods with OHLC data
const FORWARD = 26; // Senkou spans project this many periods ahead of price data
const TOTAL = HISTORY + FORWARD;

const open: number[] = [];
const high: number[] = [];
const low: number[] = [];
const close: number[] = [];
let price = 148;
for (let i = 0; i < HISTORY; i++) {
  const o = price;
  const drift = (rand() - 0.47) * 2.4;
  const c = Math.max(40, o + drift);
  const h = Math.max(o, c) + rand() * 1.6;
  const l = Math.max(Math.min(o, c) - rand() * 1.6, 1);
  open.push(o);
  close.push(c);
  high.push(h);
  low.push(l);
  price = c;
}

// Standard Ichimoku parameters: 9 / 26 / 52
function rollingMid(period: number, i: number) {
  if (i < period - 1) return null;
  let hh = -Infinity;
  let ll = Infinity;
  for (let k = i - period + 1; k <= i; k++) {
    hh = Math.max(hh, high[k]);
    ll = Math.min(ll, low[k]);
  }
  return (hh + ll) / 2;
}

const tenkanRaw = open.map((_, i) => rollingMid(9, i));
const kijunRaw = open.map((_, i) => rollingMid(26, i));
const spanARaw = open.map((_, i) =>
  tenkanRaw[i] != null && kijunRaw[i] != null ? (tenkanRaw[i]! + kijunRaw[i]!) / 2 : null,
);
const spanBRaw = open.map((_, i) => rollingMid(52, i));

// Fixed calendar anchor (deterministic — not the render-time clock)
const START = new Date(2024, 0, 2);
const dateLabels: string[] = [];
for (let i = 0; i < TOTAL; i++) {
  const d = new Date(START);
  d.setDate(d.getDate() + i);
  dateLabels.push(d.toLocaleDateString("en-US", { month: "short", day: "numeric" }));
}

// Full-width arrays (length TOTAL) so candles, indicator lines and the
// forward-shifted / backward-shifted spans all share the same x categories
const openArr = new Array(TOTAL).fill(null) as (number | null)[];
const highArr = new Array(TOTAL).fill(null) as (number | null)[];
const lowArr = new Array(TOTAL).fill(null) as (number | null)[];
const closeArr = new Array(TOTAL).fill(null) as (number | null)[];
const tenkanArr = new Array(TOTAL).fill(null) as (number | null)[];
const kijunArr = new Array(TOTAL).fill(null) as (number | null)[];
const spanAArr = new Array(TOTAL).fill(null) as (number | null)[];
const spanBArr = new Array(TOTAL).fill(null) as (number | null)[];
const chikouArr = new Array(TOTAL).fill(null) as (number | null)[];

for (let i = 0; i < HISTORY; i++) {
  openArr[i] = open[i];
  highArr[i] = high[i];
  lowArr[i] = low[i];
  closeArr[i] = close[i];
  tenkanArr[i] = tenkanRaw[i];
  kijunArr[i] = kijunRaw[i];
  if (spanARaw[i] != null && i + FORWARD < TOTAL) spanAArr[i + FORWARD] = spanARaw[i];
  if (spanBRaw[i] != null && i + FORWARD < TOTAL) spanBArr[i + FORWARD] = spanBRaw[i];
  if (i >= FORWARD) chikouArr[i - FORWARD] = close[i];
}

const definedValues = [
  ...highArr,
  ...lowArr,
  ...spanAArr,
  ...spanBArr,
  ...tenkanArr,
  ...kijunArr,
  ...chikouArr,
].filter((v): v is number => v != null);
const yMin = Math.min(...definedValues);
const yMax = Math.max(...definedValues);
const yPad = (yMax - yMin) * 0.08;

// --- Candlesticks: MUI X has no native candlestick — draw against the
// shared band scale via useXScale/useYScale, the documented ChartContainer
// composition pattern for chart types outside the community surface -------
// Bullish bodies are drawn HOLLOW (page-background fill, colored outline) and
// bearish bodies SOLID-filled — a fill/outline pattern cue redundant to hue,
// the classic candlestick convention, so trend direction survives CVD sims.
function Candlesticks() {
  const xScale = useXScale("x") as any;
  const yScale = useYScale("y") as any;
  if (!xScale || !yScale) return null;
  const bw = xScale.bandwidth();
  const bodyWidth = bw * 0.72;

  return (
    <g>
      {openArr.slice(0, HISTORY).map((_, i) => {
        const cx = xScale(dateLabels[i]) + bw / 2;
        const bullish = closeArr[i]! >= openArr[i]!;
        const color = bullish ? t.palette[0] : t.palette[4];
        const yO = yScale(openArr[i]!);
        const yC = yScale(closeArr[i]!);
        const bodyTop = Math.min(yO, yC);
        const bodyHeight = Math.max(Math.abs(yC - yO), 1.5);
        return (
          <g key={i}>
            <line
              x1={cx}
              x2={cx}
              y1={yScale(highArr[i]!)}
              y2={yScale(lowArr[i]!)}
              stroke={color}
              strokeWidth={1.5}
            />
            <rect
              x={cx - bodyWidth / 2}
              y={bodyTop}
              width={bodyWidth}
              height={bodyHeight}
              fill={bullish ? t.pageBg : color}
              stroke={color}
              strokeWidth={bullish ? 2 : 0}
            />
          </g>
        );
      })}
    </g>
  );
}

// Kumo cloud: the filled area between Senkou Span A and B, split into
// bullish/bearish segments at every crossover (green when A > B, red when
// B > A — the spec's "at-a-glance" trend signal). Bearish borders are dashed
// (solid for bullish) as a pattern cue redundant to hue, and the bearish fill
// gets a theme-adaptive opacity bump so it reads as clearly on the near-black
// dark page as the bullish fill does — both cloud states equally legible.
function KumoCloud() {
  const xScale = useXScale("x") as any;
  const yScale = useYScale("y") as any;
  if (!xScale || !yScale) return null;
  const bw = xScale.bandwidth();
  const cx = (i: number) => xScale(dateLabels[i]) + bw / 2;
  const isDark = window.ANYPLOT_THEME === "dark";

  const segments: { idx: number[]; bullish: boolean }[] = [];
  let current: number[] = [];
  let bullish: boolean | null = null;
  for (let j = 0; j < TOTAL; j++) {
    const a = spanAArr[j];
    const b = spanBArr[j];
    if (a == null || b == null) {
      if (current.length > 1) segments.push({ idx: current, bullish: bullish! });
      current = [];
      bullish = null;
      continue;
    }
    const up = a >= b;
    if (bullish === null) {
      bullish = up;
      current = [j];
    } else if (up === bullish) {
      current.push(j);
    } else {
      current.push(j); // shared boundary point keeps segments seamless at the crossover
      segments.push({ idx: current, bullish });
      current = [j];
      bullish = up;
    }
  }
  if (current.length > 1) segments.push({ idx: current, bullish: bullish! });

  return (
    <g>
      {segments.map((seg, s) => {
        const color = seg.bullish ? t.palette[0] : t.palette[4];
        const fillOpacity = seg.bullish ? 0.22 : isDark ? 0.34 : 0.24;
        const dash = seg.bullish ? undefined : "6 4";
        const top = seg.idx.map((j) => `${cx(j)},${yScale(spanAArr[j]!)}`);
        const bottom = seg.idx
          .slice()
          .reverse()
          .map((j) => `${cx(j)},${yScale(spanBArr[j]!)}`);
        return (
          <g key={s}>
            <polygon points={[...top, ...bottom].join(" ")} fill={color} fillOpacity={fillOpacity} />
            <polyline
              points={top.join(" ")}
              fill="none"
              stroke={color}
              strokeOpacity={0.55}
              strokeWidth={1.25}
              strokeDasharray={dash}
            />
            <polyline
              points={seg.idx.map((j) => `${cx(j)},${yScale(spanBArr[j]!)}`).join(" ")}
              fill="none"
              stroke={color}
              strokeOpacity={0.55}
              strokeWidth={1.25}
              strokeDasharray={dash}
            />
          </g>
        );
      })}
    </g>
  );
}

export default function Chart() {
  const W = window.ANYPLOT_SIZE.width;
  const H = window.ANYPLOT_SIZE.height;
  const TITLE_H = 74;
  const LEGEND_H = 48;
  const chartH = H - TITLE_H - LEGEND_H;

  const title = "TechCo Daily Price · indicator-ichimoku · javascript · muix · anyplot.ai";
  const titleSize = title.length > 67 ? Math.round((22 * 67) / title.length) : 22;

  const legendItems = [
    {
      label: "Bullish Candle",
      swatch: <Box sx={{ width: 14, height: 14, bgcolor: t.pageBg, border: `2px solid ${t.palette[0]}`, borderRadius: "2px" }} />,
    },
    { label: "Bearish Candle", swatch: <Box sx={{ width: 14, height: 14, bgcolor: t.palette[4], borderRadius: "2px" }} /> },
    { label: "Tenkan-sen", swatch: <Box sx={{ width: 22, height: 3, bgcolor: t.palette[1], borderRadius: "2px" }} /> },
    { label: "Kijun-sen", swatch: <Box sx={{ width: 22, height: 3, bgcolor: t.palette[2], borderRadius: "2px" }} /> },
    { label: "Chikou Span", swatch: <Box sx={{ width: 22, height: 0, borderTop: `2.5px dashed ${t.palette[3]}` }} /> },
    {
      label: "Kumo (Bullish)",
      swatch: <Box sx={{ width: 18, height: 14, bgcolor: t.palette[0], opacity: 0.3, borderRadius: "2px", border: `1.5px solid ${t.palette[0]}` }} />,
    },
    {
      label: "Kumo (Bearish)",
      swatch: (
        <Box
          sx={{
            width: 18,
            height: 14,
            bgcolor: t.palette[4],
            opacity: 0.3,
            borderRadius: "2px",
            border: `1.5px dashed ${t.palette[4]}`,
          }}
        />
      ),
    },
  ];

  return (
    <Box
      sx={{
        width: W,
        height: H,
        bgcolor: t.pageBg,
        display: "flex",
        flexDirection: "column",
        fontFamily: "'Roboto', 'Helvetica Neue', Arial, sans-serif",
        boxSizing: "border-box",
      }}
    >
      <Box sx={{ height: TITLE_H, display: "flex", alignItems: "center", justifyContent: "center" }}>
        <Typography sx={{ color: t.ink, fontSize: titleSize, fontWeight: 600 }}>{title}</Typography>
      </Box>

      <ChartContainer
        width={W}
        height={chartH}
        skipAnimation
        series={[
          {
            type: "line",
            id: "tenkan",
            xAxisId: "x",
            yAxisId: "y",
            data: tenkanArr,
            label: "Tenkan-sen",
            color: t.palette[1],
            showMark: false,
            curve: "linear",
            connectNulls: false,
          },
          {
            type: "line",
            id: "kijun",
            xAxisId: "x",
            yAxisId: "y",
            data: kijunArr,
            label: "Kijun-sen",
            color: t.palette[2],
            showMark: false,
            curve: "linear",
            connectNulls: false,
          },
          {
            type: "line",
            id: "chikou",
            xAxisId: "x",
            yAxisId: "y",
            data: chikouArr,
            label: "Chikou Span",
            color: t.palette[3],
            showMark: false,
            curve: "linear",
            connectNulls: false,
          },
        ]}
        xAxis={[
          {
            id: "x",
            scaleType: "band",
            data: dateLabels,
            tickLabelInterval: (_value: string, index: number) => index % 13 === 0,
            tickLabelStyle: { fontSize: 14, fill: t.inkSoft },
          },
        ]}
        yAxis={[
          {
            id: "y",
            min: yMin - yPad,
            max: yMax + yPad,
            valueFormatter: (v: number) => `$${v.toFixed(0)}`,
            tickLabelStyle: { fontSize: 13, fill: t.inkSoft },
          },
        ]}
        margin={{ top: 24, bottom: 64, left: 112, right: 32 }}
        sx={{
          "& .MuiLineElement-series-chikou": { strokeDasharray: "7 5", strokeWidth: 2.5 },
          "& .MuiLineElement-series-tenkan": { strokeWidth: 2.25 },
          "& .MuiLineElement-series-kijun": { strokeWidth: 2.25 },
          "& .MuiChartsAxis-line": { stroke: t.inkSoft, strokeOpacity: 0.2 },
          "& .MuiChartsGrid-line": { stroke: t.grid },
        }}
      >
        <ChartsGrid horizontal />
        <KumoCloud />
        <Candlesticks />
        <LinePlot skipAnimation />
        <ChartsXAxis axisId="x" label="Trading Date" labelStyle={{ fontSize: 15, fill: t.ink }} />
        {/* Explicit axisLabel x offset — the default offset formula assumes short
            tick labels and clips against our "$162"-style dollar-formatted ticks. */}
        <ChartsYAxis
          axisId="y"
          label="Price (USD)"
          labelStyle={{ fontSize: 15, fill: t.ink }}
          slotProps={{ axisLabel: { x: -72 } }}
        />
      </ChartContainer>

      <Box sx={{ height: LEGEND_H, display: "flex", alignItems: "center", justifyContent: "center", gap: "26px", flexWrap: "wrap" }}>
        {legendItems.map((item) => (
          <Box key={item.label} sx={{ display: "flex", alignItems: "center", gap: "8px" }}>
            {item.swatch}
            <Typography sx={{ color: t.inkSoft, fontSize: 13 }}>{item.label}</Typography>
          </Box>
        ))}
      </Box>
    </Box>
  );
}
Runnable source as JSON, for any HTTP client: https://api.anyplot.ai/specs/indicator-ichimoku/muix/code. Any spec id and library id listed in llms-full.txt fit the same URL shape; every URL below is complete and callable.
{
  "spec_id": "indicator-ichimoku",
  "language": "javascript",
  "library": "muix",
  "page": "https://anyplot.ai/indicator-ichimoku/javascript/muix",
  "hub": "https://anyplot.ai/indicator-ichimoku",
  "code_json": "https://api.anyplot.ai/specs/indicator-ichimoku/muix/code",
  "spec_json": "https://api.anyplot.ai/specs/indicator-ichimoku",
  "render_light_png": "https://storage.googleapis.com/anyplot-images/plots/indicator-ichimoku/javascript/muix/plot-light.png",
  "render_dark_png": "https://storage.googleapis.com/anyplot-images/plots/indicator-ichimoku/javascript/muix/plot-dark.png",
  "interactive_light_html": "https://storage.googleapis.com/anyplot-images/plots/indicator-ichimoku/javascript/muix/plot-light.html",
  "interactive_dark_html": "https://storage.googleapis.com/anyplot-images/plots/indicator-ichimoku/javascript/muix/plot-dark.html",
  "quality_score": 92.0,
  "license": "MIT",
  "guide": "https://anyplot.ai/llms.txt"
}
Part of Ichimoku Cloud Technical Indicator Chart on anyplot.ai.