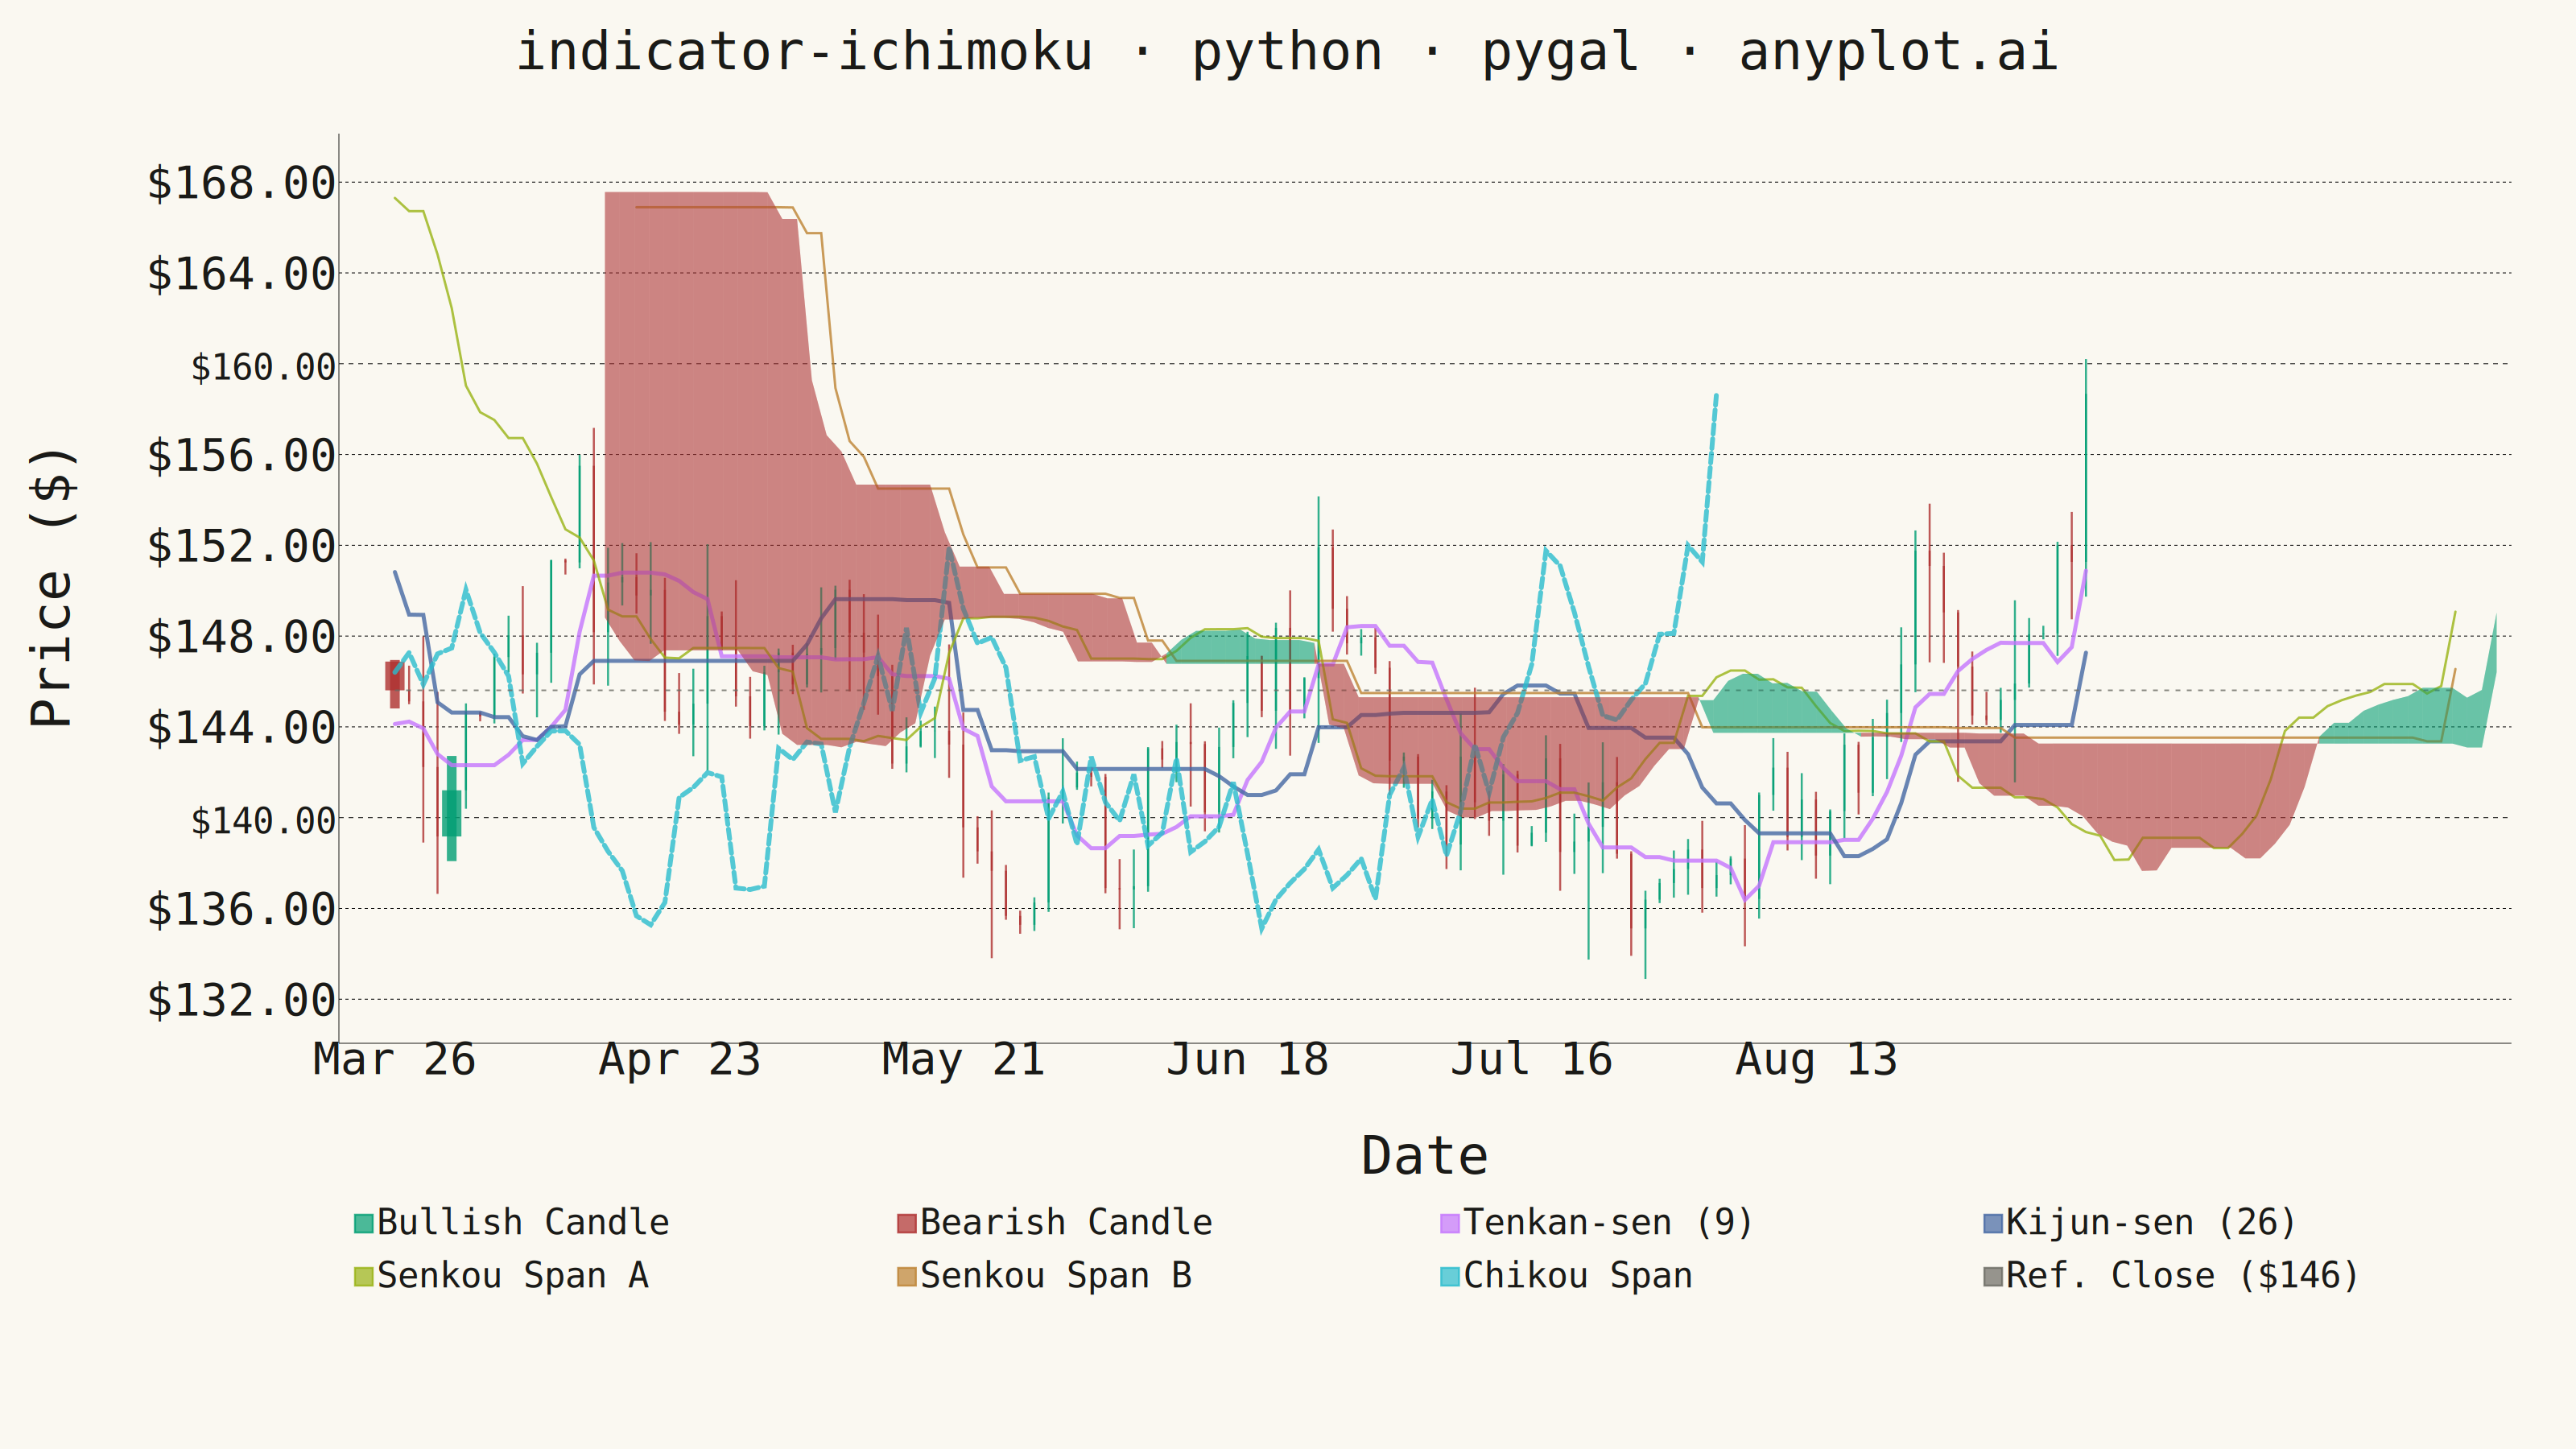
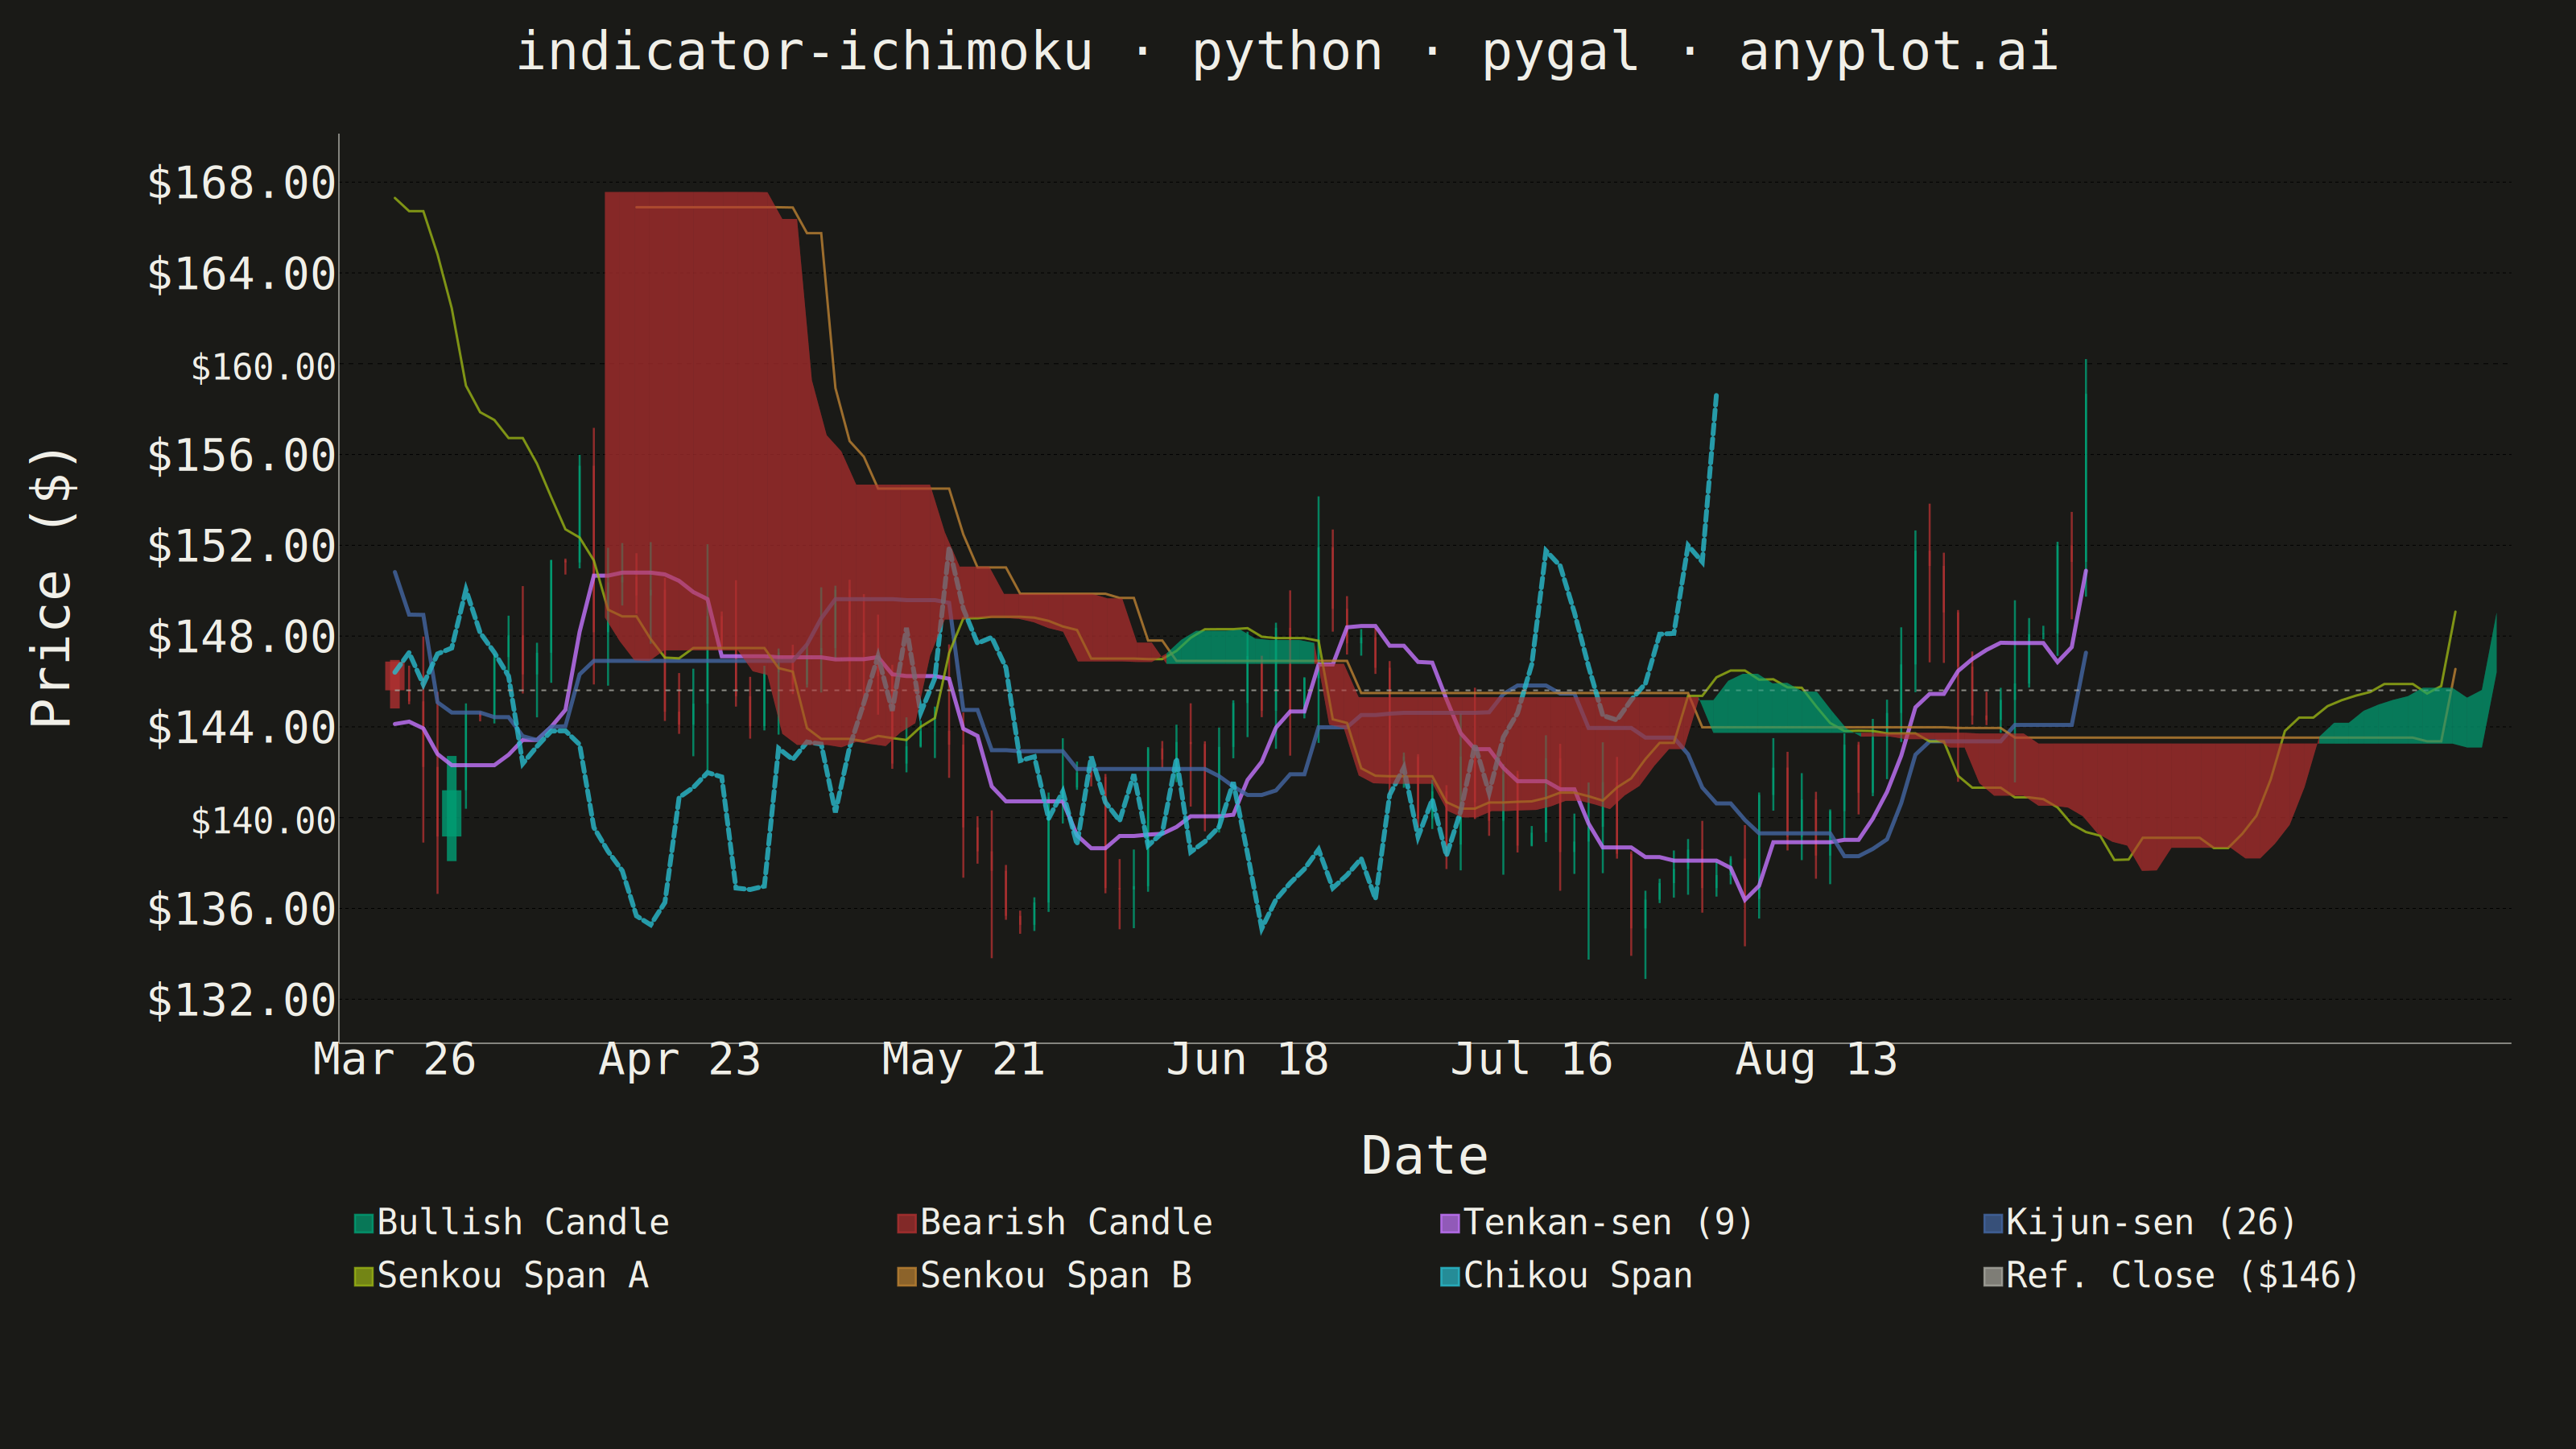
Displays the Ichimoku Kinko Hyo ("one glance equilibrium chart") overlay on a candlestick price chart. The indicator plots five lines — Tenkan-sen (conversion), Kijun-sen (base), Senkou Span A, Senkou Span B, and Chikou Span (lagging) — with the area between Senkou Span A and B filled as the "Kumo" (cloud). The cloud color changes depending on which span is on top, providing an at-a-glance view of trend direction, momentum, and support/resistance zones.
""" anyplot.ai
indicator-ichimoku: Ichimoku Cloud Technical Indicator Chart
Library: pygal 3.1.0 | Python 3.13.13
Quality: 85/100 | Updated: 2026-06-08
"""

import os
import re
import sys
from datetime import datetime, timedelta


# Script is named pygal.py — remove its directory from sys.path so the real package resolves
sys.path = [p for p in sys.path if p != os.path.dirname(os.path.abspath(__file__))]

import cairosvg
import numpy as np
import pygal
from pygal.style import Style


# Theme tokens — Imprint palette (data colors theme-independent, chrome theme-adaptive)
THEME = os.getenv("ANYPLOT_THEME", "light")
PAGE_BG = "#FAF8F1" if THEME == "light" else "#1A1A17"
INK = "#1A1A17" if THEME == "light" else "#F0EFE8"
INK_MUTED = "#6B6A63" if THEME == "light" else "#A8A79F"

# Imprint palette — semantic exception applies: green up / red down is universal chart convention
BULL_CLR = "#009E73"  # Imprint position 1: bullish candles (semantic green)
BEAR_CLR = "#AE3030"  # Imprint position 5: bearish candles (semantic red anchor)
TENKAN_CLR = "#C475FD"  # Imprint position 2: Tenkan-sen (conversion line)
KIJUN_CLR = "#4467A3"  # Imprint position 3: Kijun-sen (base line)
SPAN_A_CLR = "#99B314"  # Imprint position 8: Senkou Span A
SPAN_B_CLR = "#BD8233"  # Imprint position 4: Senkou Span B
CHIKOU_CLR = "#2ABCCD"  # Imprint position 6: Chikou Span
CLOUD_BULL = "#009E73"  # Kumo fill when Span A > Span B (bullish)
CLOUD_BEAR = "#AE3030"  # Kumo fill when Span B > Span A (bearish)
CLOUD_OPA = "0.25" if THEME == "light" else "0.35"

# Data: 180 trading days of synthetic OHLC stock prices (weekends skipped)
np.random.seed(42)
n_days = 180

start_date = datetime(2024, 1, 2)
dates = []
cur = start_date
for _ in range(n_days):
    while cur.weekday() >= 5:
        cur += timedelta(days=1)
    dates.append(cur)
    cur += timedelta(days=1)

base_price = 175.0
returns = np.random.randn(n_days) * 1.8
price_series = base_price * np.cumprod(1 + returns / 100)

ohlc = []
for i, close in enumerate(price_series):
    volatility = abs(np.random.randn()) * 1.5 + 0.3
    intraday_range = close * volatility / 100
    open_price = base_price if i == 0 else ohlc[-1]["close"]
    high = max(open_price, close) + np.random.rand() * intraday_range
    low = min(open_price, close) - np.random.rand() * intraday_range
    ohlc.append({"open": open_price, "high": high, "low": low, "close": close})

highs = np.array([d["high"] for d in ohlc])
lows = np.array([d["low"] for d in ohlc])
closes = np.array([d["close"] for d in ohlc])

# Ichimoku indicators — standard parameters (9, 26, 52)
TENKAN_P, KIJUN_P, SENKOU_B_P, SHIFT = 9, 26, 52, 26

tenkan_sen = np.full(n_days, np.nan)
kijun_sen = np.full(n_days, np.nan)
senkou_a = np.full(n_days + SHIFT, np.nan)
senkou_b = np.full(n_days + SHIFT, np.nan)
chikou_span = np.full(n_days, np.nan)

for i in range(n_days):
    if i >= TENKAN_P - 1:
        tenkan_sen[i] = (highs[i - TENKAN_P + 1 : i + 1].max() + lows[i - TENKAN_P + 1 : i + 1].min()) / 2
    if i >= KIJUN_P - 1:
        kijun_sen[i] = (highs[i - KIJUN_P + 1 : i + 1].max() + lows[i - KIJUN_P + 1 : i + 1].min()) / 2
    if i >= KIJUN_P - 1:
        senkou_a[i + SHIFT] = (tenkan_sen[i] + kijun_sen[i]) / 2
    if i >= SENKOU_B_P - 1:
        senkou_b[i + SHIFT] = (highs[i - SENKOU_B_P + 1 : i + 1].max() + lows[i - SENKOU_B_P + 1 : i + 1].min()) / 2
    if i >= SHIFT:
        chikou_span[i - SHIFT] = closes[i]

# Display range: days 60-180 (120 candles + 26 cloud projection)
VIEW_START, VIEW_END = 60, n_days
total_x = VIEW_END - VIEW_START + SHIFT

# Candlestick segments — wicks and bodies split by direction
bull_wicks, bear_wicks = [], []
bull_bodies, bear_bodies = [], []

for i in range(VIEW_START, VIEW_END):
    x = i - VIEW_START + 1
    c = ohlc[i]
    wick = [(x, c["low"]), (x, c["high"]), None]
    body = [(x, c["open"]), (x, c["close"]), None]
    if c["close"] >= c["open"]:
        bull_wicks.extend(wick)
        bull_bodies.extend(body)
    else:
        bear_wicks.extend(wick)
        bear_bodies.extend(body)

# Ichimoku line data points
tenkan_pts = [
    (i - VIEW_START + 1, float(tenkan_sen[i])) for i in range(VIEW_START, VIEW_END) if not np.isnan(tenkan_sen[i])
]
kijun_pts = [
    (i - VIEW_START + 1, float(kijun_sen[i])) for i in range(VIEW_START, VIEW_END) if not np.isnan(kijun_sen[i])
]

span_a_pts, span_b_pts = [], []
for i in range(VIEW_START, VIEW_END + SHIFT):
    x = i - VIEW_START + 1
    if i < len(senkou_a) and not np.isnan(senkou_a[i]):
        span_a_pts.append((x, float(senkou_a[i])))
    if i < len(senkou_b) and not np.isnan(senkou_b[i]):
        span_b_pts.append((x, float(senkou_b[i])))

chikou_pts = [
    (i - VIEW_START + 1, float(chikou_span[i])) for i in range(VIEW_START, VIEW_END) if not np.isnan(chikou_span[i])
]

# Price range for y-axis
all_p = [d["high"] for d in ohlc[VIEW_START:VIEW_END]] + [d["low"] for d in ohlc[VIEW_START:VIEW_END]]
all_p += [v for v in senkou_a[VIEW_START : VIEW_END + SHIFT] if not np.isnan(v)]
all_p += [v for v in senkou_b[VIEW_START : VIEW_END + SHIFT] if not np.isnan(v)]
p_min, p_max = min(all_p), max(all_p)
p_pad = (p_max - p_min) * 0.06

# Pygal style — theme-adaptive chrome, Imprint palette
custom_style = Style(
    background=PAGE_BG,
    plot_background=PAGE_BG,
    foreground=INK,
    foreground_strong=INK,
    foreground_subtle=INK_MUTED,
    colors=(
        BULL_CLR,
        BEAR_CLR,
        BULL_CLR,
        BEAR_CLR,
        TENKAN_CLR,
        KIJUN_CLR,
        SPAN_A_CLR,
        SPAN_B_CLR,
        CHIKOU_CLR,
        INK_MUTED,
    ),
    stroke_width=2.5,
    title_font_size=66,
    label_font_size=56,
    major_label_font_size=44,
    legend_font_size=44,
    value_font_size=36,
)

title = "indicator-ichimoku · python · pygal · anyplot.ai"
date_map = {i - VIEW_START + 1: dates[i] for i in range(VIEW_START, min(VIEW_END, len(dates)))}

chart = pygal.XY(
    style=custom_style,
    width=3200,
    height=1800,
    title=title,
    x_title="Date",
    y_title="Price ($)",
    show_dots=False,
    show_x_guides=False,
    show_y_guides=True,
    allow_interruptions=True,
    range=(p_min - p_pad, p_max + p_pad),
    xrange=(0, total_x + 1),
    legend_box_size=22,
    margin=80,
    spacing=20,
    tooltip_border_radius=8,
    truncate_legend=-1,
    value_formatter=lambda x: f"${x:.2f}",
    legend_at_bottom=True,
)

chart.x_labels = list(range(1, total_x + 1, 20))
chart.x_value_formatter = lambda x: date_map[int(round(x))].strftime("%b %d") if int(round(x)) in date_map else ""

WICK_W, BODY_W, LINE_W, CHIKOU_W, REF_W = 12, 24, 5, 6, 2

# Wicks — title=None hides from legend; series still rendered as serie-0 / serie-1
chart.add(None, bull_wicks, stroke=True, show_dots=False, stroke_style={"width": WICK_W, "linecap": "butt"})
chart.add(None, bear_wicks, stroke=True, show_dots=False, stroke_style={"width": WICK_W, "linecap": "butt"})

# Candle bodies
chart.add(
    "Bullish Candle", bull_bodies, stroke=True, show_dots=False, stroke_style={"width": BODY_W, "linecap": "butt"}
)
chart.add(
    "Bearish Candle", bear_bodies, stroke=True, show_dots=False, stroke_style={"width": BODY_W, "linecap": "butt"}
)

# Ichimoku lines
chart.add(
    "Tenkan-sen (9)", tenkan_pts, stroke=True, show_dots=False, stroke_style={"width": LINE_W, "linecap": "round"}
)
chart.add("Kijun-sen (26)", kijun_pts, stroke=True, show_dots=False, stroke_style={"width": LINE_W, "linecap": "round"})
chart.add("Senkou Span A", span_a_pts, stroke=True, show_dots=False, stroke_style={"width": 3, "linecap": "round"})
chart.add("Senkou Span B", span_b_pts, stroke=True, show_dots=False, stroke_style={"width": 3, "linecap": "round"})
chart.add(
    "Chikou Span",
    chikou_pts,
    stroke=True,
    show_dots=False,
    stroke_style={"width": CHIKOU_W, "linecap": "round", "dasharray": "12,6"},
)

# Reference line: close price at start of view window — focal point for price progress
ref_price = ohlc[VIEW_START]["close"]
chart.add(
    f"Ref. Close (${ref_price:.0f})",
    [(1, ref_price), (total_x, ref_price)],
    stroke=True,
    show_dots=False,
    stroke_style={"width": REF_W, "linecap": "butt", "dasharray": "6,8"},
)

# Render SVG; post-process stroke widths (cairosvg ignores pygal's JS-based styling)
svg = chart.render(is_unicode=True)

stroke_specs = [
    (WICK_W, "butt"),
    (WICK_W, "butt"),  # series 0-1: wicks
    (BODY_W, "butt"),
    (BODY_W, "butt"),  # series 2-3: bodies
    (LINE_W, "round"),
    (LINE_W, "round"),  # series 4-5: tenkan, kijun
    (3, "round"),
    (3, "round"),  # series 6-7: span a, span b
    (CHIKOU_W, "round"),  # series 8: chikou
    (REF_W, "butt"),  # series 9: reference line
]
for sid, (w, cap) in enumerate(stroke_specs):
    svg = re.sub(
        rf'(class="series serie-{sid} color-{sid}"[^>]*>.*?)(class="line reactive nofill")',
        rf'\1\2 style="stroke-width:{w};stroke-linecap:{cap}"',
        svg,
        count=1,
        flags=re.DOTALL,
    )

# Inject Kumo cloud polygons — transform data coords → SVG pixel space
bg_rects = re.findall(r'<rect[^>]*width="([^"]*)"[^>]*height="([^"]*)"[^>]*class="background"', svg)
if len(bg_rects) >= 2:
    inner_w, inner_h = float(bg_rects[1][0]), float(bg_rects[1][1])
    x_range_d = total_x + 1
    y_lo = p_min - p_pad
    y_range_d = (p_max + p_pad) - y_lo

    span_a_dict = dict(span_a_pts)
    span_b_dict = dict(span_b_pts)
    common_x = sorted(set(span_a_dict) & set(span_b_dict))

    polys = []
    for k in range(len(common_x) - 1):
        x1, x2 = common_x[k], common_x[k + 1]
        if x2 - x1 > 2:
            continue
        a1, b1 = span_a_dict[x1], span_b_dict[x1]
        a2, b2 = span_a_dict[x2], span_b_dict[x2]
        fill = CLOUD_BULL if (a1 + a2) >= (b1 + b2) else CLOUD_BEAR
        pts = [(x1, a1), (x2, a2), (x2, b2), (x1, b1)]
        coords = " ".join(
            f"{x / x_range_d * inner_w:.1f},{inner_h - (y - y_lo) / y_range_d * inner_h:.1f}" for x, y in pts
        )
        polys.append(f'<polygon points="{coords}" fill="{fill}" fill-opacity="{CLOUD_OPA}" stroke="none" />')

    if polys:
        svg = svg.replace('<g class="series serie-0', "\n".join(polys) + '\n<g class="series serie-0')

# Save PNG and interactive HTML
cairosvg.svg2png(bytestring=svg.encode("utf-8"), write_to=f"plot-{THEME}.png")
with open(f"plot-{THEME}.html", "w") as f:
    f.write(svg)
Runnable source as JSON, for any HTTP client: https://api.anyplot.ai/specs/indicator-ichimoku/pygal/code. Any spec id and library id listed in llms-full.txt fit the same URL shape; every URL below is complete and callable.
{
  "spec_id": "indicator-ichimoku",
  "language": "python",
  "library": "pygal",
  "page": "https://anyplot.ai/indicator-ichimoku/python/pygal",
  "hub": "https://anyplot.ai/indicator-ichimoku",
  "code_json": "https://api.anyplot.ai/specs/indicator-ichimoku/pygal/code",
  "spec_json": "https://api.anyplot.ai/specs/indicator-ichimoku",
  "render_light_png": "https://storage.googleapis.com/anyplot-images/plots/indicator-ichimoku/python/pygal/plot-light.png",
  "render_dark_png": "https://storage.googleapis.com/anyplot-images/plots/indicator-ichimoku/python/pygal/plot-dark.png",
  "interactive_light_html": "https://storage.googleapis.com/anyplot-images/plots/indicator-ichimoku/python/pygal/plot-light.html",
  "interactive_dark_html": "https://storage.googleapis.com/anyplot-images/plots/indicator-ichimoku/python/pygal/plot-dark.html",
  "quality_score": 85.0,
  "license": "MIT",
  "guide": "https://anyplot.ai/llms.txt"
}
Part of Ichimoku Cloud Technical Indicator Chart on anyplot.ai.