The same plot in 14 other libraries — Python: Altair, Bokeh, lets-plot, Matplotlib, Plotly, plotnine, Pygal, Seaborn; R: ggplot2; JavaScript: Chart.js, D3.js, Apache ECharts, Highcharts, MUI X Charts. Compare all 15 side by side: Ichimoku Cloud Technical Indicator Chart in Python, R, Julia and JavaScript.
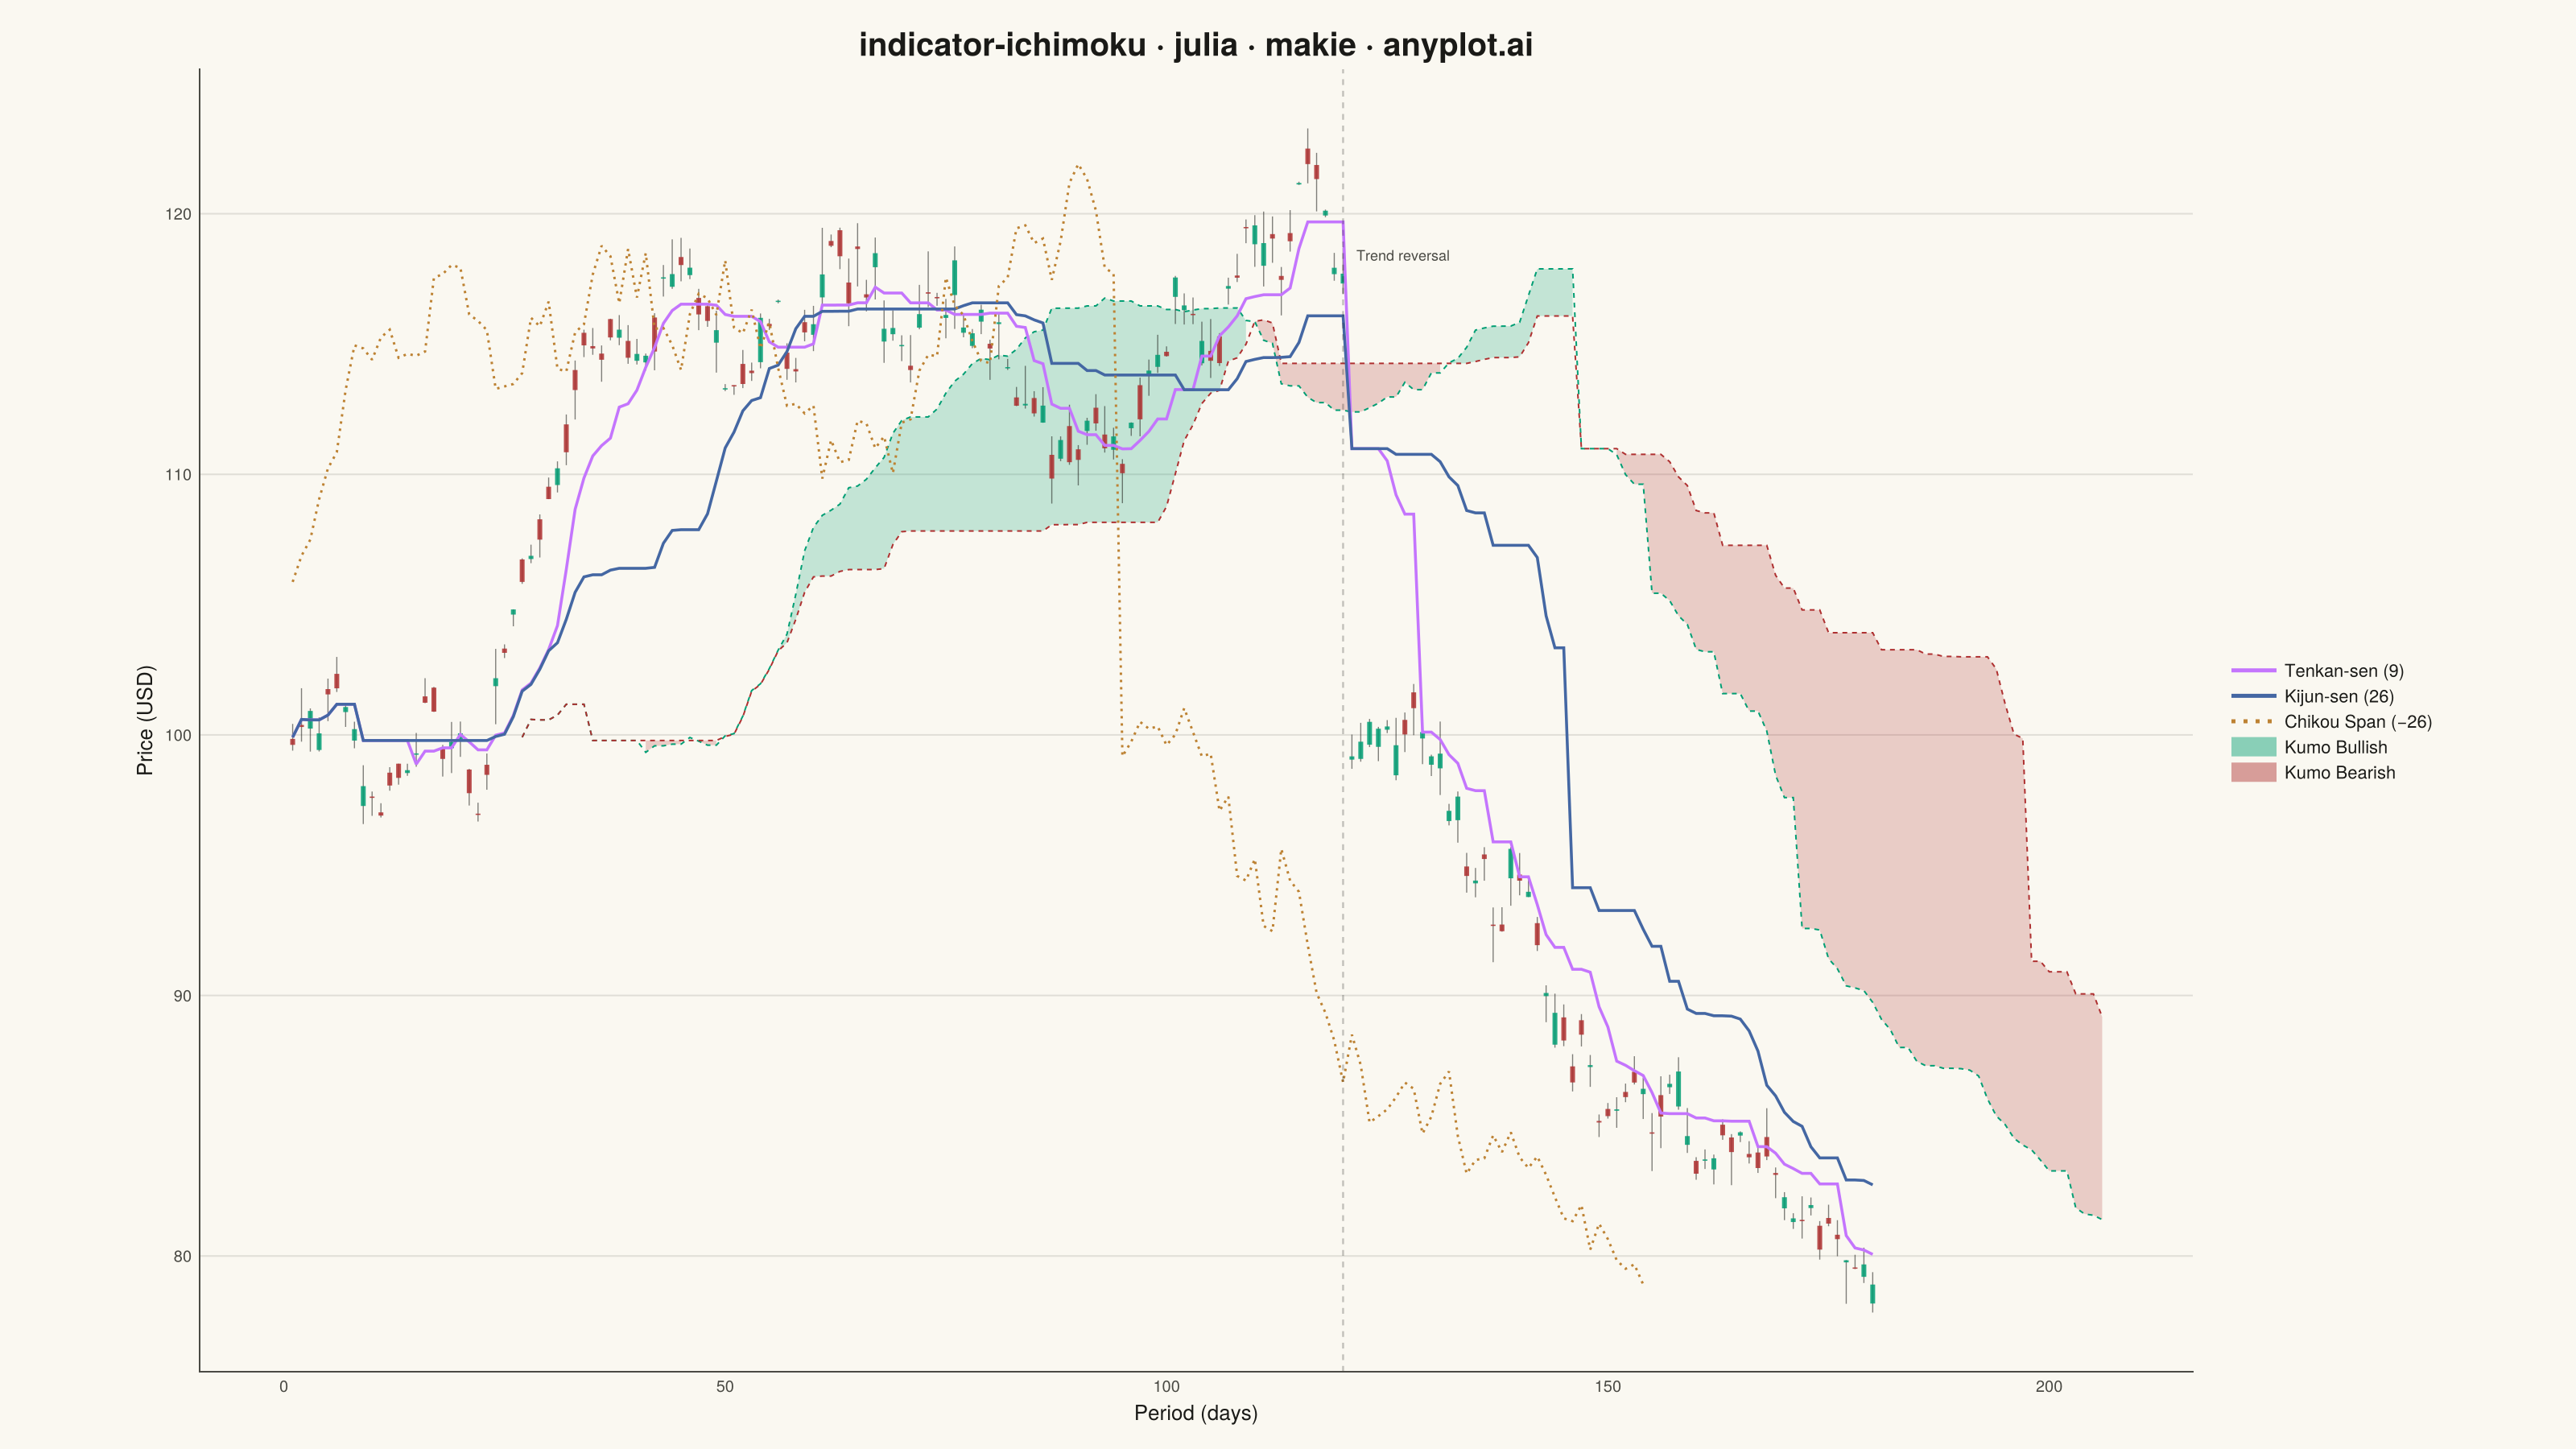
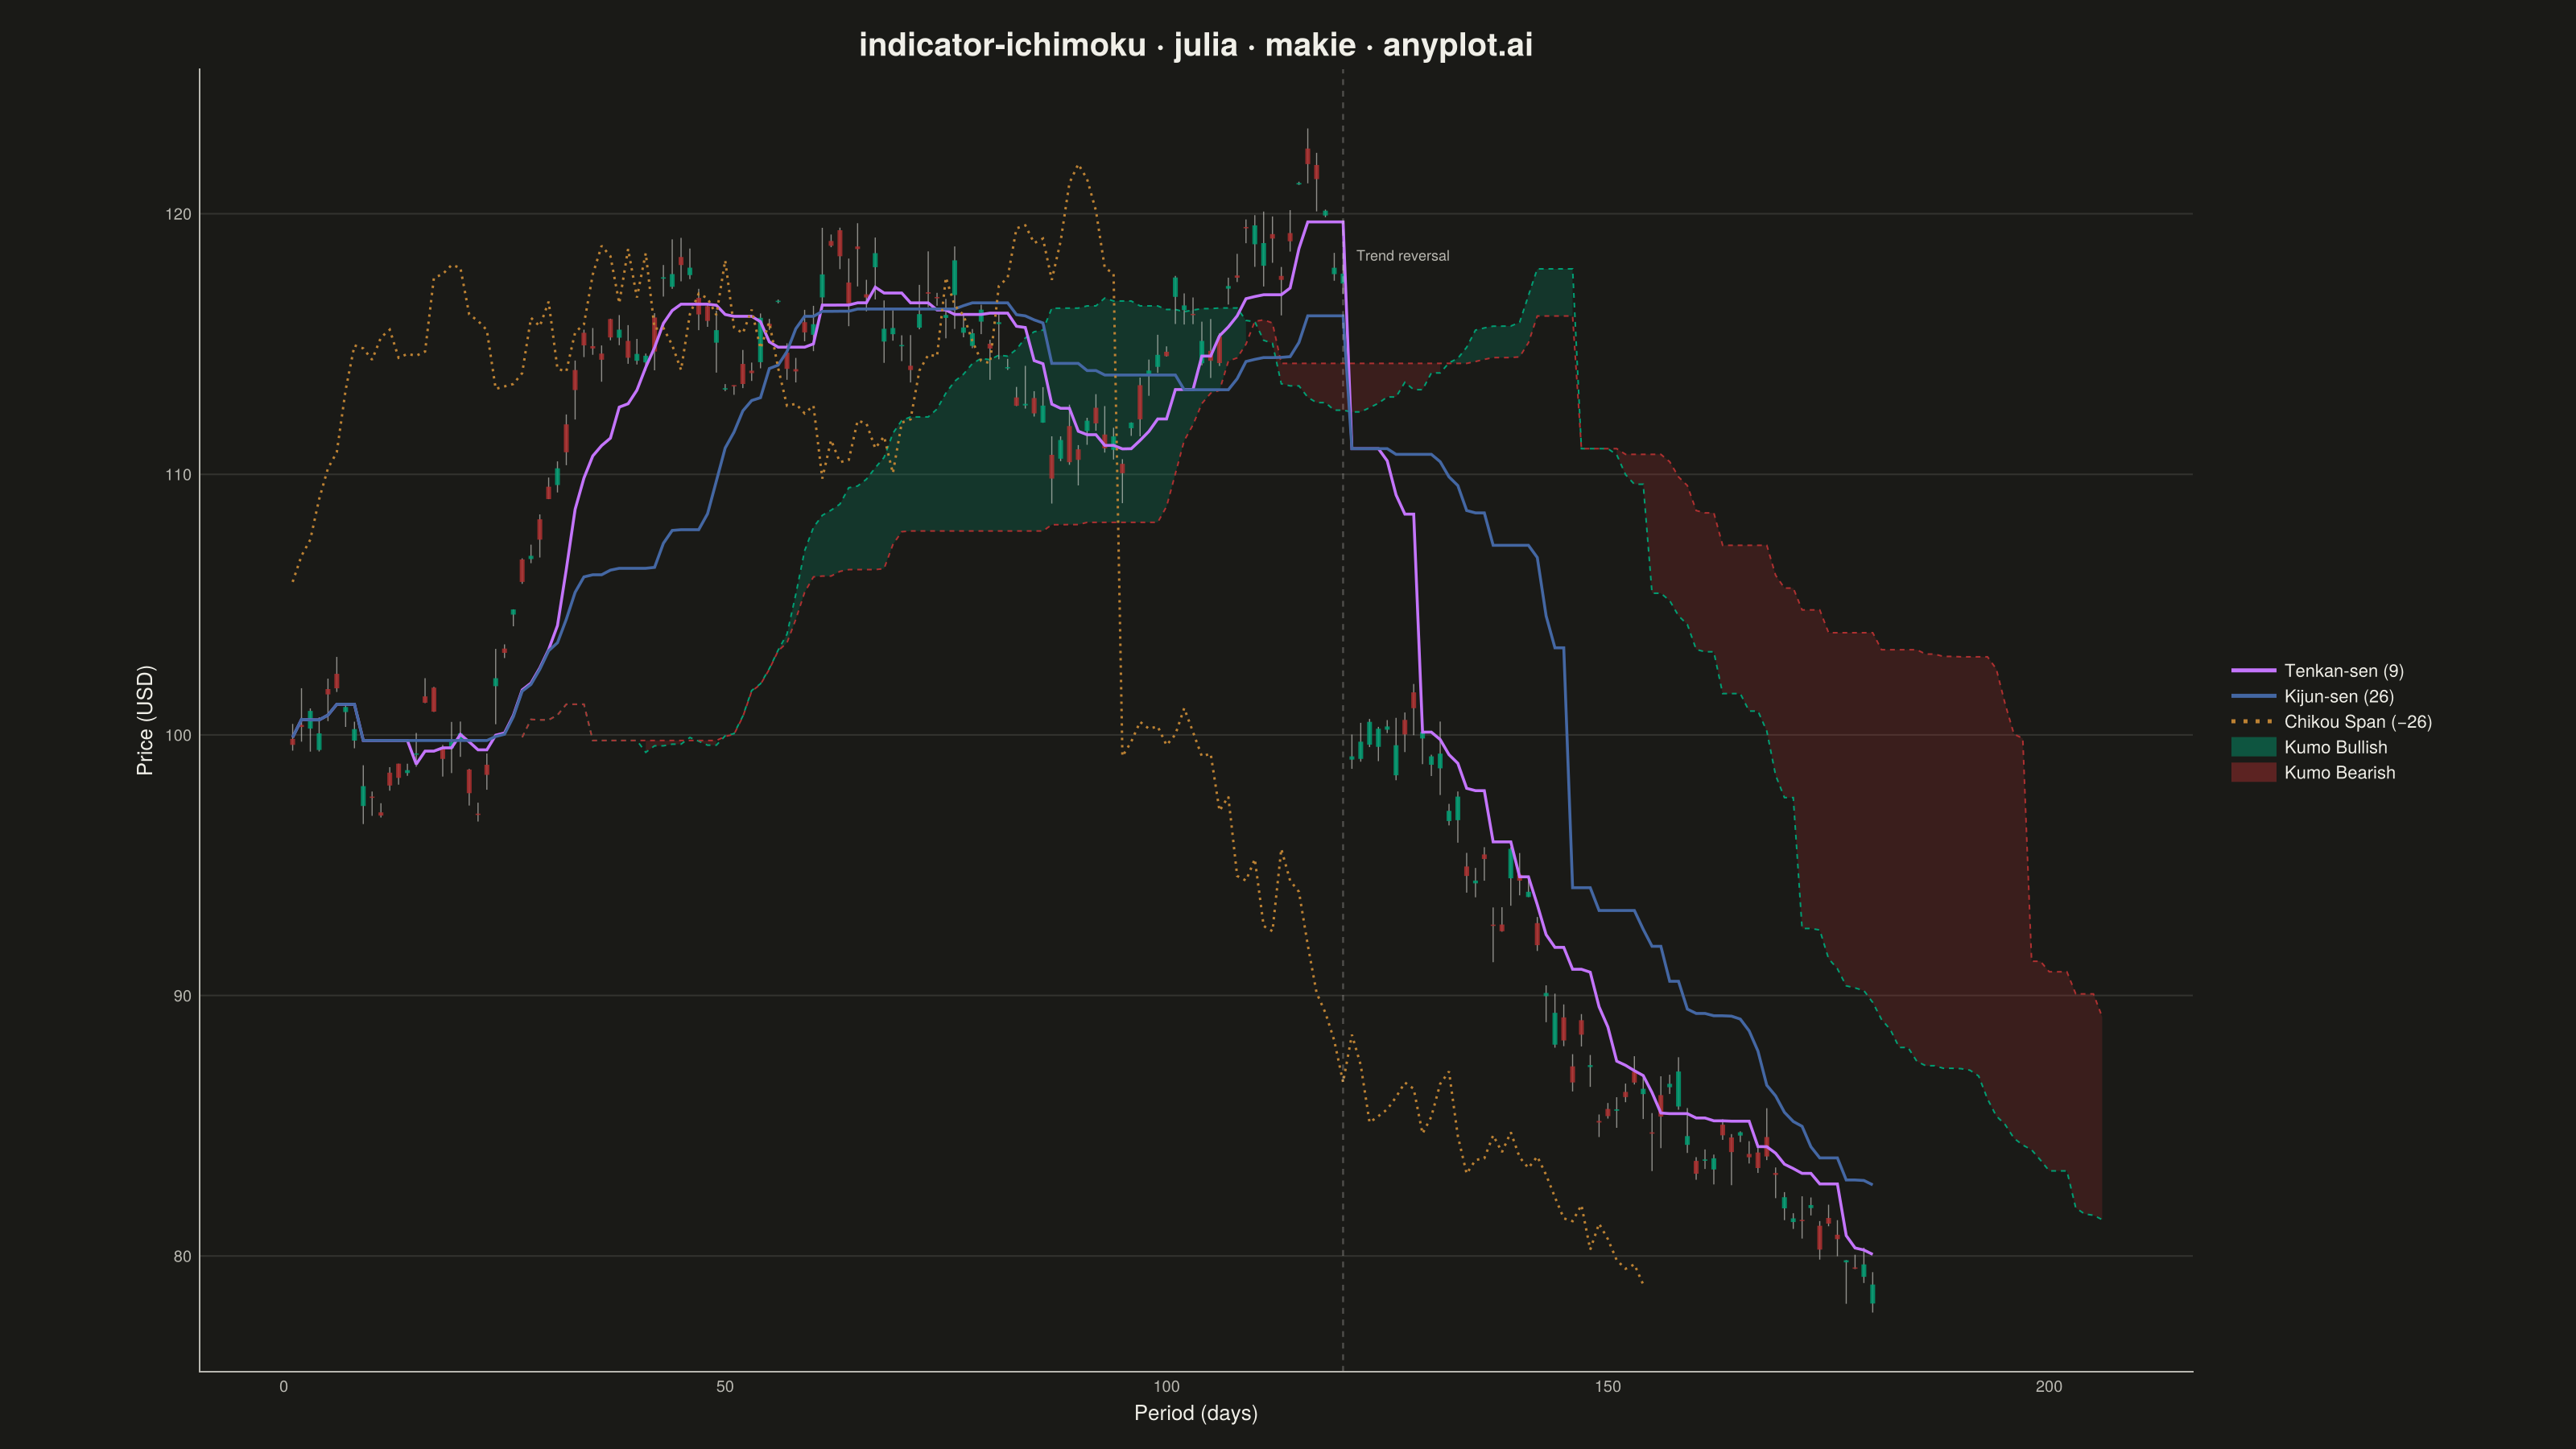
Displays the Ichimoku Kinko Hyo ("one glance equilibrium chart") overlay on a candlestick price chart. The indicator plots five lines — Tenkan-sen (conversion), Kijun-sen (base), Senkou Span A, Senkou Span B, and Chikou Span (lagging) — with the area between Senkou Span A and B filled as the "Kumo" (cloud). The cloud color changes depending on which span is on top, providing an at-a-glance view of trend direction, momentum, and support/resistance zones.
# anyplot.ai
# indicator-ichimoku: Ichimoku Cloud Technical Indicator Chart
# Library: makie 0.22.10 | Julia 1.11.9
# Quality: 87/100 | Created: 2026-06-08

using CairoMakie
using Colors
using Random

Random.seed!(42)

# Theme tokens
const THEME       = get(ENV, "ANYPLOT_THEME", "light")
const PAGE_BG     = THEME == "light" ? colorant"#FAF8F1" : colorant"#1A1A17"
const ELEVATED_BG = THEME == "light" ? colorant"#FFFDF6" : colorant"#242420"
const INK         = THEME == "light" ? colorant"#1A1A17" : colorant"#F0EFE8"
const INK_SOFT    = THEME == "light" ? colorant"#4A4A44" : colorant"#B8B7B0"

# Imprint palette — 8 hues, hybrid-v3 sort order
const IMPRINT_PALETTE = [
    colorant"#009E73",  # 1 — brand green
    colorant"#C475FD",  # 2 — lavender
    colorant"#4467A3",  # 3 — blue
    colorant"#BD8233",  # 4 — ochre
    colorant"#AE3030",  # 5 — matte red
    colorant"#2ABCCD",  # 6 — cyan
    colorant"#954477",  # 7 — rose
    colorant"#99B314",  # 8 — lime
]

# Data: synthetic stock OHLC across 180 periods with two trend phases
n     = 180
shift = 26  # standard Ichimoku displacement parameter

# Price with uptrend then downtrend for visible cloud colour change
phase_up   = cumsum(randn(120) .* 1.2 .+ 0.22)
phase_down = cumsum(randn(60)  .* 1.2 .- 0.38)
mid_prices = vcat(phase_up, phase_down) .+ 100.0

open_px  = mid_prices .+ randn(n) .* 0.35
close_px = mid_prices .+ randn(n) .* 0.35
high_px  = max.(open_px, close_px) .+ abs.(randn(n) .* 0.65)
low_px   = min.(open_px, close_px) .- abs.(randn(n) .* 0.65)

# Ichimoku components (standard 9/26/52 parameters)
tenkan = [(maximum(high_px[max(1, i - 8):i]) + minimum(low_px[max(1, i - 8):i])) / 2
          for i in 1:n]
kijun  = [(maximum(high_px[max(1, i - 25):i]) + minimum(low_px[max(1, i - 25):i])) / 2
          for i in 1:n]

span_a_raw = (tenkan .+ kijun) ./ 2

span_b_raw = [(maximum(high_px[max(1, i - 51):i]) + minimum(low_px[max(1, i - 51):i])) / 2
              for i in 1:n]

# Cloud is plotted 26 periods ahead
cloud_x = Float64.((shift + 1):(n + shift))
span_a_cld = span_a_raw
span_b_cld = span_b_raw

# Chikou Span: current close shifted 26 periods into the past
chikou_x = Float64.(1:(n - shift))
chikou_y = close_px[(shift + 1):n]

xs = Float64.(1:n)

# ── Figure ──────────────────────────────────────────────────────────────────
title_str = "indicator-ichimoku · julia · makie · anyplot.ai"
title_sz  = Int(round(20 * min(1.0, 67 / length(title_str))))

fig = Figure(
    size            = (1600, 900),
    fontsize        = 13,
    backgroundcolor = PAGE_BG,
)

ax = Axis(
    fig[1, 1];
    title             = title_str,
    titlesize         = title_sz,
    titlecolor        = INK,
    xlabel            = "Period (days)",
    ylabel            = "Price (USD)",
    xlabelsize        = 13,
    ylabelsize        = 13,
    xlabelcolor       = INK,
    ylabelcolor       = INK,
    xticklabelsize    = 10,
    yticklabelsize    = 10,
    xticklabelcolor   = INK_SOFT,
    yticklabelcolor   = INK_SOFT,
    xtickcolor        = INK_SOFT,
    ytickcolor        = INK_SOFT,
    xticksvisible     = false,
    yticksvisible     = false,
    backgroundcolor   = PAGE_BG,
    topspinevisible   = false,
    rightspinevisible = false,
    leftspinecolor    = INK_SOFT,
    bottomspinecolor  = INK_SOFT,
    xgridvisible      = false,
    ygridcolor        = RGBAf(INK.r, INK.g, INK.b, 0.12),
)

# ── Kumo (cloud) — drawn first so it sits behind price data ─────────────────
# Bullish region: Span A > Span B → green fill
bull        = span_a_cld .> span_b_cld
sa_bull     = copy(span_a_cld); sa_bull[.!bull] .= NaN
sb_bull     = copy(span_b_cld); sb_bull[.!bull] .= NaN
band!(ax, cloud_x, sb_bull, sa_bull; color = (colorant"#009E73", 0.22))

# Bearish region: Span B > Span A → red fill
bear        = span_b_cld .> span_a_cld
# Price trend change at period 120 (bull → bear phase boundary in generated data)
trans_x = 120.0
sa_bear     = copy(span_a_cld); sa_bear[.!bear] .= NaN
sb_bear     = copy(span_b_cld); sb_bear[.!bear] .= NaN
band!(ax, cloud_x, sa_bear, sb_bear; color = (colorant"#AE3030", 0.22))

# Cloud boundary lines
lines!(ax, cloud_x, span_a_cld; color = IMPRINT_PALETTE[1], linewidth = 1.0, linestyle = :dash)
lines!(ax, cloud_x, span_b_cld; color = IMPRINT_PALETTE[5], linewidth = 1.0, linestyle = :dash)

# ── Candlestick wicks ────────────────────────────────────────────────────────
wick_xs = Float64[]
wick_ys = Float64[]
for i in 1:n
    append!(wick_xs, [xs[i], xs[i]])
    append!(wick_ys, [low_px[i], high_px[i]])
end
linesegments!(ax, wick_xs, wick_ys;
    color     = RGBAf(INK.r, INK.g, INK.b, 0.55),
    linewidth = 0.7,
)

# ── Candlestick bodies ───────────────────────────────────────────────────────
# Semantic colours: up=green (#009E73), down=red (#AE3030)
bw     = 0.55
min_ht = 0.05
up_idx = findall(close_px .>= open_px)
dn_idx = findall(close_px .<  open_px)

up_rects = [Rect2f(xs[i] - bw / 2, min(open_px[i], close_px[i]),
                   bw, max(min_ht, abs(close_px[i] - open_px[i]))) for i in up_idx]
dn_rects = [Rect2f(xs[i] - bw / 2, min(open_px[i], close_px[i]),
                   bw, max(min_ht, abs(close_px[i] - open_px[i]))) for i in dn_idx]

isempty(up_rects) || poly!(ax, up_rects; color = (IMPRINT_PALETTE[1], 0.85))
isempty(dn_rects) || poly!(ax, dn_rects; color = (IMPRINT_PALETTE[5], 0.85))

# ── Ichimoku indicator lines ─────────────────────────────────────────────────
lines!(ax, xs, tenkan; color = IMPRINT_PALETTE[2], linewidth = 1.8)
lines!(ax, xs, kijun;  color = IMPRINT_PALETTE[3], linewidth = 1.8)
lines!(ax, chikou_x, chikou_y; color = IMPRINT_PALETTE[4], linewidth = 1.5, linestyle = :dot)

# ── Data storytelling: mark trend reversal at period 120 ────────────────────
y_hi = maximum(filter(isfinite, high_px))
y_lo = minimum(filter(isfinite, low_px))
vlines!(ax, [trans_x]; color = RGBAf(INK.r, INK.g, INK.b, 0.25), linewidth = 1.2, linestyle = :dash)
text!(ax, [trans_x + 1.5], [y_lo + (y_hi - y_lo) * 0.90];
    text = ["Trend reversal"], color = INK_SOFT, fontsize = 9, align = (:left, :top))

# ── Legend ───────────────────────────────────────────────────────────────────
legend_elems = [
    LineElement(color = IMPRINT_PALETTE[2], linewidth = 2.5),
    LineElement(color = IMPRINT_PALETTE[3], linewidth = 2.5),
    LineElement(color = IMPRINT_PALETTE[4], linewidth = 2.5, linestyle = :dot),
    PolyElement(color = (colorant"#009E73", 0.45)),
    PolyElement(color = (colorant"#AE3030", 0.45)),
]
legend_labels = [
    "Tenkan-sen (9)",
    "Kijun-sen (26)",
    "Chikou Span (−26)",
    "Kumo Bullish",
    "Kumo Bearish",
]

Legend(fig[1, 2], legend_elems, legend_labels;
    framevisible    = false,
    labelcolor      = INK,
    backgroundcolor = PAGE_BG,
    patchsize       = (28, 12),
    labelsize       = 11,
)

colsize!(fig.layout, 1, Relative(0.82))

# Save
save("plot-$(THEME).png", fig; px_per_unit = 2)
Runnable source as JSON, for any HTTP client: https://api.anyplot.ai/specs/indicator-ichimoku/makie/code. Any spec id and library id listed in llms-full.txt fit the same URL shape; every URL below is complete and callable.
{
  "spec_id": "indicator-ichimoku",
  "language": "julia",
  "library": "makie",
  "page": "https://anyplot.ai/indicator-ichimoku/julia/makie",
  "hub": "https://anyplot.ai/indicator-ichimoku",
  "code_json": "https://api.anyplot.ai/specs/indicator-ichimoku/makie/code",
  "spec_json": "https://api.anyplot.ai/specs/indicator-ichimoku",
  "render_light_png": "https://storage.googleapis.com/anyplot-images/plots/indicator-ichimoku/julia/makie/plot-light.png",
  "render_dark_png": "https://storage.googleapis.com/anyplot-images/plots/indicator-ichimoku/julia/makie/plot-dark.png",
  "quality_score": 87.0,
  "license": "MIT",
  "guide": "https://anyplot.ai/llms.txt"
}
Part of Ichimoku Cloud Technical Indicator Chart on anyplot.ai.