The same plot in 14 other libraries — JavaScript: Chart.js, D3.js, Highcharts, MUI X Charts; Python: Altair, Bokeh, lets-plot, Matplotlib, Plotly, plotnine, Pygal, Seaborn; R: ggplot2; Julia: Makie.jl. Compare all 15 side by side: Ichimoku Cloud Technical Indicator Chart in Python, R, Julia and JavaScript.
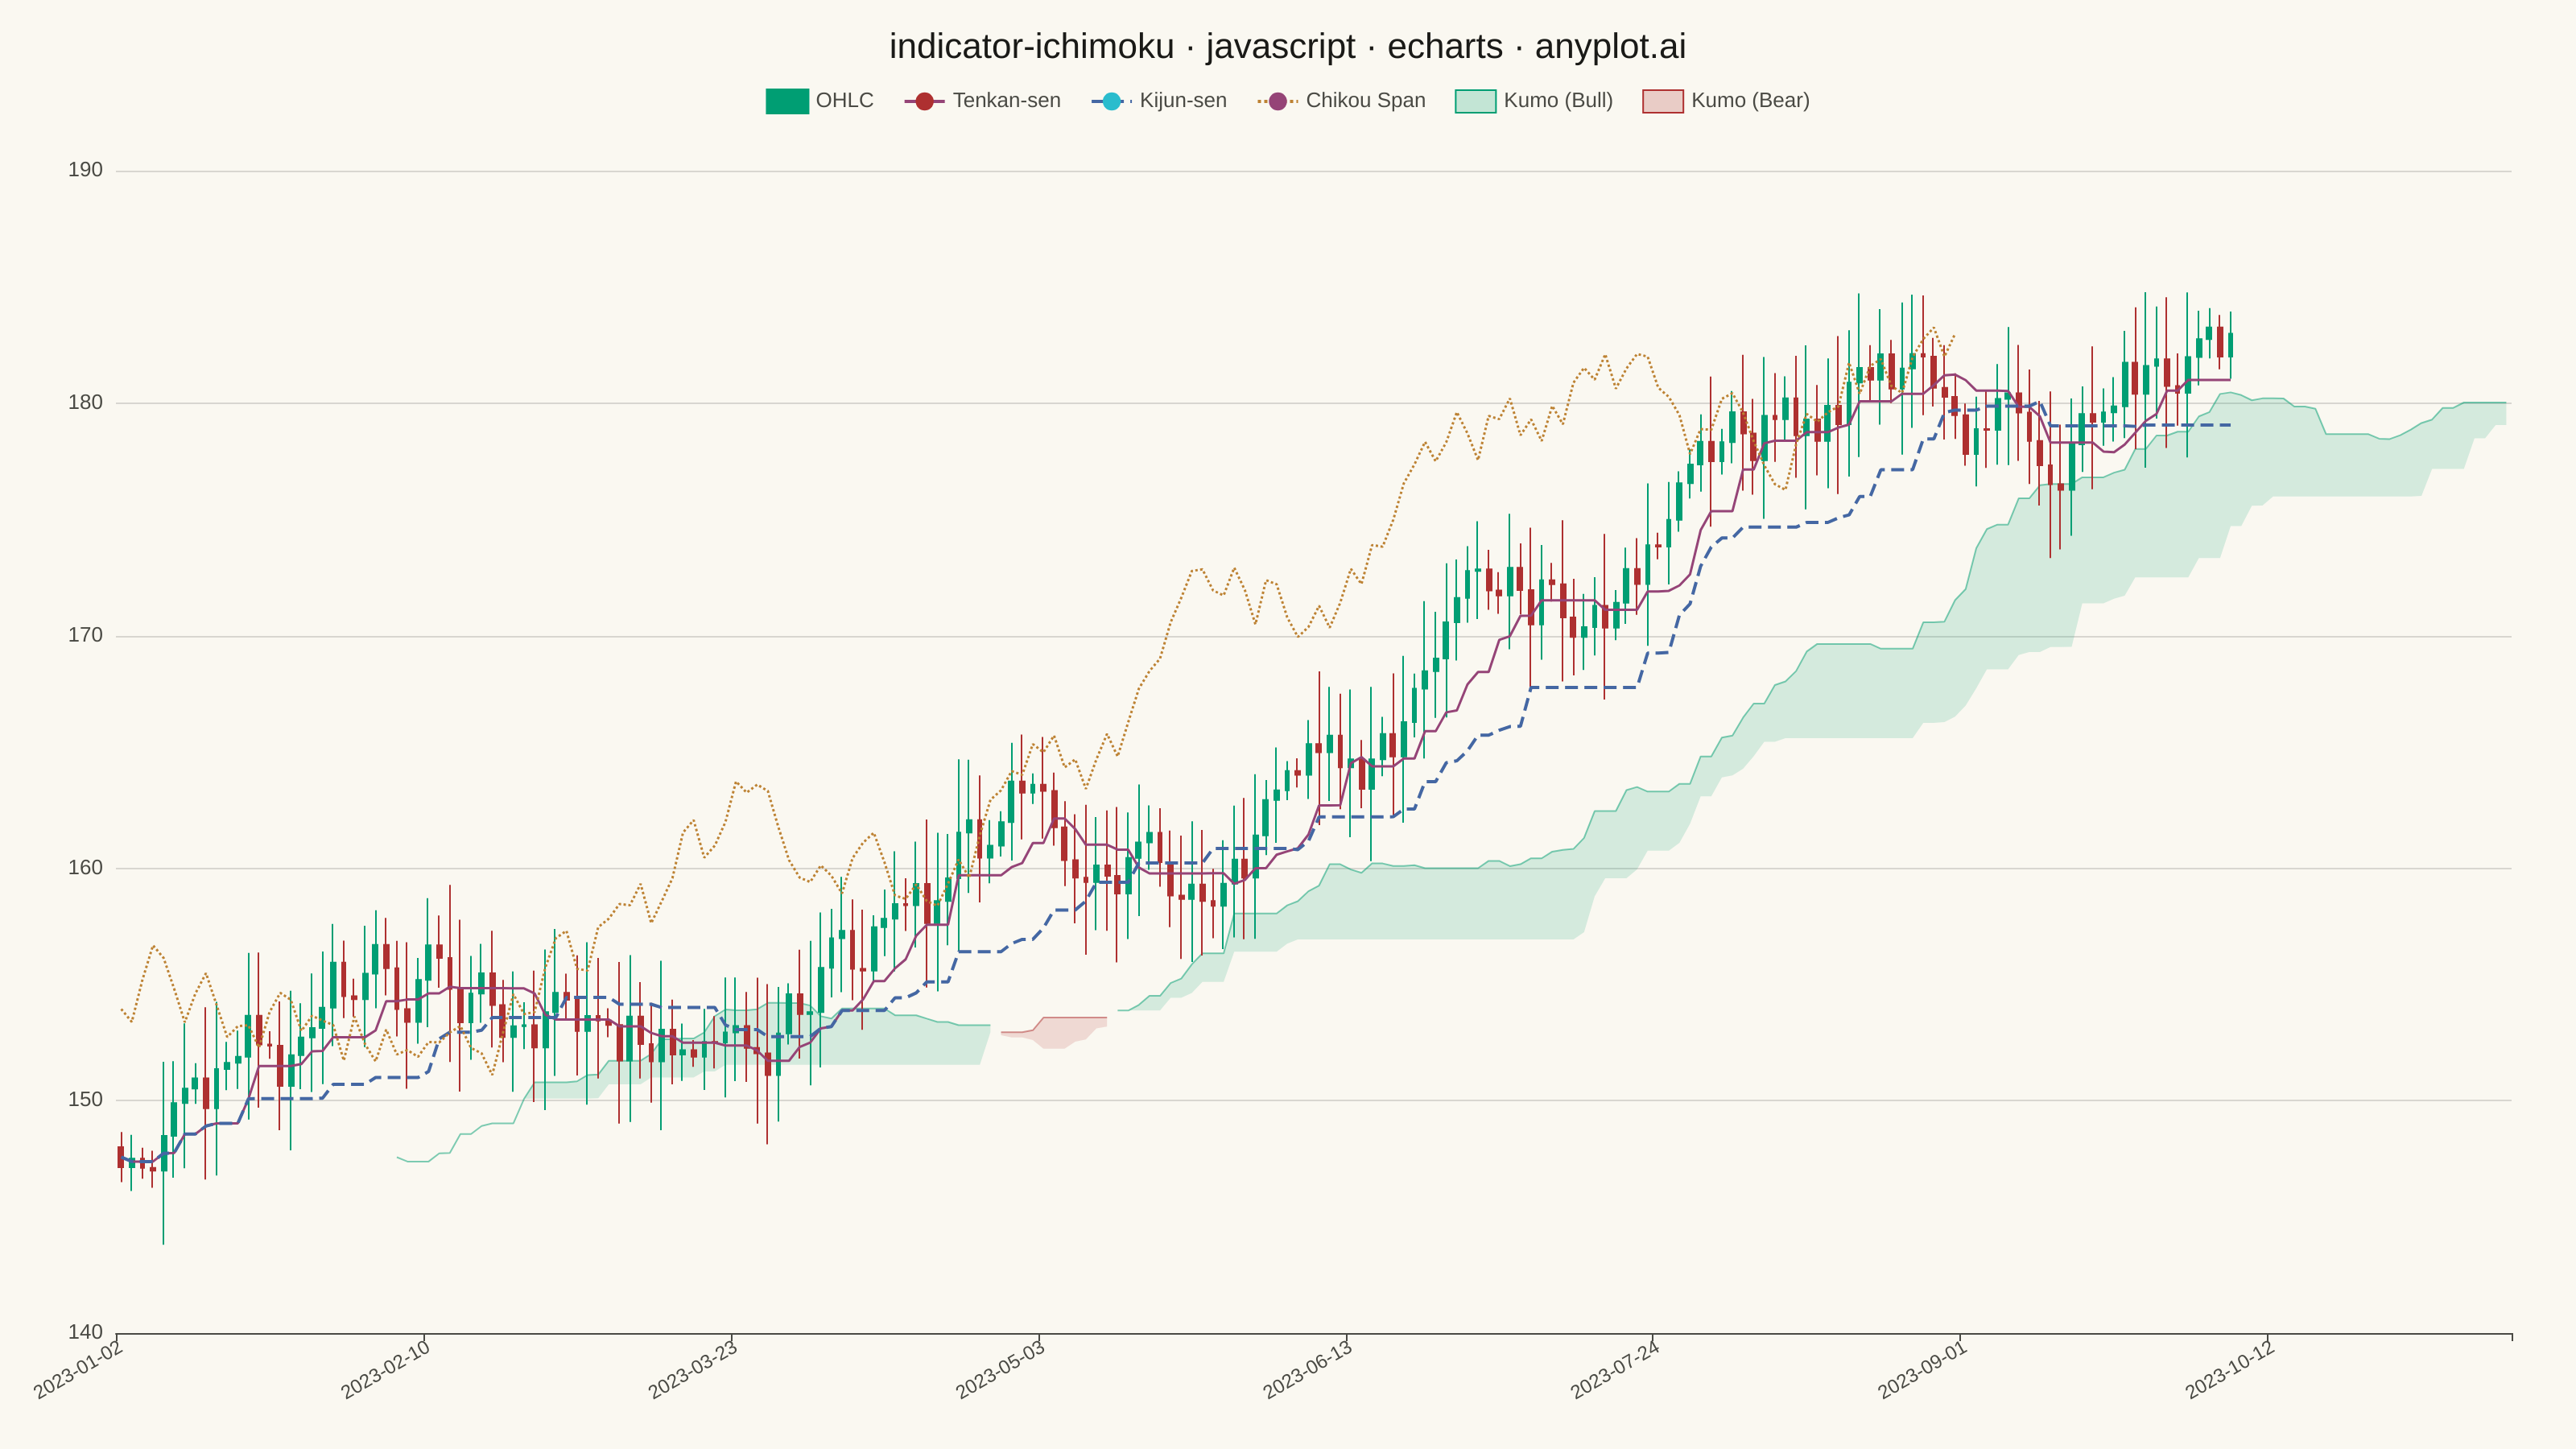
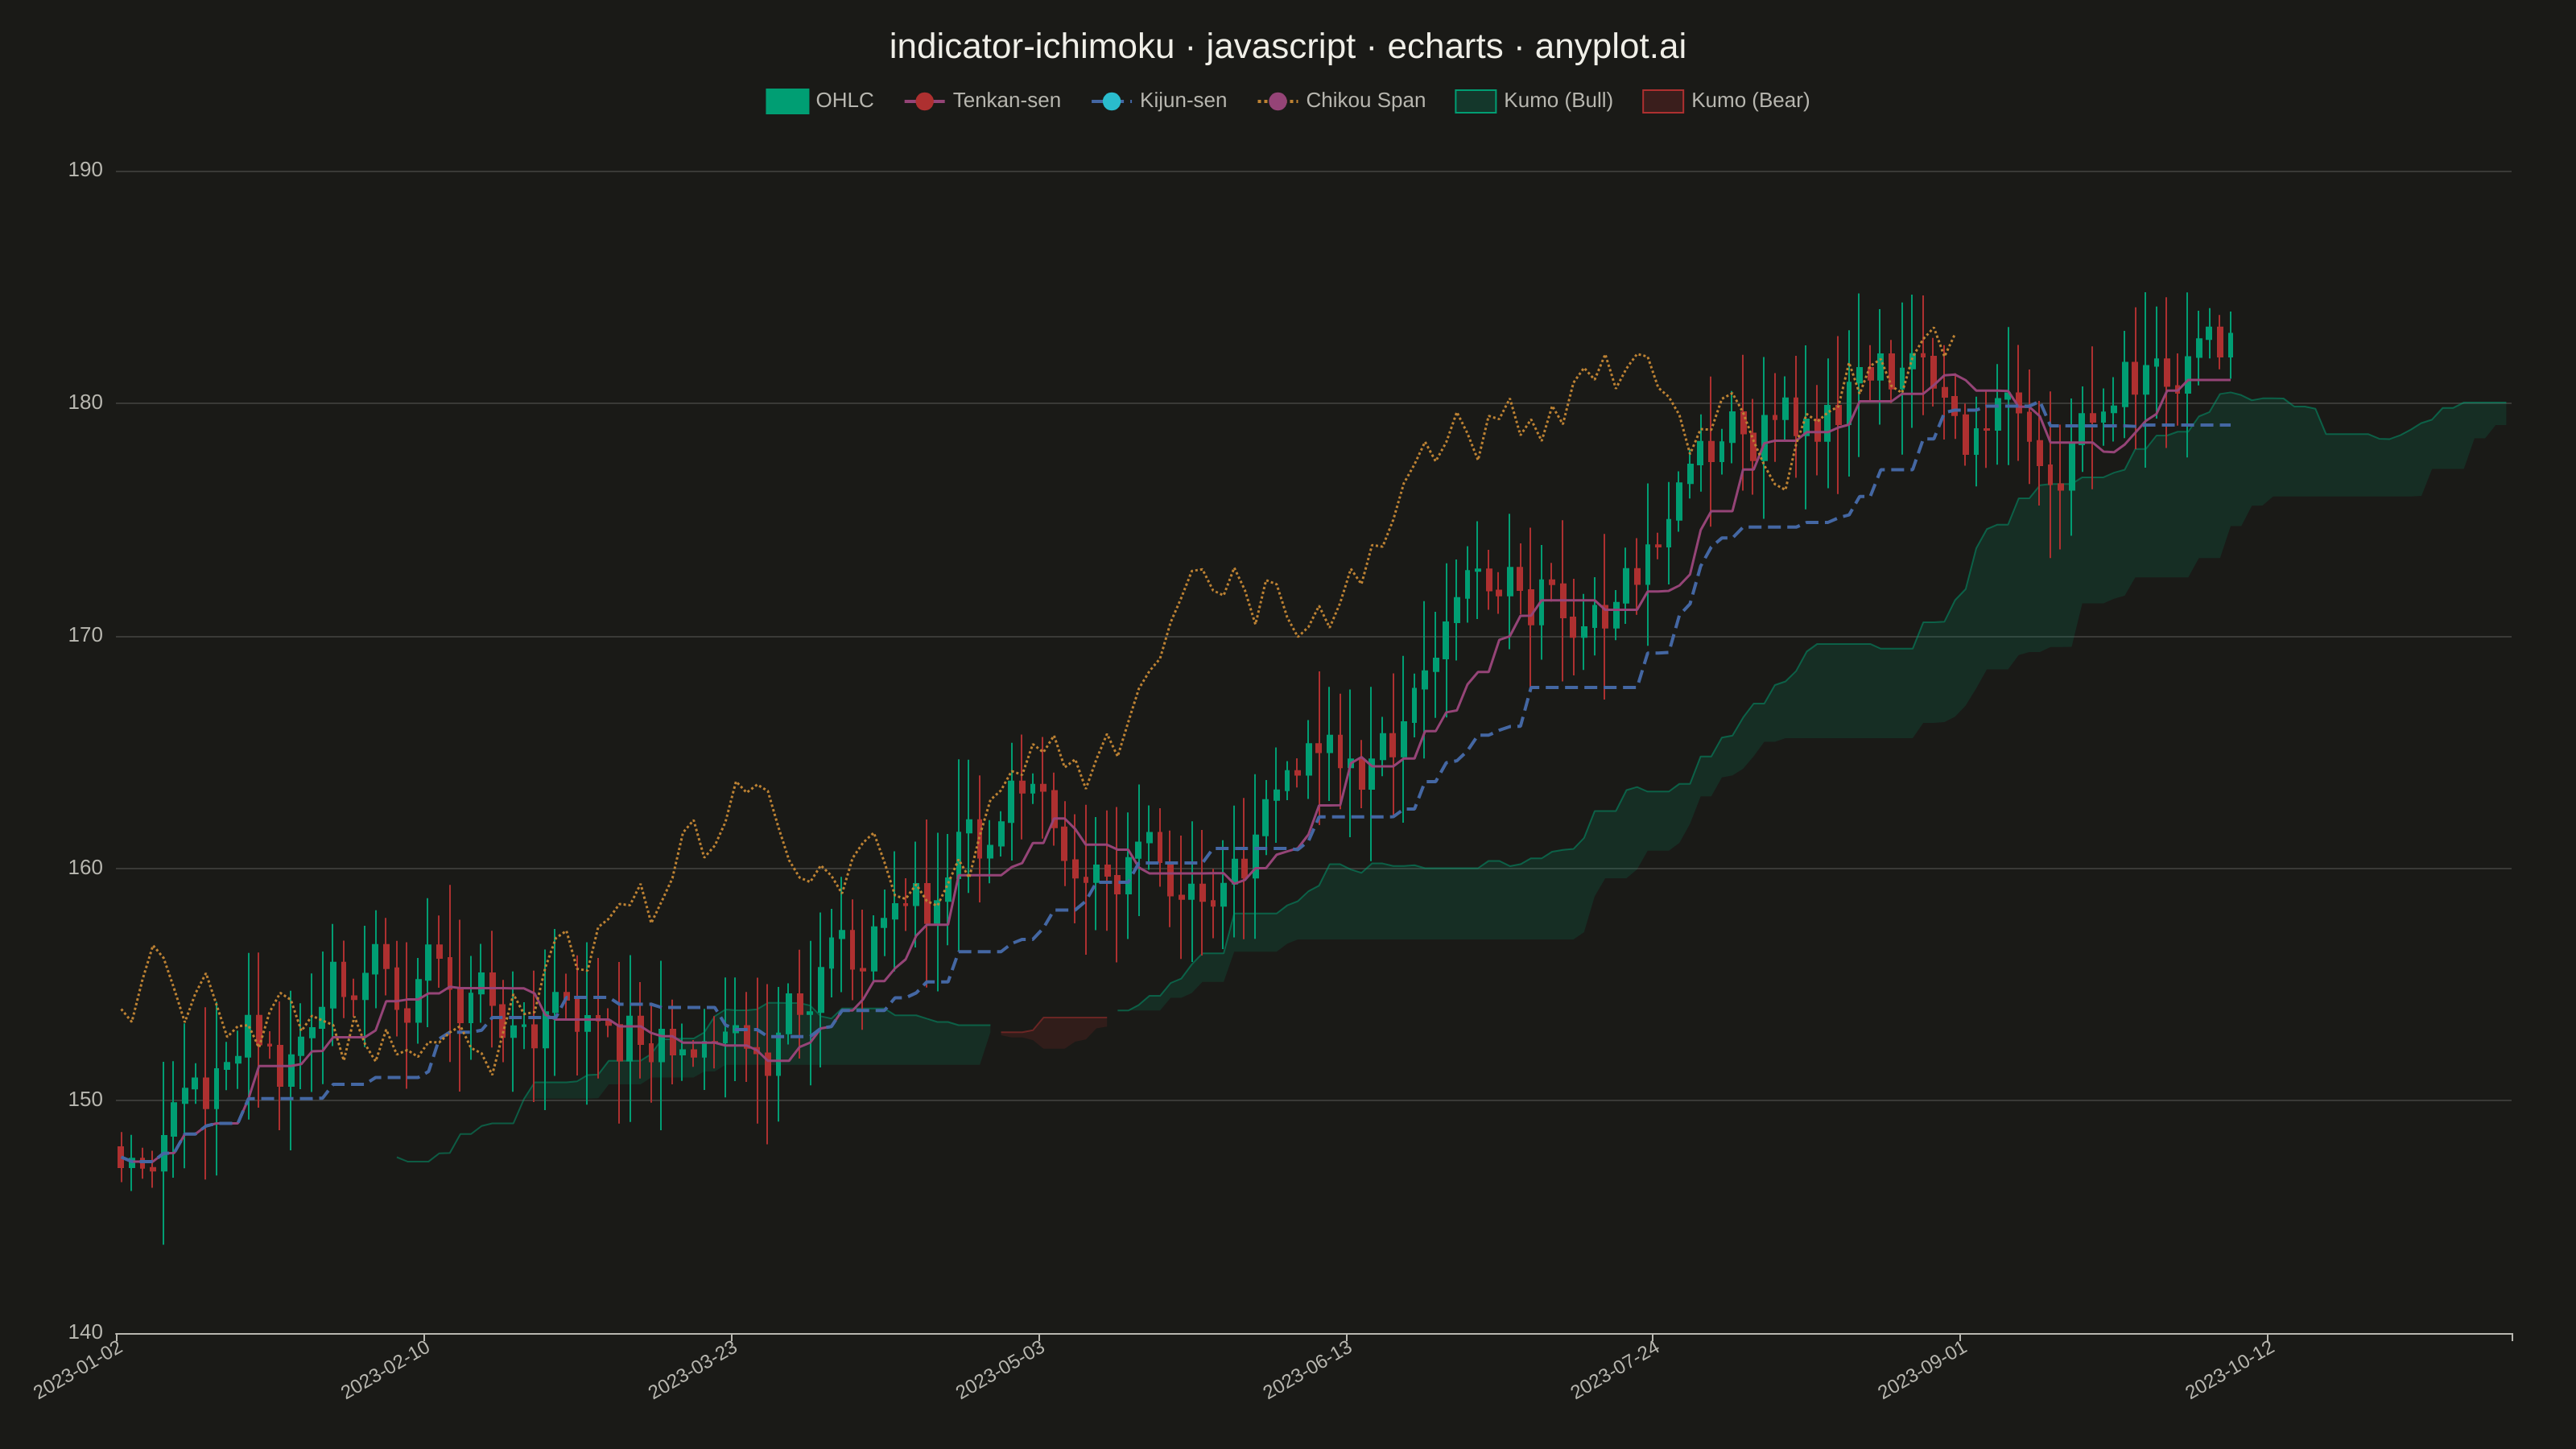
Displays the Ichimoku Kinko Hyo ("one glance equilibrium chart") overlay on a candlestick price chart. The indicator plots five lines — Tenkan-sen (conversion), Kijun-sen (base), Senkou Span A, Senkou Span B, and Chikou Span (lagging) — with the area between Senkou Span A and B filled as the "Kumo" (cloud). The cloud color changes depending on which span is on top, providing an at-a-glance view of trend direction, momentum, and support/resistance zones.
// anyplot.ai
// indicator-ichimoku: Ichimoku Cloud Technical Indicator Chart
// Library: echarts 5.5.1 | JavaScript 22.22.3
// Quality: 87/100 | Created: 2026-06-08

const t = window.ANYPLOT_TOKENS;

// --- Data (in-memory, deterministic) ----------------------------------------
// Tiny LCG for reproducible pseudo-random price generation (no seeded RNG in browser)
function lcg(seed) {
  let s = seed >>> 0;
  return () => { s = (Math.imul(1664525, s) + 1013904223) >>> 0; return s / 0xffffffff; };
}
const rng = lcg(42);

// Generate ~200 trading days of OHLC data
const N = 200;
const dates = [];
const opens = [], highs = [], lows = [], closes = [];

let price = 148.0;
const startDate = new Date(2023, 0, 2);
let dayIdx = 0;

while (dates.length < N) {
  const d = new Date(startDate);
  d.setDate(startDate.getDate() + dayIdx);
  dayIdx++;
  if (d.getDay() === 0 || d.getDay() === 6) continue;
  const dateStr = d.toISOString().slice(0, 10);
  const change = (rng() - 0.48) * 3.8;
  const open  = price;
  const close = Math.max(80, Math.min(300, open + change));
  const wick  = rng() * 2.8 + 0.4;
  const high  = Math.max(open, close) + wick;
  const low   = Math.min(open, close) - wick;
  dates.push(dateStr);
  opens.push(open);
  highs.push(high);
  lows.push(low);
  closes.push(close);
  price = close;
}

// Compute Ichimoku components (standard 9/26/52 parameters)
function periodHL(hiArr, loArr, i, period) {
  const start = Math.max(0, i - period + 1);
  let hi = -Infinity, lo = Infinity;
  for (let j = start; j <= i; j++) { hi = Math.max(hi, hiArr[j]); lo = Math.min(lo, loArr[j]); }
  return { hi, lo };
}

const tenkan = [], kijun = [], spanA = [], spanB = [];
for (let i = 0; i < N; i++) {
  const r9  = periodHL(highs, lows, i, 9);
  const r26 = periodHL(highs, lows, i, 26);
  const r52 = periodHL(highs, lows, i, 52);
  tenkan.push((r9.hi + r9.lo) / 2);
  kijun.push((r26.hi + r26.lo) / 2);
  spanA.push((tenkan[i] + kijun[i]) / 2);
  spanB.push((r52.hi + r52.lo) / 2);
}

// Build date axis: N history days + 26 projected days for cloud displacement
const futureDates = [];
let lastDay = new Date(dates[N - 1]);
let added = 0;
while (added < 26) {
  lastDay.setDate(lastDay.getDate() + 1);
  if (lastDay.getDay() !== 0 && lastDay.getDay() !== 6) {
    futureDates.push(lastDay.toISOString().slice(0, 10));
    added++;
  }
}
const allDates = [...dates, ...futureDates]; // length = N + 26

// Cloud fill: differential stacking so fill is ONLY between SpanA and SpanB
// -- Bullish band (SpanA >= SpanB): base = SpanB, fill = SpanA - SpanB (green)
// -- Bearish band (SpanB >  SpanA): base = SpanA, fill = SpanB - SpanA (red)
// Each series carries null for the other state so the fill breaks at transitions.
const cloudBaseBull = [], cloudFillBull = [];
const cloudBaseBear = [], cloudFillBear = [];
for (let i = 0; i < N; i++) {
  const xi = i + 26; // displaced 26 periods forward
  const vA = spanA[i], vB = spanB[i];
  if (vA >= vB) {
    cloudBaseBull.push([xi, vB]);
    cloudFillBull.push([xi, vA - vB]);
    cloudBaseBear.push([xi, null]);
    cloudFillBear.push([xi, null]);
  } else {
    cloudBaseBull.push([xi, null]);
    cloudFillBull.push([xi, null]);
    cloudBaseBear.push([xi, vA]);
    cloudFillBear.push([xi, vB - vA]);
  }
}

// Lines shifted to their correct positions
const tenkanData = tenkan.map((v, i) => [i, v]);
const kijunData  = kijun.map((v, i) => [i, v]);
// Chikou span: close plotted 26 periods in the past (index i - 26, skip first 26)
const chikouData = closes.map((v, i) => [i - 26, v]).filter(d => d[0] >= 0);

// --- Colors -----------------------------------------------------------------
const BULL_GREEN   = t.palette[0]; // #009E73 — up candles, bullish cloud
const BEAR_RED     = t.palette[4]; // #AE3030 — down candles, bearish cloud
const TENKAN_COLOR = t.palette[6]; // #954477 rose
const KIJUN_COLOR  = t.palette[2]; // #4467A3 blue
const CHIKOU_COLOR = t.palette[3]; // #BD8233 ochre
const CLOUD_BULL_FILL = "rgba(0,158,115,0.22)";
const CLOUD_BEAR_FILL = "rgba(174,48,48,0.22)";
const TRANSPARENT  = "rgba(0,0,0,0)";

// Title fontsize scaling
const titleText = "indicator-ichimoku · javascript · echarts · anyplot.ai";
const titleFs   = Math.max(14, Math.round(22 * Math.min(1, 67 / titleText.length)));

// --- Init -------------------------------------------------------------------
const chart = echarts.init(document.getElementById("container"));

// --- Option -----------------------------------------------------------------
chart.setOption({
  animation: false,
  color: t.palette,
  backgroundColor: t.pageBg,

  title: {
    text: titleText,
    left: "center",
    top: 14,
    textStyle: { color: t.ink, fontSize: titleFs, fontWeight: "500" }
  },

  legend: {
    top: 50,
    left: "center",
    itemGap: 18,
    textStyle: { color: t.inkSoft, fontSize: 13 },
    data: [
      { name: "OHLC", icon: "rect" },
      { name: "Tenkan-sen" },
      { name: "Kijun-sen" },
      { name: "Chikou Span" },
      { name: "Kumo (Bull)", icon: "rect", itemStyle: { color: CLOUD_BULL_FILL, borderColor: BULL_GREEN, borderWidth: 1 } },
      { name: "Kumo (Bear)", icon: "rect", itemStyle: { color: CLOUD_BEAR_FILL, borderColor: BEAR_RED, borderWidth: 1 } }
    ]
  },

  grid: { left: 72, right: 40, top: 106, bottom: 72 },

  xAxis: {
    type: "category",
    data: allDates,
    boundaryGap: true,
    axisLabel: {
      color: t.inkSoft,
      fontSize: 12,
      rotate: 30,
      interval: Math.floor(allDates.length / 8)
    },
    axisLine: { lineStyle: { color: t.inkSoft } },
    splitLine: { show: false }
  },

  yAxis: {
    scale: true,
    axisLabel: { color: t.inkSoft, fontSize: 13 },
    axisLine: { lineStyle: { color: t.inkSoft } },
    splitLine: { lineStyle: { color: t.grid } }
  },

  series: [
    // ── Cloud fill: differential stacking (base transparent, diff colored) ──
    // Bullish base — transparent fill from axis to SpanB; breaks where null
    {
      name: "_cb_base",
      type: "line", symbol: "none", silent: true, z: 1,
      data: cloudBaseBull,
      connectNulls: false,
      stack: "cloud_bull",
      lineStyle: { opacity: 0, width: 0 },
      areaStyle: { color: TRANSPARENT, origin: "auto" }
    },
    // Bullish fill — SpanA - SpanB stacked on top of SpanB → fills cloud band
    {
      name: "Kumo (Bull)",
      type: "line", symbol: "none", silent: true, z: 1,
      data: cloudFillBull,
      connectNulls: false,
      stack: "cloud_bull",
      lineStyle: { color: BULL_GREEN, opacity: 0.5, width: 1 },
      areaStyle: { color: CLOUD_BULL_FILL, origin: "auto" }
    },
    // Bearish base — transparent fill from axis to SpanA
    {
      name: "_cb_base2",
      type: "line", symbol: "none", silent: true, z: 1,
      data: cloudBaseBear,
      connectNulls: false,
      stack: "cloud_bear",
      lineStyle: { opacity: 0, width: 0 },
      areaStyle: { color: TRANSPARENT, origin: "auto" }
    },
    // Bearish fill — SpanB - SpanA stacked on SpanA → fills cloud band
    {
      name: "Kumo (Bear)",
      type: "line", symbol: "none", silent: true, z: 1,
      data: cloudFillBear,
      connectNulls: false,
      stack: "cloud_bear",
      lineStyle: { color: BEAR_RED, opacity: 0.5, width: 1 },
      areaStyle: { color: CLOUD_BEAR_FILL, origin: "auto" }
    },
    // ── OHLC Candlesticks ──────────────────────────────────────────────────
    {
      name: "OHLC",
      type: "candlestick",
      z: 3,
      data: dates.map((_, i) => [opens[i], closes[i], lows[i], highs[i]]),
      itemStyle: {
        color: BULL_GREEN,
        color0: BEAR_RED,
        borderColor: BULL_GREEN,
        borderColor0: BEAR_RED,
        borderWidth: 1
      }
    },
    // ── Ichimoku lines ─────────────────────────────────────────────────────
    {
      name: "Tenkan-sen",
      type: "line", symbol: "none", z: 4,
      data: tenkanData,
      lineStyle: { color: TENKAN_COLOR, width: 1.5 }
    },
    {
      name: "Kijun-sen",
      type: "line", symbol: "none", z: 4,
      data: kijunData,
      lineStyle: { color: KIJUN_COLOR, width: 2, type: "dashed" }
    },
    {
      name: "Chikou Span",
      type: "line", symbol: "none", z: 4,
      data: chikouData,
      lineStyle: { color: CHIKOU_COLOR, width: 1.5, type: "dotted" }
    }
  ]
});
Runnable source as JSON, for any HTTP client: https://api.anyplot.ai/specs/indicator-ichimoku/echarts/code. Any spec id and library id listed in llms-full.txt fit the same URL shape; every URL below is complete and callable.
{
  "spec_id": "indicator-ichimoku",
  "language": "javascript",
  "library": "echarts",
  "page": "https://anyplot.ai/indicator-ichimoku/javascript/echarts",
  "hub": "https://anyplot.ai/indicator-ichimoku",
  "code_json": "https://api.anyplot.ai/specs/indicator-ichimoku/echarts/code",
  "spec_json": "https://api.anyplot.ai/specs/indicator-ichimoku",
  "render_light_png": "https://storage.googleapis.com/anyplot-images/plots/indicator-ichimoku/javascript/echarts/plot-light.png",
  "render_dark_png": "https://storage.googleapis.com/anyplot-images/plots/indicator-ichimoku/javascript/echarts/plot-dark.png",
  "interactive_light_html": "https://storage.googleapis.com/anyplot-images/plots/indicator-ichimoku/javascript/echarts/plot-light.html",
  "interactive_dark_html": "https://storage.googleapis.com/anyplot-images/plots/indicator-ichimoku/javascript/echarts/plot-dark.html",
  "quality_score": 87.0,
  "license": "MIT",
  "guide": "https://anyplot.ai/llms.txt"
}
Part of Ichimoku Cloud Technical Indicator Chart on anyplot.ai.