The same plot in 14 other libraries — JavaScript: Chart.js, Apache ECharts, Highcharts, MUI X Charts; Python: Altair, Bokeh, lets-plot, Matplotlib, Plotly, plotnine, Pygal, Seaborn; R: ggplot2; Julia: Makie.jl. Compare all 15 side by side: Ichimoku Cloud Technical Indicator Chart in Python, R, Julia and JavaScript.
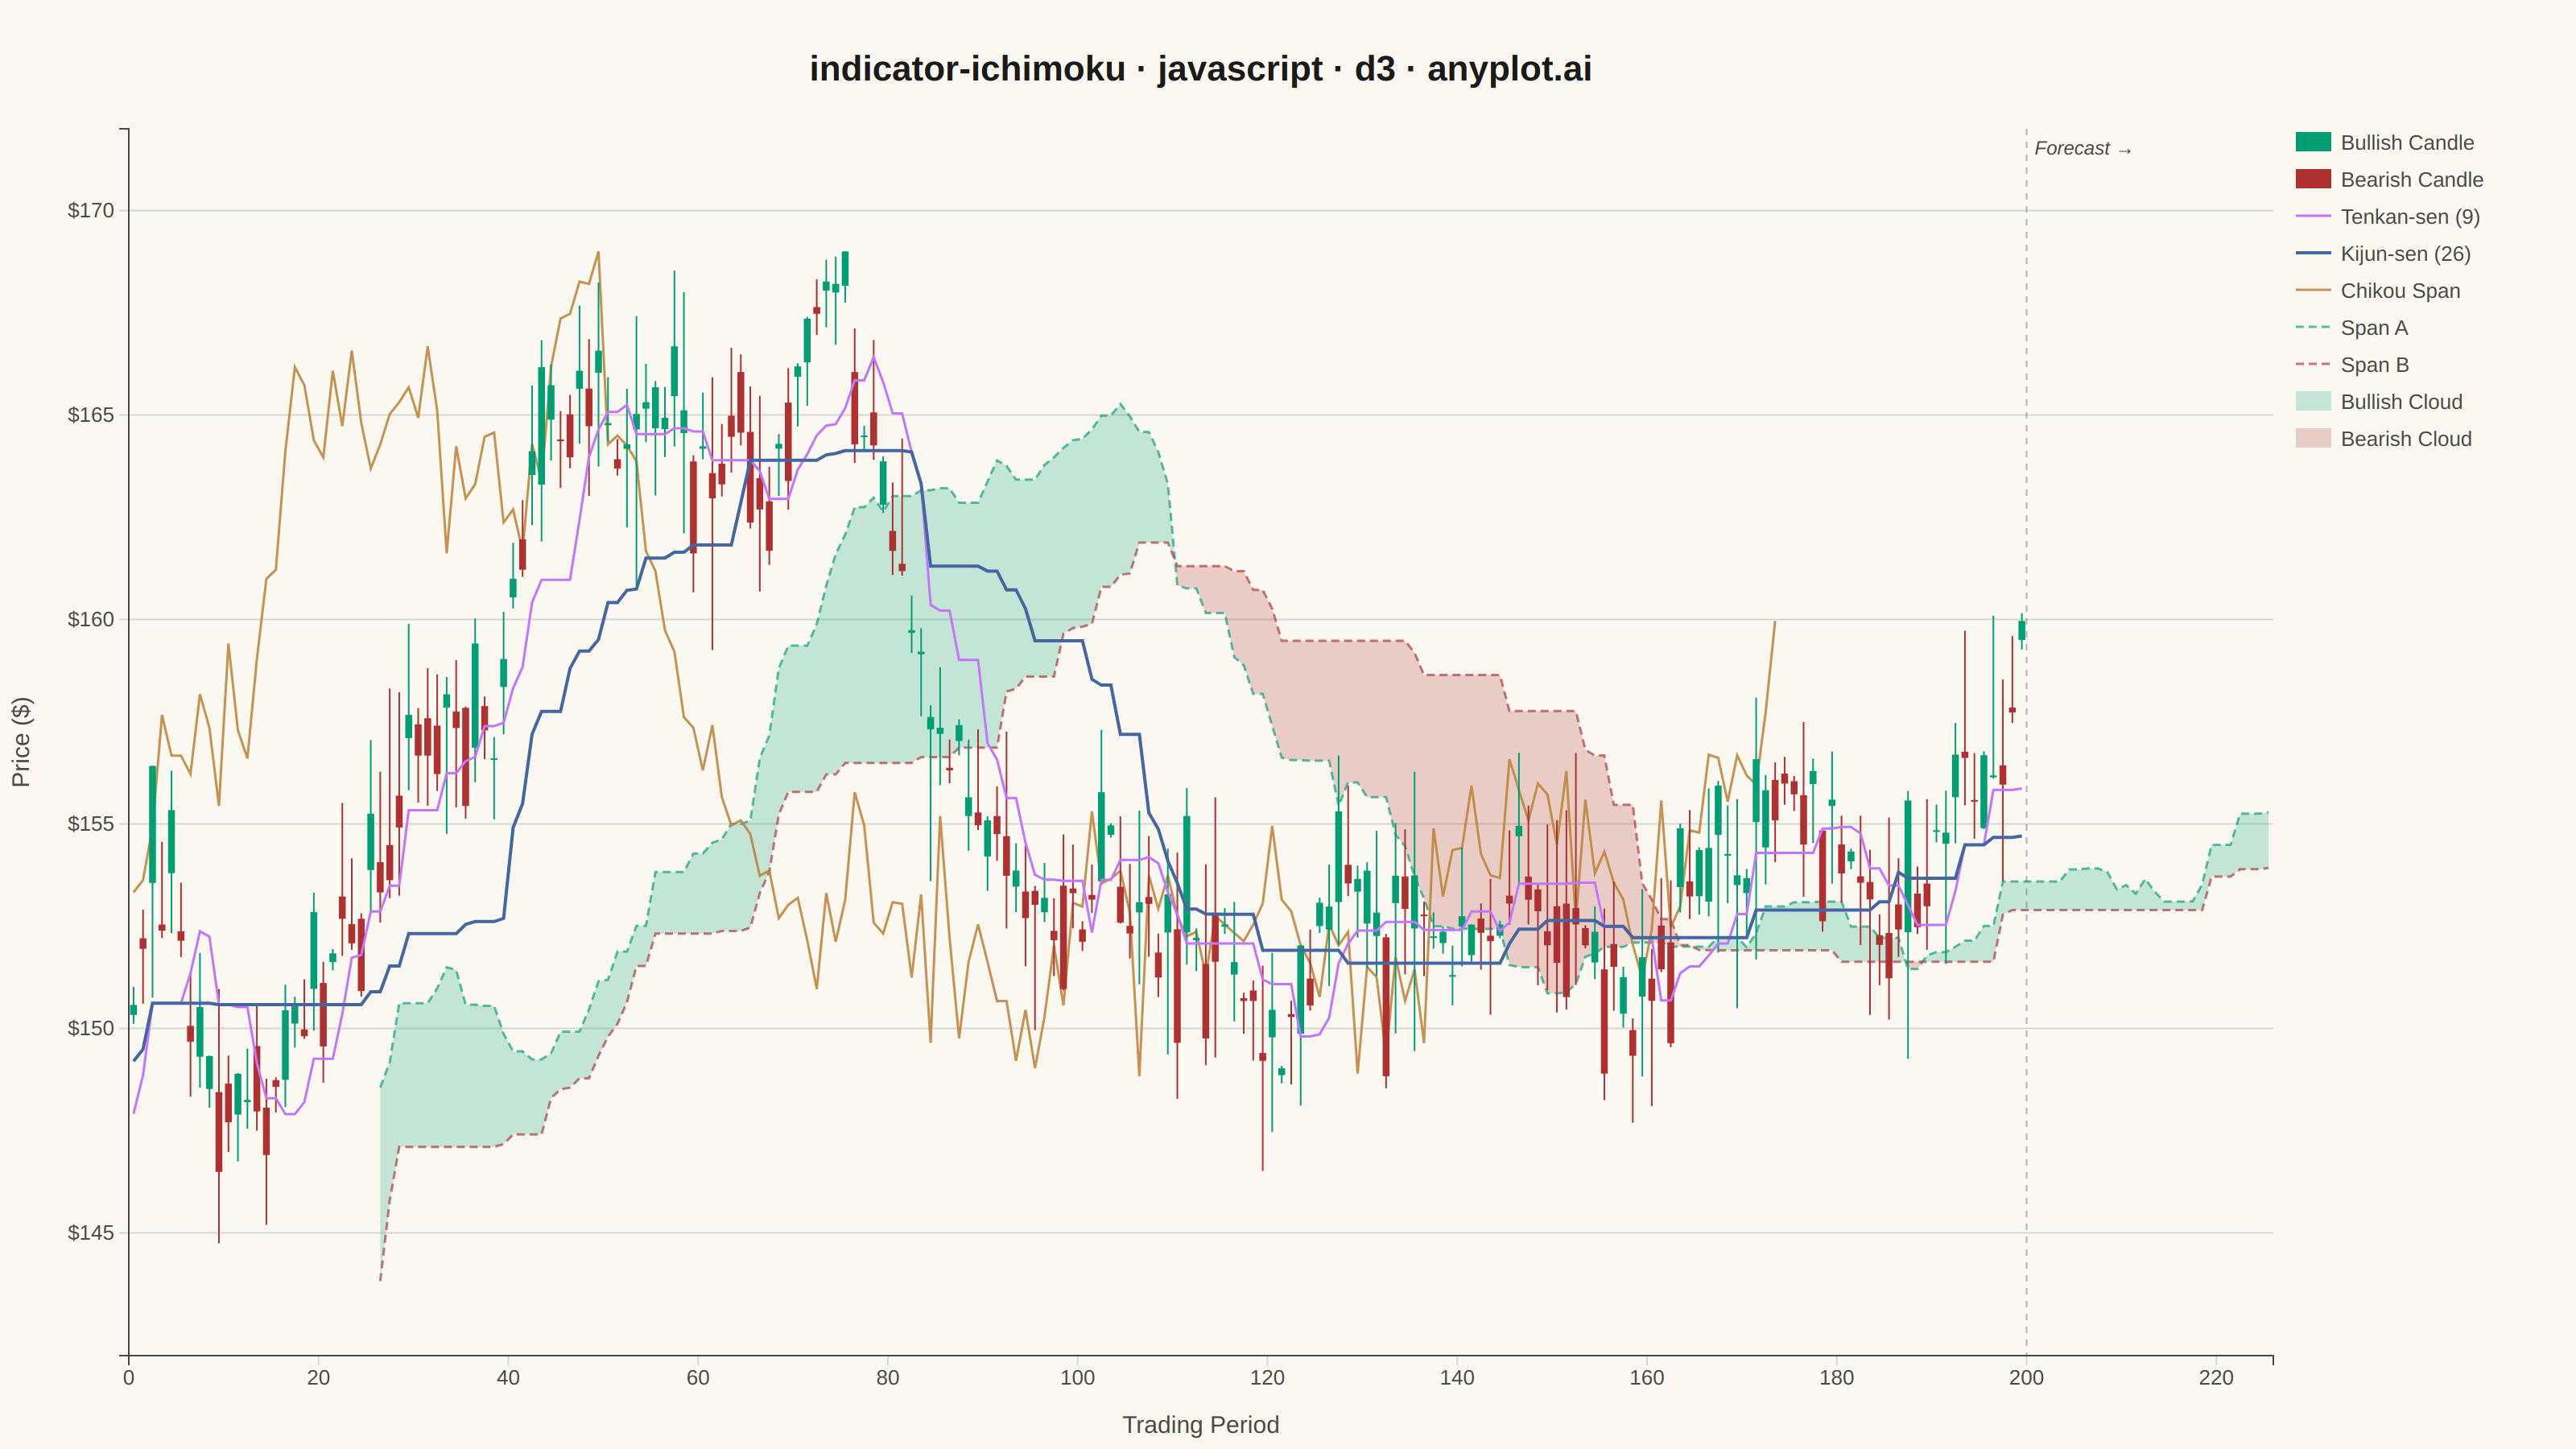
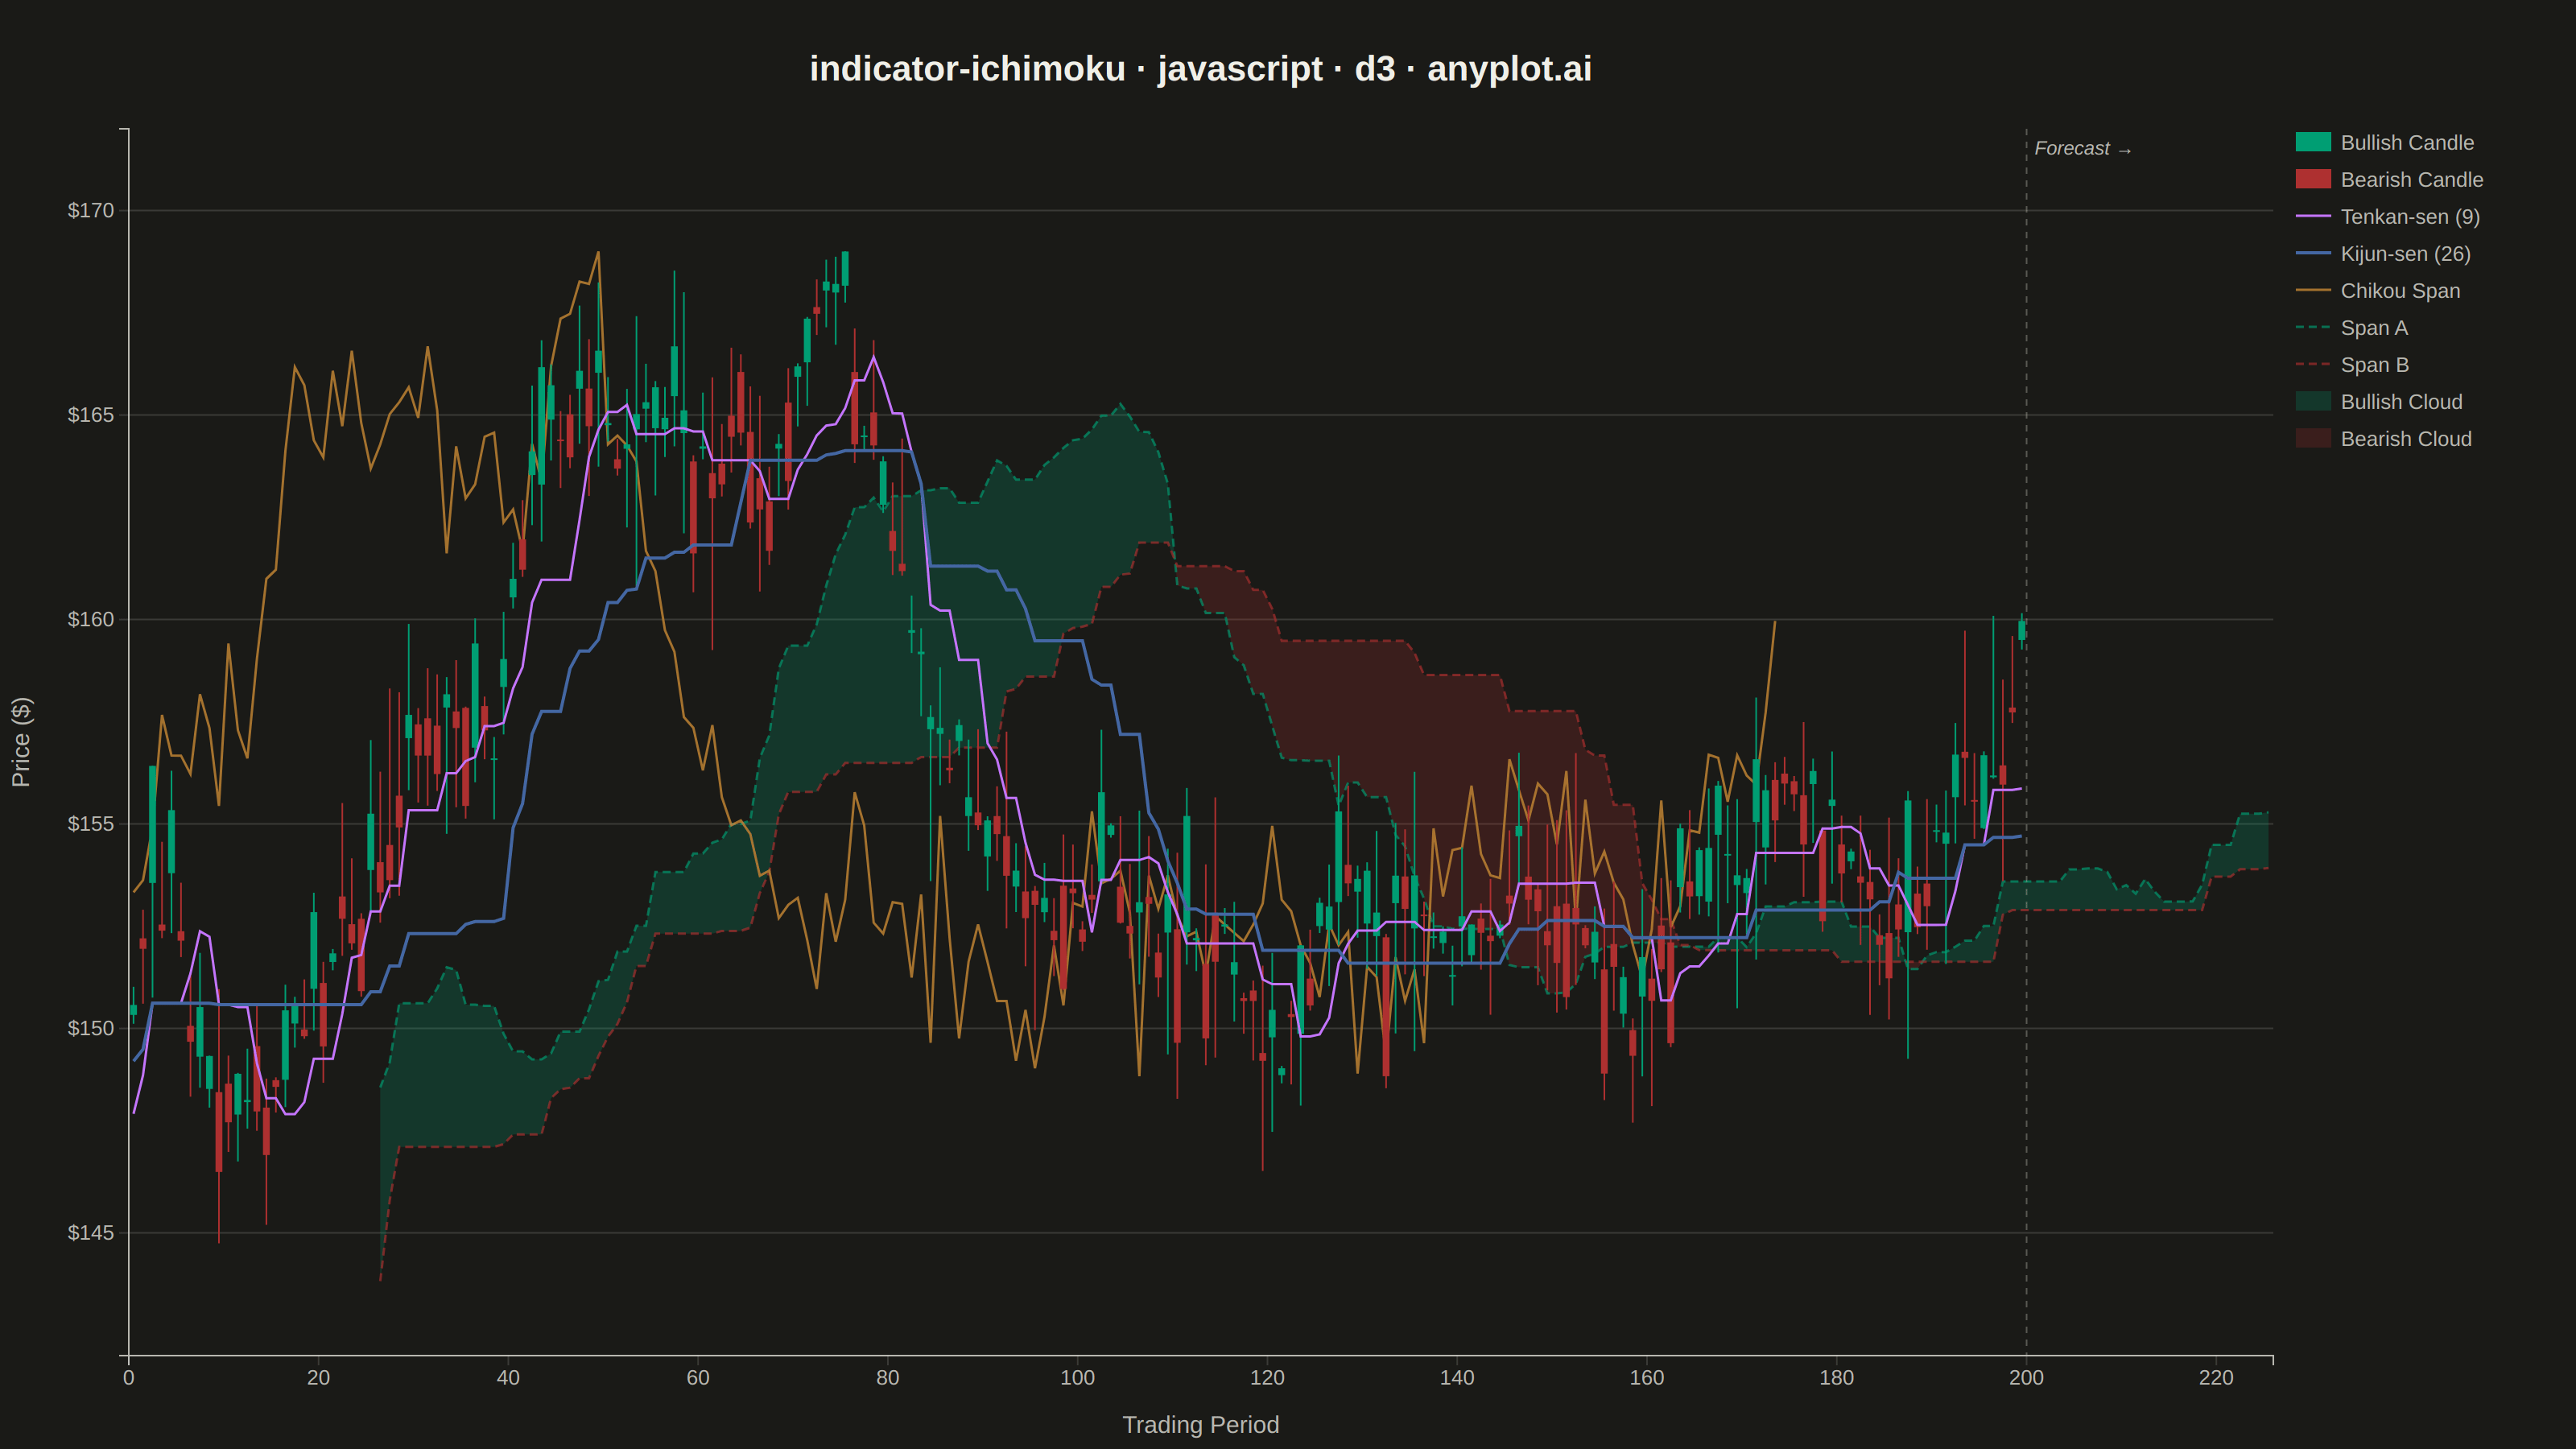
Displays the Ichimoku Kinko Hyo ("one glance equilibrium chart") overlay on a candlestick price chart. The indicator plots five lines — Tenkan-sen (conversion), Kijun-sen (base), Senkou Span A, Senkou Span B, and Chikou Span (lagging) — with the area between Senkou Span A and B filled as the "Kumo" (cloud). The cloud color changes depending on which span is on top, providing an at-a-glance view of trend direction, momentum, and support/resistance zones.
// anyplot.ai
// indicator-ichimoku: Ichimoku Cloud Technical Indicator Chart
// Library: d3 7.9.0 | JavaScript 22.22.3
// Quality: 91/100 | Created: 2026-06-08

const t = window.ANYPLOT_TOKENS;
const { width, height } = window.ANYPLOT_SIZE;

const margin = { top: 80, right: 188, bottom: 58, left: 80 };
const iw = width - margin.left - margin.right;
const ih = height - margin.top - margin.bottom;

// Imprint palette — semantic color choices for financial data
const BULL   = "#009E73";  // Imprint pos 1, bullish / up candles
const BEAR   = "#AE3030";  // Imprint semantic red, bearish / down candles
const TENKAN = "#C475FD";  // Imprint pos 2, Tenkan-sen (conversion line)
const KIJUN  = "#4467A3";  // Imprint pos 3, Kijun-sen (base line)
const CHIKOU = "#BD8233";  // Imprint pos 4, Chikou Span (lagging)

// Deterministic LCG — no seeded RNG in the browser
let seed = 42;
function lcg() {
    seed = (seed * 1664525 + 1013904223) >>> 0;
    return seed / 0x100000000;
}

// Generate 252 raw OHLC periods (200 display + 52 lookback for Span B)
const N_RAW = 252, N_DISPLAY = 200, LOOKBACK = 52;
let price = 140;
let drift = 0;
const raw = [];
for (let i = 0; i < N_RAW; i++) {
    drift = drift * 0.93 + (lcg() - 0.5) * 1.3;
    price = Math.max(85, price + drift + (lcg() - 0.5) * 3);
    const spread = 1 + lcg() * 3.5;
    const o = price;
    const h = o + lcg() * spread;
    const l = o - lcg() * spread;
    const c = l + lcg() * (h - l);
    raw.push({ o, h, l, c });
}

// Period high / low helpers
function pHigh(arr, end, n) {
    let m = -Infinity;
    for (let j = Math.max(0, end - n + 1); j <= end; j++) if (arr[j].h > m) m = arr[j].h;
    return m;
}
function pLow(arr, end, n) {
    let m = Infinity;
    for (let j = Math.max(0, end - n + 1); j <= end; j++) if (arr[j].l < m) m = arr[j].l;
    return m;
}

// Build display data and Ichimoku components
const candles = [], tenkanLine = [], kijunLine = [], cloudPts = [], chikou = [];

for (let di = 0; di < N_DISPLAY; di++) {
    const ri = di + LOOKBACK;
    const { o, h, l, c } = raw[ri];
    candles.push({ i: di, o, h, l, c });

    const tk = (pHigh(raw, ri, 9)  + pLow(raw, ri, 9))  / 2;  // Tenkan-sen
    const kj = (pHigh(raw, ri, 26) + pLow(raw, ri, 26)) / 2;  // Kijun-sen
    tenkanLine.push({ i: di, v: tk });
    kijunLine.push({ i: di, v: kj });

    // Senkou Span A and B: plotted 26 periods into the future
    const spanA = (tk + kj) / 2;
    const spanB = (pHigh(raw, ri, 52) + pLow(raw, ri, 52)) / 2;
    cloudPts.push({ i: di + 26, a: spanA, b: spanB });
}

// Chikou Span: current close shifted 26 periods into the past
for (let di = 26; di < N_DISPLAY; di++) {
    chikou.push({ i: di - 26, v: candles[di].c });
}

// Scales — x covers display range plus 26 future cloud periods
const X_TOTAL = N_DISPLAY + 26;
const x = d3.scaleLinear().domain([0, X_TOTAL]).range([0, iw]);
const xMid = i => x(i + 0.5);
const candleW = Math.max(1.5, (x(1) - x(0)) * 0.72);

const allY = [
    ...candles.flatMap(d => [d.h, d.l]),
    ...cloudPts.flatMap(d => [d.a, d.b]),
    ...tenkanLine.map(d => d.v),
    ...kijunLine.map(d => d.v),
    ...chikou.map(d => d.v),
];
const ySpan = d3.max(allY) - d3.min(allY);
const y = d3.scaleLinear()
    .domain([d3.min(allY) - ySpan * 0.04, d3.max(allY) + ySpan * 0.04])
    .range([ih, 0])
    .nice();

// SVG root
const svg = d3.select("#container")
    .append("svg").attr("width", width).attr("height", height);

const g = svg.append("g").attr("transform", `translate(${margin.left},${margin.top})`);

// Clip path keeps candles and indicator lines within the chart area
svg.append("defs").append("clipPath").attr("id", "chartClip")
    .append("rect").attr("width", iw).attr("height", ih + 1);

// Y gridlines (subtle)
y.ticks(6).forEach(v => {
    g.append("line")
        .attr("x1", 0).attr("x2", iw)
        .attr("y1", y(v)).attr("y2", y(v))
        .attr("stroke", t.grid).attr("stroke-width", 1);
});

// Cloud — segment into bullish (Span A > B) and bearish (Span B > A) regions
const bullSegs = [], bearSegs = [];
if (cloudPts.length > 1) {
    let seg = [cloudPts[0]];
    let wasBull = cloudPts[0].a >= cloudPts[0].b;
    for (let i = 1; i < cloudPts.length; i++) {
        const pt = cloudPts[i];
        const isBull = pt.a >= pt.b;
        if (isBull !== wasBull) {
            const prev = cloudPts[i - 1];
            const tCross = (prev.a - prev.b) / ((prev.a - prev.b) - (pt.a - pt.b));
            const cv = prev.a + tCross * (pt.a - prev.a);
            seg.push({ i: prev.i + tCross, a: cv, b: cv });
            (wasBull ? bullSegs : bearSegs).push(seg);
            seg = [{ i: prev.i + tCross, a: cv, b: cv }, pt];
            wasBull = isBull;
        } else {
            seg.push(pt);
        }
    }
    (wasBull ? bullSegs : bearSegs).push(seg);
}

const areaGen = d3.area().x(d => xMid(d.i)).y0(d => y(d.a)).y1(d => y(d.b));

for (const seg of bullSegs) {
    g.append("path").datum(seg).attr("d", areaGen)
        .attr("fill", BULL).attr("fill-opacity", 0.22).attr("stroke", "none");
}
for (const seg of bearSegs) {
    g.append("path").datum(seg).attr("d", areaGen)
        .attr("fill", BEAR).attr("fill-opacity", 0.22).attr("stroke", "none");
}

// Span A and Span B boundary lines (dashed, inside cloud)
const lineGen = d3.line().x(d => xMid(d.i)).y(d => y(d.v));

g.append("path")
    .datum(cloudPts.map(d => ({ i: d.i, v: d.a })))
    .attr("d", lineGen).attr("fill", "none")
    .attr("stroke", BULL).attr("stroke-width", 1.5)
    .attr("stroke-opacity", 0.65).attr("stroke-dasharray", "5,3");

g.append("path")
    .datum(cloudPts.map(d => ({ i: d.i, v: d.b })))
    .attr("d", lineGen).attr("fill", "none")
    .attr("stroke", BEAR).attr("stroke-width", 1.5)
    .attr("stroke-opacity", 0.65).attr("stroke-dasharray", "5,3");

// Chikou Span — close price shifted 26 periods back
g.append("path")
    .datum(chikou).attr("d", lineGen).attr("fill", "none")
    .attr("stroke", CHIKOU).attr("stroke-width", 1.5).attr("stroke-opacity", 0.85);

// Candlesticks (clipped to chart area)
const candleG = g.append("g").attr("clip-path", "url(#chartClip)");

candleG.selectAll("line.wick").data(candles).join("line")
    .attr("x1", d => xMid(d.i)).attr("x2", d => xMid(d.i))
    .attr("y1", d => y(d.h)).attr("y2", d => y(d.l))
    .attr("stroke", d => d.c >= d.o ? BULL : BEAR)
    .attr("stroke-width", 1);

candleG.selectAll("rect.body").data(candles).join("rect")
    .attr("x", d => xMid(d.i) - candleW / 2)
    .attr("width", candleW)
    .attr("y", d => y(Math.max(d.o, d.c)))
    .attr("height", d => Math.max(1, Math.abs(y(d.o) - y(d.c))))
    .attr("fill", d => d.c >= d.o ? BULL : BEAR);

// Tenkan-sen and Kijun-sen
g.append("path")
    .datum(tenkanLine).attr("d", lineGen).attr("fill", "none")
    .attr("stroke", TENKAN).attr("stroke-width", 1.5);

g.append("path")
    .datum(kijunLine).attr("d", lineGen).attr("fill", "none")
    .attr("stroke", KIJUN).attr("stroke-width", 2);

// Dashed vertical line marking the forecast boundary
const futureX = x(N_DISPLAY);
g.append("line")
    .attr("x1", futureX).attr("x2", futureX)
    .attr("y1", 0).attr("y2", ih)
    .attr("stroke", t.inkSoft).attr("stroke-dasharray", "4,4")
    .attr("stroke-width", 1).attr("stroke-opacity", 0.4);

g.append("text")
    .attr("x", futureX + 5).attr("y", 16)
    .attr("fill", t.inkSoft).style("font-size", "12px").style("font-style", "italic")
    .text("Forecast →");

// Axes
const xAxisG = g.append("g").attr("transform", `translate(0,${ih})`).call(
    d3.axisBottom(x).ticks(8).tickFormat(d => `${Math.round(d)}`)
);
xAxisG.selectAll("text").attr("fill", t.inkSoft).style("font-size", "13px");
xAxisG.selectAll("line").attr("stroke", t.grid);
xAxisG.select(".domain").attr("stroke", t.inkSoft);

const yAxisG = g.append("g").call(
    d3.axisLeft(y).ticks(6).tickFormat(d => `$${d.toFixed(0)}`)
);
yAxisG.selectAll("text").attr("fill", t.inkSoft).style("font-size", "13px");
yAxisG.selectAll("line").attr("stroke", t.grid);
yAxisG.select(".domain").attr("stroke", t.inkSoft);

// Axis labels
g.append("text")
    .attr("x", iw / 2).attr("y", ih + 48)
    .attr("text-anchor", "middle")
    .attr("fill", t.inkSoft).style("font-size", "15px")
    .text("Trading Period");

g.append("text")
    .attr("transform", `translate(${-margin.left + 18},${ih / 2}) rotate(-90)`)
    .attr("text-anchor", "middle")
    .attr("fill", t.inkSoft).style("font-size", "15px")
    .text("Price ($)");

// Legend
const legendItems = [
    { type: "rect", color: BULL,   label: "Bullish Candle",  alpha: 1 },
    { type: "rect", color: BEAR,   label: "Bearish Candle",  alpha: 1 },
    { type: "line", color: TENKAN, label: "Tenkan-sen (9)",   w: 1.5, alpha: 1,    dash: null },
    { type: "line", color: KIJUN,  label: "Kijun-sen (26)",   w: 2,   alpha: 1,    dash: null },
    { type: "line", color: CHIKOU, label: "Chikou Span",      w: 1.5, alpha: 0.85, dash: null },
    { type: "line", color: BULL,   label: "Span A",           w: 1.5, alpha: 0.65, dash: "5,3" },
    { type: "line", color: BEAR,   label: "Span B",           w: 1.5, alpha: 0.65, dash: "5,3" },
    { type: "fill", color: BULL,   label: "Bullish Cloud",   alpha: 0.22 },
    { type: "fill", color: BEAR,   label: "Bearish Cloud",   alpha: 0.22 },
];

const lg = g.append("g").attr("transform", `translate(${iw + 14}, 8)`);
const LSP = 23;

legendItems.forEach((item, i) => {
    const ly = i * LSP;
    if (item.type === "line") {
        const ln = lg.append("line")
            .attr("x1", 0).attr("x2", 22).attr("y1", ly).attr("y2", ly)
            .attr("stroke", item.color).attr("stroke-width", item.w || 1.5)
            .attr("stroke-opacity", item.alpha || 1);
        if (item.dash) ln.attr("stroke-dasharray", item.dash);
    } else {
        lg.append("rect")
            .attr("x", 0).attr("y", ly - 6)
            .attr("width", 22).attr("height", 12)
            .attr("fill", item.color)
            .attr("fill-opacity", item.alpha);
    }
    lg.append("text")
        .attr("x", 28).attr("y", ly + 5)
        .attr("fill", t.inkSoft).style("font-size", "13px")
        .text(item.label);
});

// Title
svg.append("text")
    .attr("x", margin.left + iw / 2).attr("y", 50)
    .attr("text-anchor", "middle")
    .attr("fill", t.ink)
    .style("font-size", "22px").style("font-weight", "600")
    .text("indicator-ichimoku · javascript · d3 · anyplot.ai");
Runnable source as JSON, for any HTTP client: https://api.anyplot.ai/specs/indicator-ichimoku/d3/code. Any spec id and library id listed in llms-full.txt fit the same URL shape; every URL below is complete and callable.
{
  "spec_id": "indicator-ichimoku",
  "language": "javascript",
  "library": "d3",
  "page": "https://anyplot.ai/indicator-ichimoku/javascript/d3",
  "hub": "https://anyplot.ai/indicator-ichimoku",
  "code_json": "https://api.anyplot.ai/specs/indicator-ichimoku/d3/code",
  "spec_json": "https://api.anyplot.ai/specs/indicator-ichimoku",
  "render_light_png": "https://storage.googleapis.com/anyplot-images/plots/indicator-ichimoku/javascript/d3/plot-light.png",
  "render_dark_png": "https://storage.googleapis.com/anyplot-images/plots/indicator-ichimoku/javascript/d3/plot-dark.png",
  "interactive_light_html": "https://storage.googleapis.com/anyplot-images/plots/indicator-ichimoku/javascript/d3/plot-light.html",
  "interactive_dark_html": "https://storage.googleapis.com/anyplot-images/plots/indicator-ichimoku/javascript/d3/plot-dark.html",
  "quality_score": 91.0,
  "license": "MIT",
  "guide": "https://anyplot.ai/llms.txt"
}
Part of Ichimoku Cloud Technical Indicator Chart on anyplot.ai.