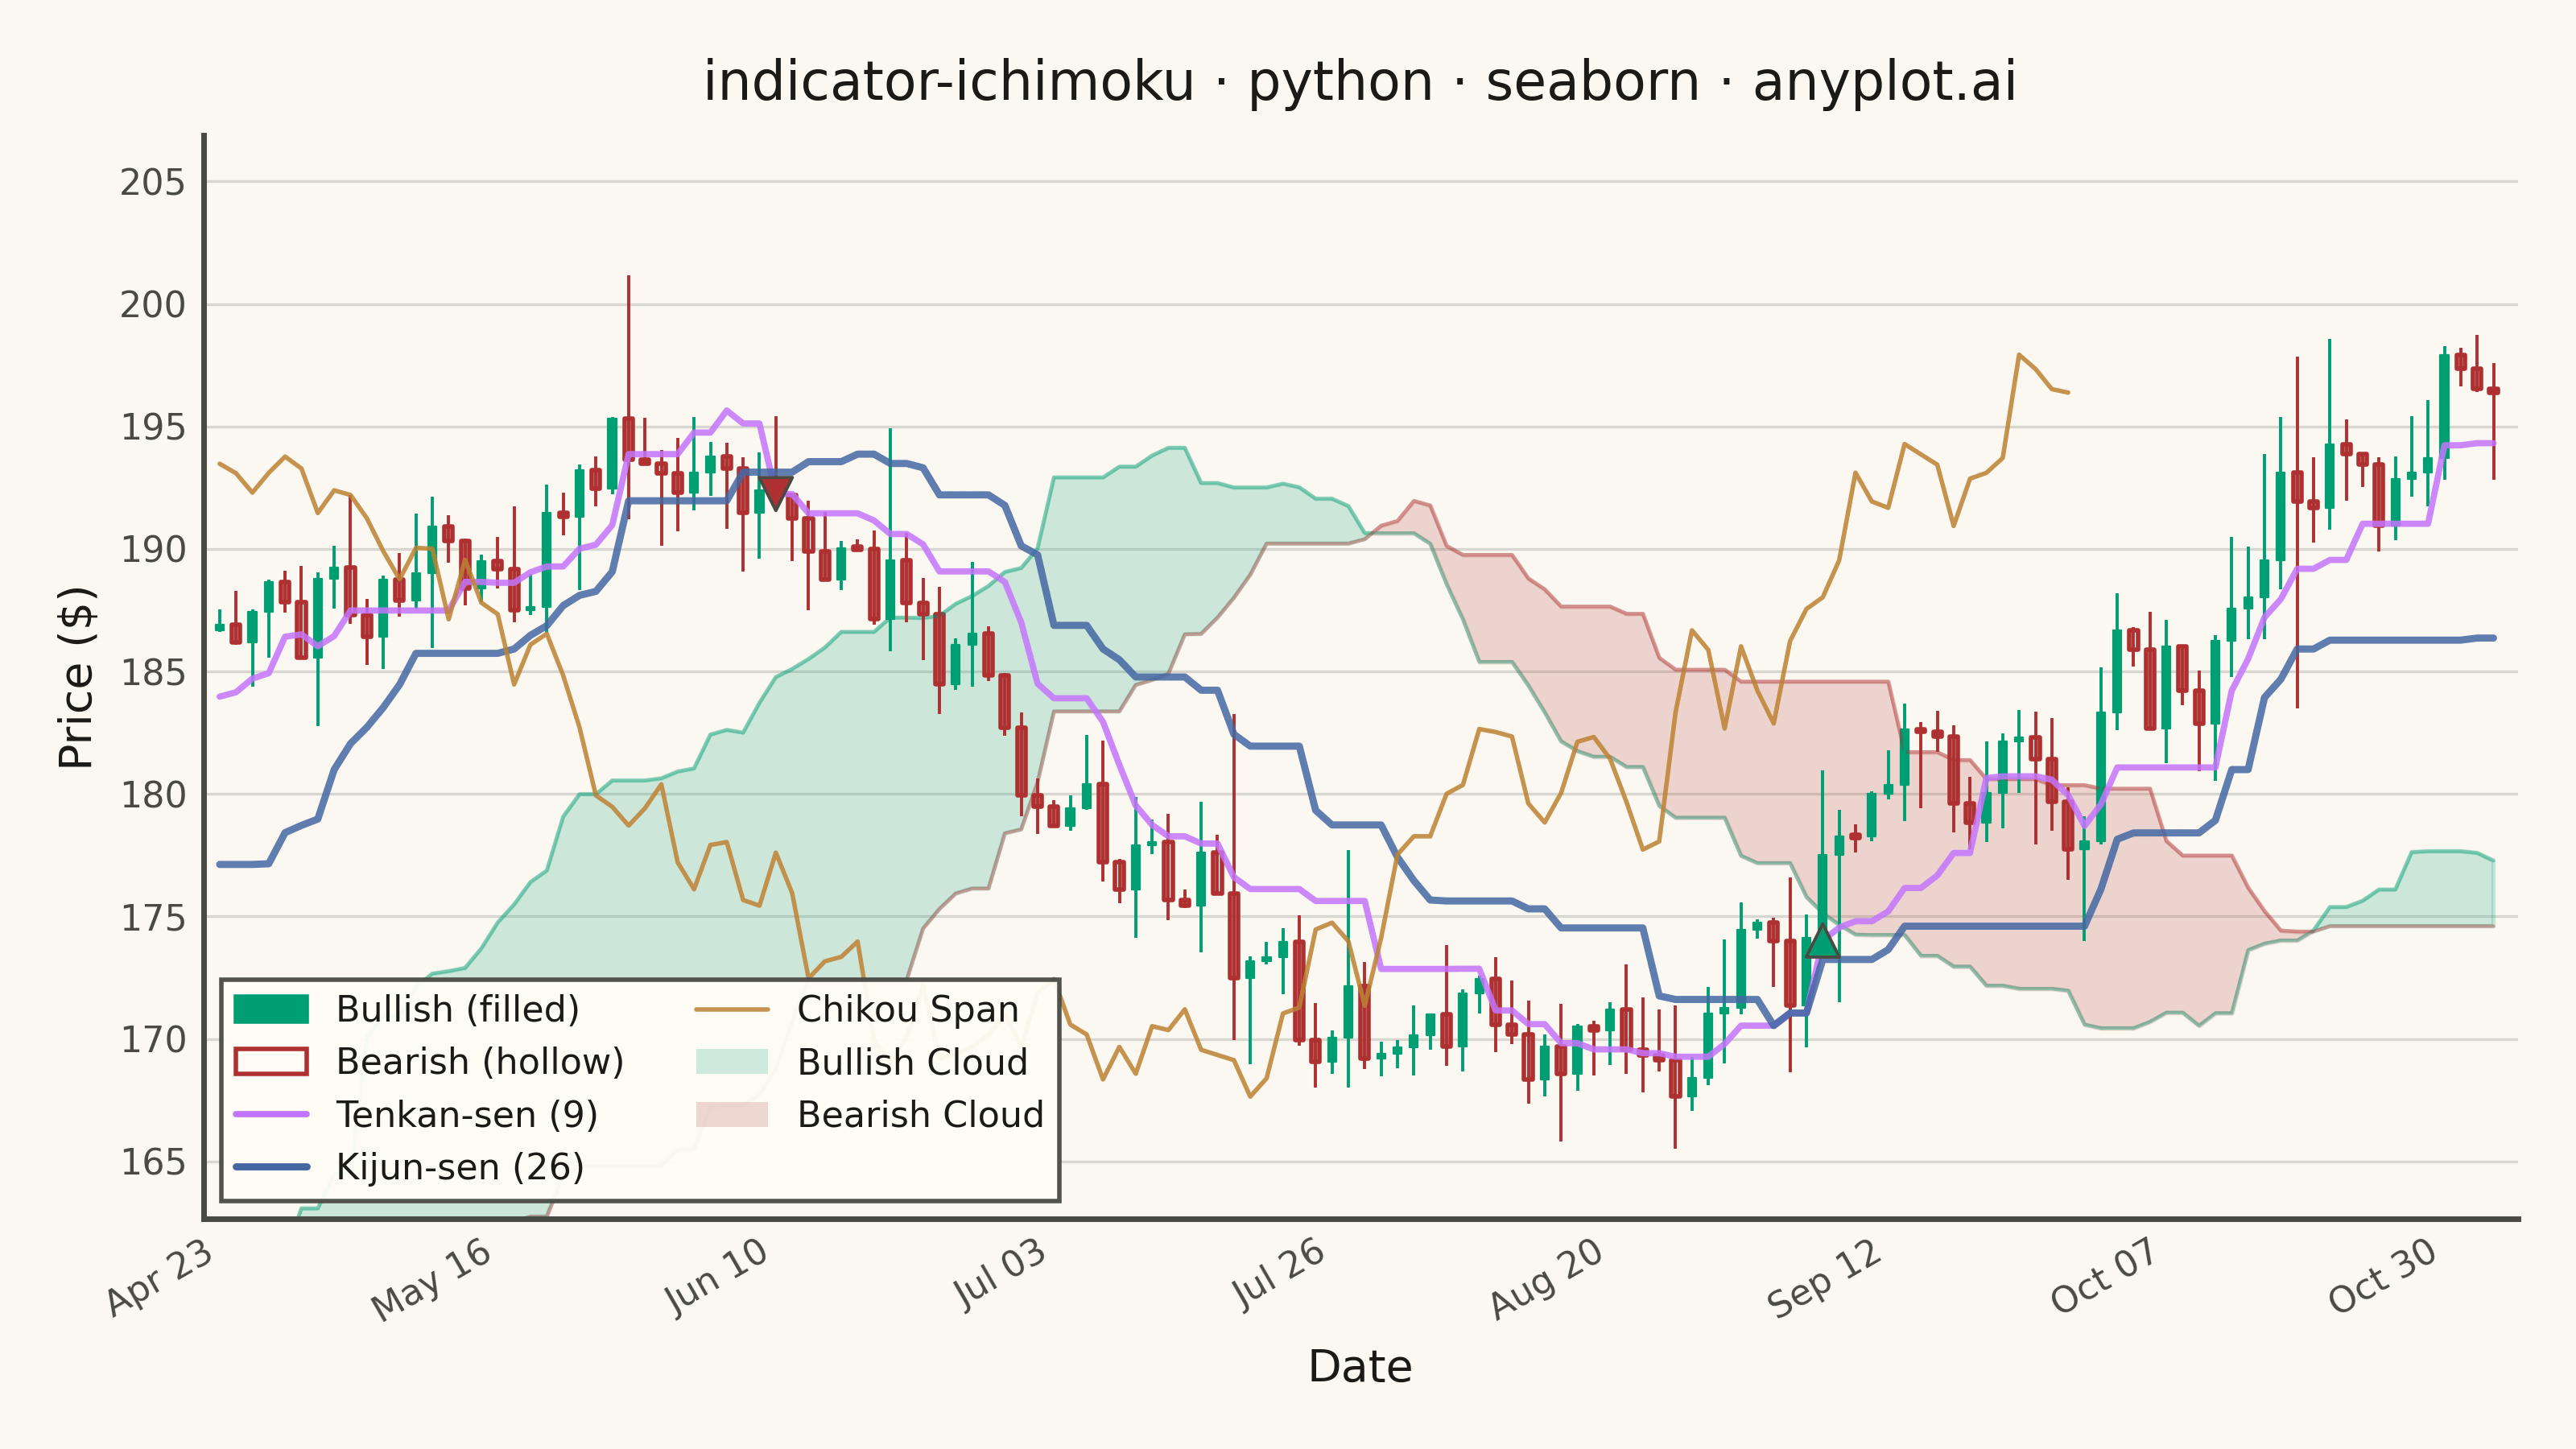
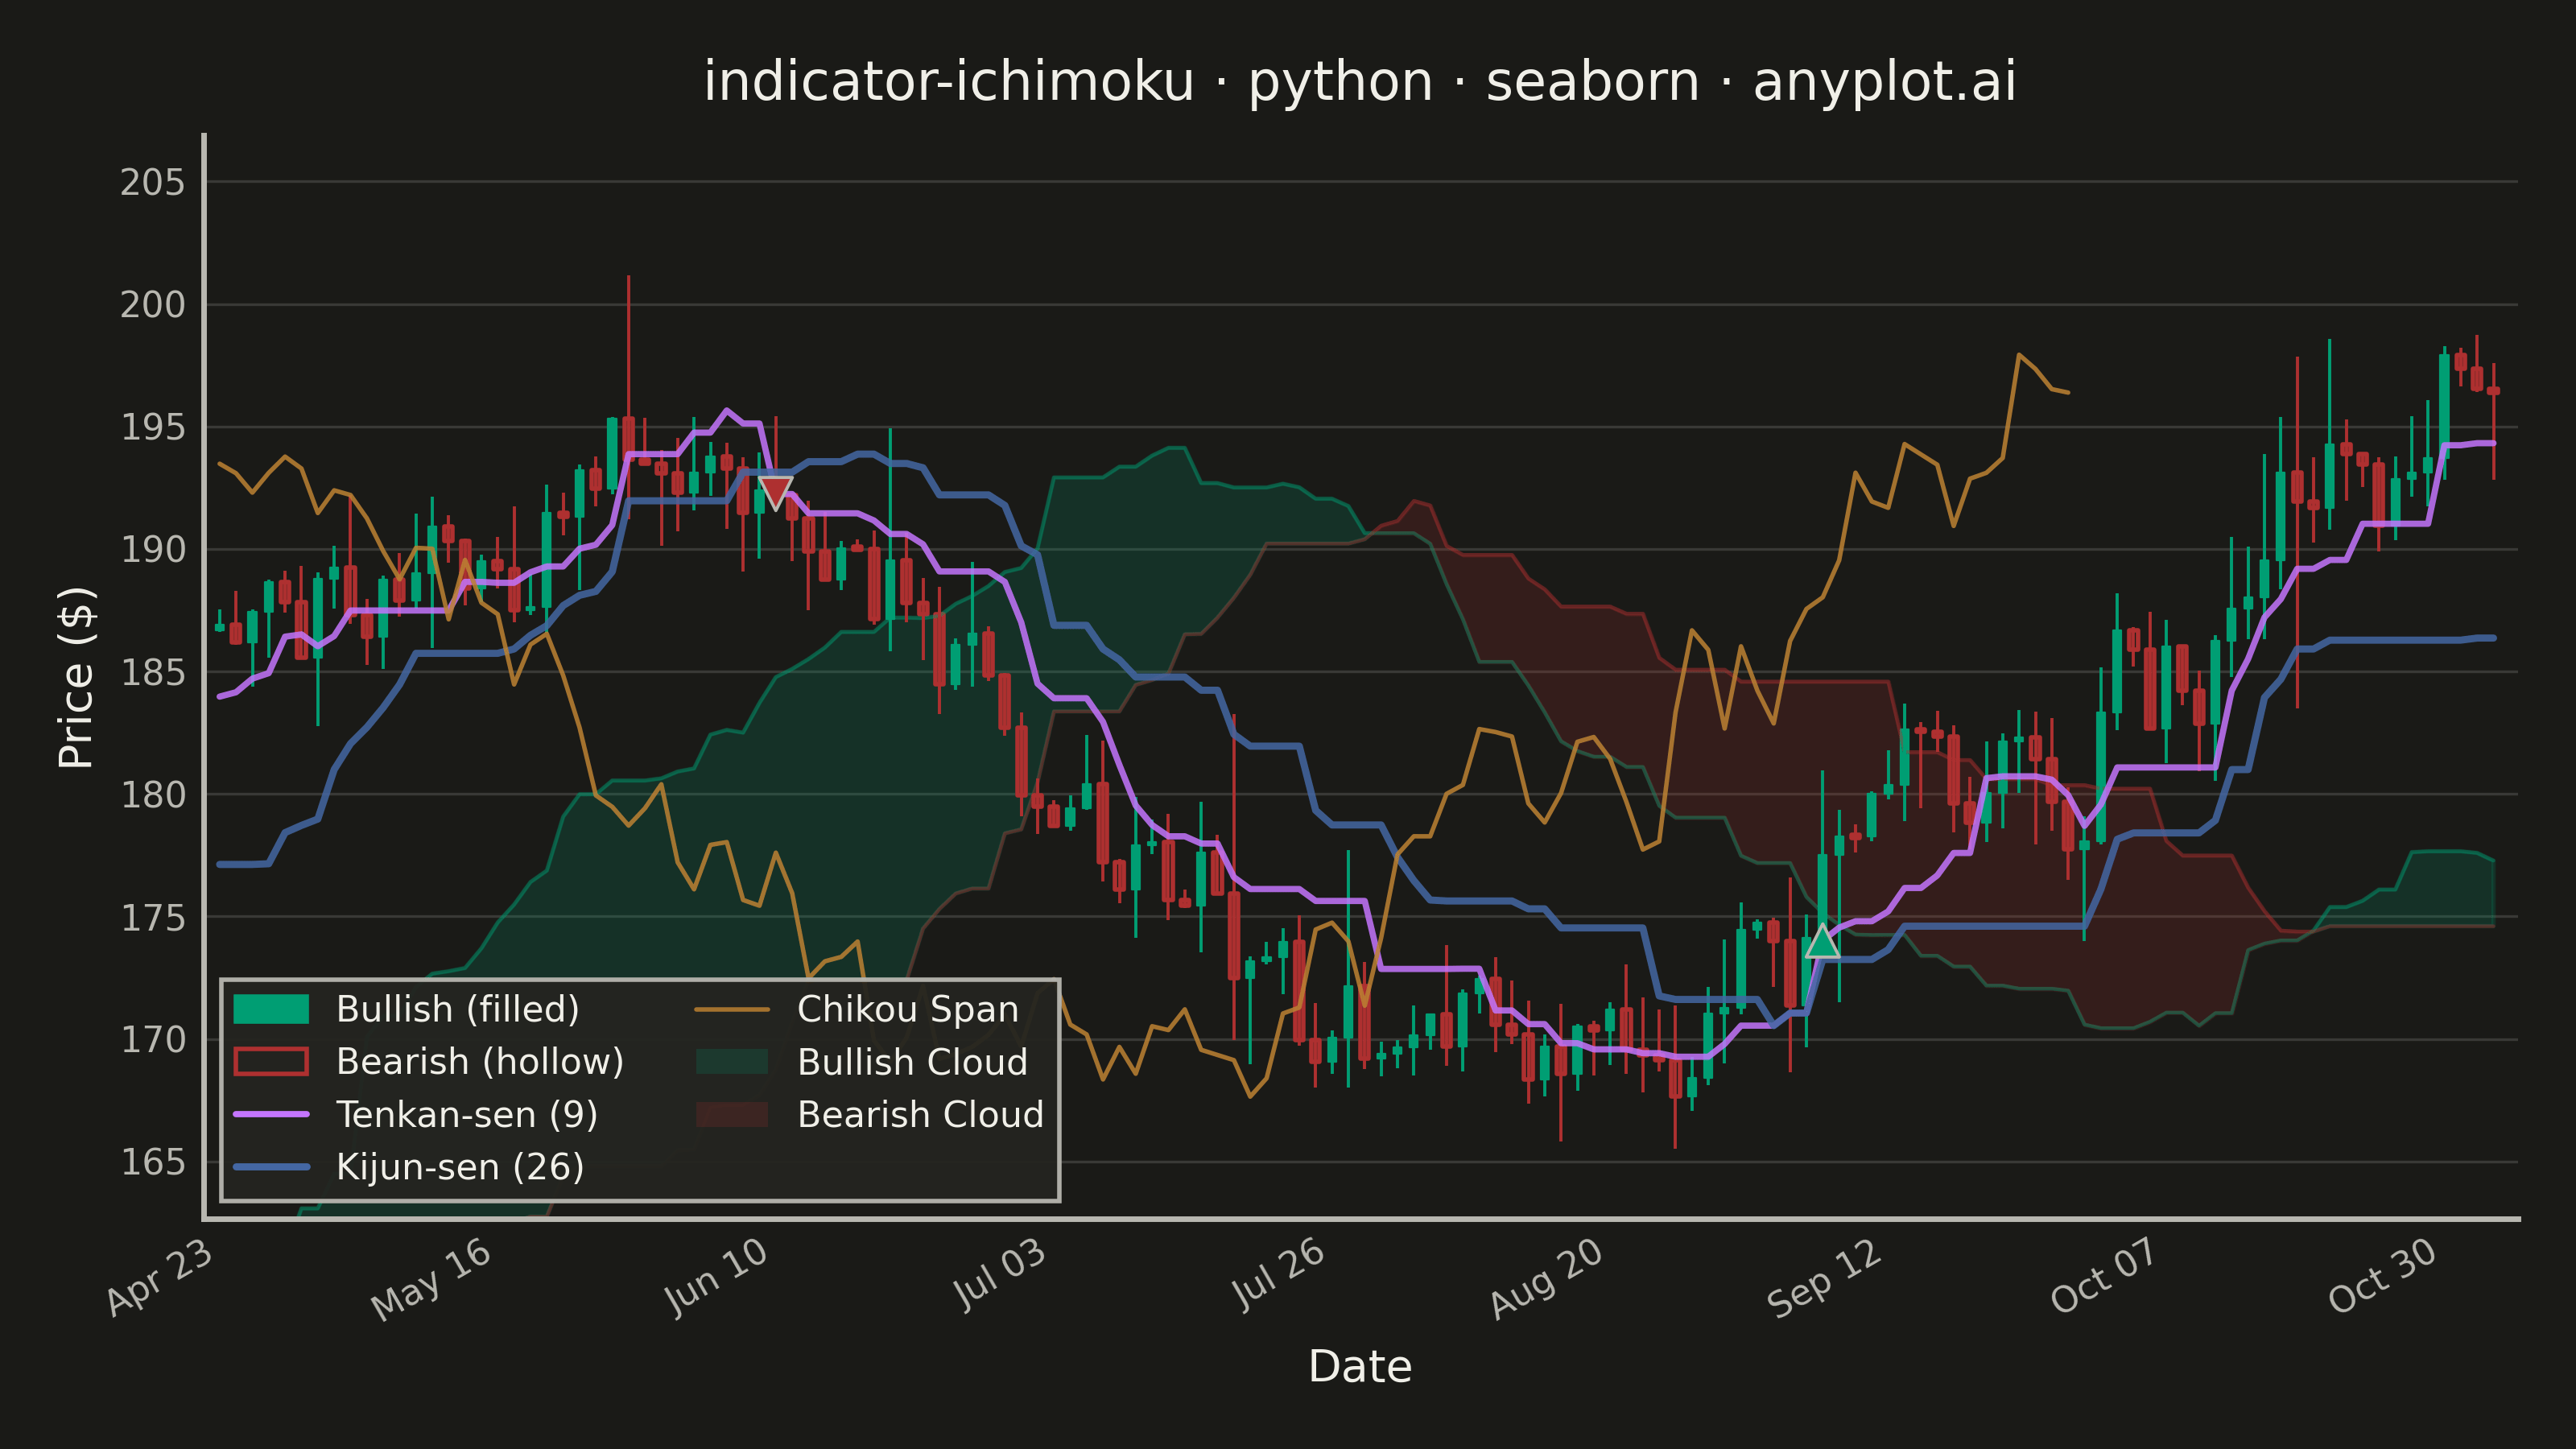
Displays the Ichimoku Kinko Hyo ("one glance equilibrium chart") overlay on a candlestick price chart. The indicator plots five lines — Tenkan-sen (conversion), Kijun-sen (base), Senkou Span A, Senkou Span B, and Chikou Span (lagging) — with the area between Senkou Span A and B filled as the "Kumo" (cloud). The cloud color changes depending on which span is on top, providing an at-a-glance view of trend direction, momentum, and support/resistance zones.
""" anyplot.ai
indicator-ichimoku: Ichimoku Cloud Technical Indicator Chart
Library: seaborn 0.13.2 | Python 3.13.13
Quality: 90/100 | Updated: 2026-06-08
"""

import os

import matplotlib.pyplot as plt
import numpy as np
import pandas as pd
import seaborn as sns
from matplotlib.collections import PatchCollection
from matplotlib.lines import Line2D
from matplotlib.patches import Patch, Rectangle


# Theme tokens — Imprint palette, theme-adaptive chrome
THEME = os.getenv("ANYPLOT_THEME", "light")
PAGE_BG = "#FAF8F1" if THEME == "light" else "#1A1A17"
ELEVATED_BG = "#FFFDF6" if THEME == "light" else "#242420"
INK = "#1A1A17" if THEME == "light" else "#F0EFE8"
INK_SOFT = "#4A4A44" if THEME == "light" else "#B8B7B0"

# Imprint palette — semantic exception: green/red for conventional financial up/down
UP_COLOR = "#009E73"  # Imprint position 1, brand green — bullish candles and cloud
DOWN_COLOR = "#AE3030"  # Imprint position 5, matte red — bearish candles and cloud
TENKAN_COLOR = "#C475FD"  # Imprint position 2, lavender — Tenkan-sen
KIJUN_COLOR = "#4467A3"  # Imprint position 3, blue — Kijun-sen
CHIKOU_COLOR = "#BD8233"  # Imprint position 4, ochre — Chikou Span

sns.set_theme(
    style="ticks",
    rc={
        "figure.facecolor": PAGE_BG,
        "axes.facecolor": PAGE_BG,
        "axes.edgecolor": INK_SOFT,
        "axes.labelcolor": INK,
        "text.color": INK,
        "xtick.color": INK_SOFT,
        "ytick.color": INK_SOFT,
        "grid.color": INK,
        "grid.alpha": 0.15,
        "legend.facecolor": ELEVATED_BG,
        "legend.edgecolor": INK_SOFT,
    },
)

# Data — 220 trading days, seed 777
np.random.seed(777)
n_days = 220
dates = pd.date_range("2024-01-02", periods=n_days, freq="B")

price = 145.0
drift = np.concatenate(
    [
        np.linspace(0.3, 0.8, 60),
        np.linspace(0.8, -0.2, 40),
        np.linspace(-0.2, -0.7, 40),
        np.linspace(-0.7, 0.5, 45),
        np.linspace(0.5, 0.9, 35),
    ]
)
opens, highs, lows, closes = [], [], [], []
for i in range(n_days):
    change = drift[i] + np.random.randn() * 1.8
    volatility = abs(np.random.randn()) * 1.2 + 0.5
    open_price = price
    close_price = price + change
    high_price = max(open_price, close_price) + abs(np.random.randn()) * volatility
    low_price = min(open_price, close_price) - abs(np.random.randn()) * volatility
    opens.append(open_price)
    highs.append(high_price)
    lows.append(low_price)
    closes.append(close_price)
    price = close_price

df = pd.DataFrame({"date": dates, "open": opens, "high": highs, "low": lows, "close": closes})
df["bullish"] = df["close"] >= df["open"]
df["x"] = range(n_days)

# Ichimoku calculations — standard parameters (9, 26, 52)
tenkan_period, kijun_period, senkou_b_period, displacement = 9, 26, 52, 26

df["tenkan_sen"] = (df["high"].rolling(window=tenkan_period).max() + df["low"].rolling(window=tenkan_period).min()) / 2

df["kijun_sen"] = (df["high"].rolling(window=kijun_period).max() + df["low"].rolling(window=kijun_period).min()) / 2

df["senkou_span_a"] = ((df["tenkan_sen"] + df["kijun_sen"]) / 2).shift(displacement)

df["senkou_span_b"] = (
    (df["high"].rolling(window=senkou_b_period).max() + df["low"].rolling(window=senkou_b_period).min()) / 2
).shift(displacement)

df["chikou_span"] = df["close"].shift(-displacement)

# Trim to visible window — skip early NaN period
visible_start = 80
df_vis = df.iloc[visible_start:].copy()
df_vis["x"] = range(len(df_vis))

# Plot
fig, ax = plt.subplots(figsize=(8, 4.5), dpi=400, facecolor=PAGE_BG)
ax.set_facecolor(PAGE_BG)

# Cloud (Kumo) fill — subtle alpha so candles remain readable
CLOUD_ALPHA = 0.18
span_a = df_vis["senkou_span_a"].values
span_b = df_vis["senkou_span_b"].values
x_vals = df_vis["x"].values
mask_valid = ~(np.isnan(span_a) | np.isnan(span_b))
x_cloud = x_vals[mask_valid]
sa_cloud = span_a[mask_valid]
sb_cloud = span_b[mask_valid]

ax.fill_between(
    x_cloud, sa_cloud, sb_cloud, where=sa_cloud >= sb_cloud, color=UP_COLOR, alpha=CLOUD_ALPHA, interpolate=True
)
ax.fill_between(
    x_cloud, sa_cloud, sb_cloud, where=sa_cloud < sb_cloud, color=DOWN_COLOR, alpha=CLOUD_ALPHA, interpolate=True
)

# Senkou Span boundary lines via seaborn lineplot
span_df = pd.DataFrame(
    {
        "x": np.tile(x_cloud, 2),
        "value": np.concatenate([sa_cloud, sb_cloud]),
        "span": ["Senkou A"] * len(x_cloud) + ["Senkou B"] * len(x_cloud),
    }
)
sns.lineplot(
    data=span_df,
    x="x",
    y="value",
    hue="span",
    palette={"Senkou A": UP_COLOR, "Senkou B": DOWN_COLOR},
    linewidth=0.8,
    alpha=0.4,
    ax=ax,
    legend=False,
)

# Candlestick wicks
wick_colors = [UP_COLOR if b else DOWN_COLOR for b in df_vis["bullish"]]
ax.vlines(df_vis["x"], df_vis["low"], df_vis["high"], colors=wick_colors, linewidth=0.7)

# Candle bodies — bullish: filled, bearish: hollow (shape redundancy for colorblind safety)
body_width = 0.5
bull_rects, bear_rects = [], []
for _, row in df_vis.iterrows():
    body_h = abs(row["close"] - row["open"])
    bottom = min(row["open"], row["close"])
    height = max(body_h, 0.12)
    if body_h < 0.12:
        bottom = (row["open"] + row["close"]) / 2 - 0.06
    rect = Rectangle((row["x"] - body_width / 2, bottom), body_width, height)
    if row["bullish"]:
        bull_rects.append(rect)
    else:
        bear_rects.append(rect)

if bull_rects:
    ax.add_collection(PatchCollection(bull_rects, facecolors=UP_COLOR, edgecolors=UP_COLOR, linewidths=0.4))
if bear_rects:
    ax.add_collection(PatchCollection(bear_rects, facecolors="none", edgecolors=DOWN_COLOR, linewidths=1.0))

# Ichimoku indicator lines in long format for seaborn hue-based rendering
tenkan_df = df_vis[["x", "tenkan_sen"]].dropna().rename(columns={"tenkan_sen": "value"})
tenkan_df["indicator"] = "Tenkan-sen (9)"
kijun_df = df_vis[["x", "kijun_sen"]].dropna().rename(columns={"kijun_sen": "value"})
kijun_df["indicator"] = "Kijun-sen (26)"
chikou_df = df_vis[["x", "chikou_span"]].dropna().rename(columns={"chikou_span": "value"})
chikou_df["indicator"] = "Chikou Span"

indicator_df = pd.concat([tenkan_df, kijun_df, chikou_df], ignore_index=True)
indicator_palette = {"Tenkan-sen (9)": TENKAN_COLOR, "Kijun-sen (26)": KIJUN_COLOR, "Chikou Span": CHIKOU_COLOR}
indicator_sizes = {"Tenkan-sen (9)": 1.4, "Kijun-sen (26)": 1.6, "Chikou Span": 1.0}

sns.lineplot(
    data=indicator_df,
    x="x",
    y="value",
    hue="indicator",
    palette=indicator_palette,
    size="indicator",
    sizes=indicator_sizes,
    alpha=0.85,
    ax=ax,
    legend=False,
)

# TK crossover signals via seaborn scatterplot — triangles for directional clarity
tenkan_vals = df_vis["tenkan_sen"].values
kijun_vals = df_vis["kijun_sen"].values
cross_data = []
for i in range(1, len(tenkan_vals)):
    if any(np.isnan(v) for v in [tenkan_vals[i], kijun_vals[i], tenkan_vals[i - 1], kijun_vals[i - 1]]):
        continue
    prev_diff = tenkan_vals[i - 1] - kijun_vals[i - 1]
    curr_diff = tenkan_vals[i] - kijun_vals[i]
    if prev_diff <= 0 < curr_diff:
        cross_data.append({"x": df_vis["x"].iloc[i], "y": tenkan_vals[i], "signal": "Bullish TK Cross"})
    elif prev_diff >= 0 > curr_diff:
        cross_data.append({"x": df_vis["x"].iloc[i], "y": tenkan_vals[i], "signal": "Bearish TK Cross"})

if cross_data:
    cross_df = pd.DataFrame(cross_data)
    sns.scatterplot(
        data=cross_df,
        x="x",
        y="y",
        hue="signal",
        palette={"Bullish TK Cross": UP_COLOR, "Bearish TK Cross": DOWN_COLOR},
        style="signal",
        markers={"Bullish TK Cross": "^", "Bearish TK Cross": "v"},
        s=55,
        edgecolor=INK_SOFT,
        linewidth=0.7,
        zorder=10,
        ax=ax,
        legend=False,
    )

# X-axis date labels
tick_step = max(1, len(df_vis) // 8)
tick_idx = list(range(0, len(df_vis), tick_step))
ax.set_xticks(tick_idx)
ax.set_xticklabels(
    [df_vis.iloc[i]["date"].strftime("%b %d") for i in tick_idx], rotation=30, ha="right", fontsize=8, color=INK_SOFT
)

# Style
ax.set_xlabel("Date", fontsize=10, color=INK)
ax.set_ylabel("Price ($)", fontsize=10, color=INK)
ax.set_title("indicator-ichimoku · python · seaborn · anyplot.ai", fontsize=12, fontweight="medium", color=INK, pad=8)
ax.tick_params(axis="y", labelsize=8, colors=INK_SOFT, length=0)
ax.tick_params(axis="x", length=0)
sns.despine(ax=ax)
ax.spines["left"].set_color(INK_SOFT)
ax.spines["bottom"].set_color(INK_SOFT)
ax.yaxis.grid(True, alpha=0.15, linewidth=0.6, color=INK)
ax.xaxis.grid(False)
ax.set_axisbelow(True)

# Axis limits
ax.set_xlim(-1, len(df_vis) + 0.5)
y_pad = (df_vis["high"].max() - df_vis["low"].min()) * 0.08
ax.set_ylim(df_vis["low"].min() - y_pad, df_vis["high"].max() + y_pad * 2)

# Legend
legend_handles = [
    Patch(facecolor=UP_COLOR, edgecolor=UP_COLOR, label="Bullish (filled)"),
    Patch(facecolor="none", edgecolor=DOWN_COLOR, linewidth=1.0, label="Bearish (hollow)"),
    Line2D([0], [0], color=TENKAN_COLOR, linewidth=1.4, label="Tenkan-sen (9)"),
    Line2D([0], [0], color=KIJUN_COLOR, linewidth=1.6, label="Kijun-sen (26)"),
    Line2D([0], [0], color=CHIKOU_COLOR, linewidth=1.0, alpha=0.85, label="Chikou Span"),
    Patch(facecolor=UP_COLOR, alpha=CLOUD_ALPHA, edgecolor="none", label="Bullish Cloud"),
    Patch(facecolor=DOWN_COLOR, alpha=CLOUD_ALPHA, edgecolor="none", label="Bearish Cloud"),
]
ax.legend(
    handles=legend_handles,
    fontsize=8,
    loc="lower left",
    framealpha=0.95,
    facecolor=ELEVATED_BG,
    edgecolor=INK_SOFT,
    ncol=2,
    fancybox=False,
)

plt.tight_layout()
plt.savefig(f"plot-{THEME}.png", dpi=400, facecolor=PAGE_BG)
Runnable source as JSON, for any HTTP client: https://api.anyplot.ai/specs/indicator-ichimoku/seaborn/code. Any spec id and library id listed in llms-full.txt fit the same URL shape; every URL below is complete and callable.
{
  "spec_id": "indicator-ichimoku",
  "language": "python",
  "library": "seaborn",
  "page": "https://anyplot.ai/indicator-ichimoku/python/seaborn",
  "hub": "https://anyplot.ai/indicator-ichimoku",
  "code_json": "https://api.anyplot.ai/specs/indicator-ichimoku/seaborn/code",
  "spec_json": "https://api.anyplot.ai/specs/indicator-ichimoku",
  "render_light_png": "https://storage.googleapis.com/anyplot-images/plots/indicator-ichimoku/python/seaborn/plot-light.png",
  "render_dark_png": "https://storage.googleapis.com/anyplot-images/plots/indicator-ichimoku/python/seaborn/plot-dark.png",
  "quality_score": 90.0,
  "license": "MIT",
  "guide": "https://anyplot.ai/llms.txt"
}
Part of Ichimoku Cloud Technical Indicator Chart on anyplot.ai.