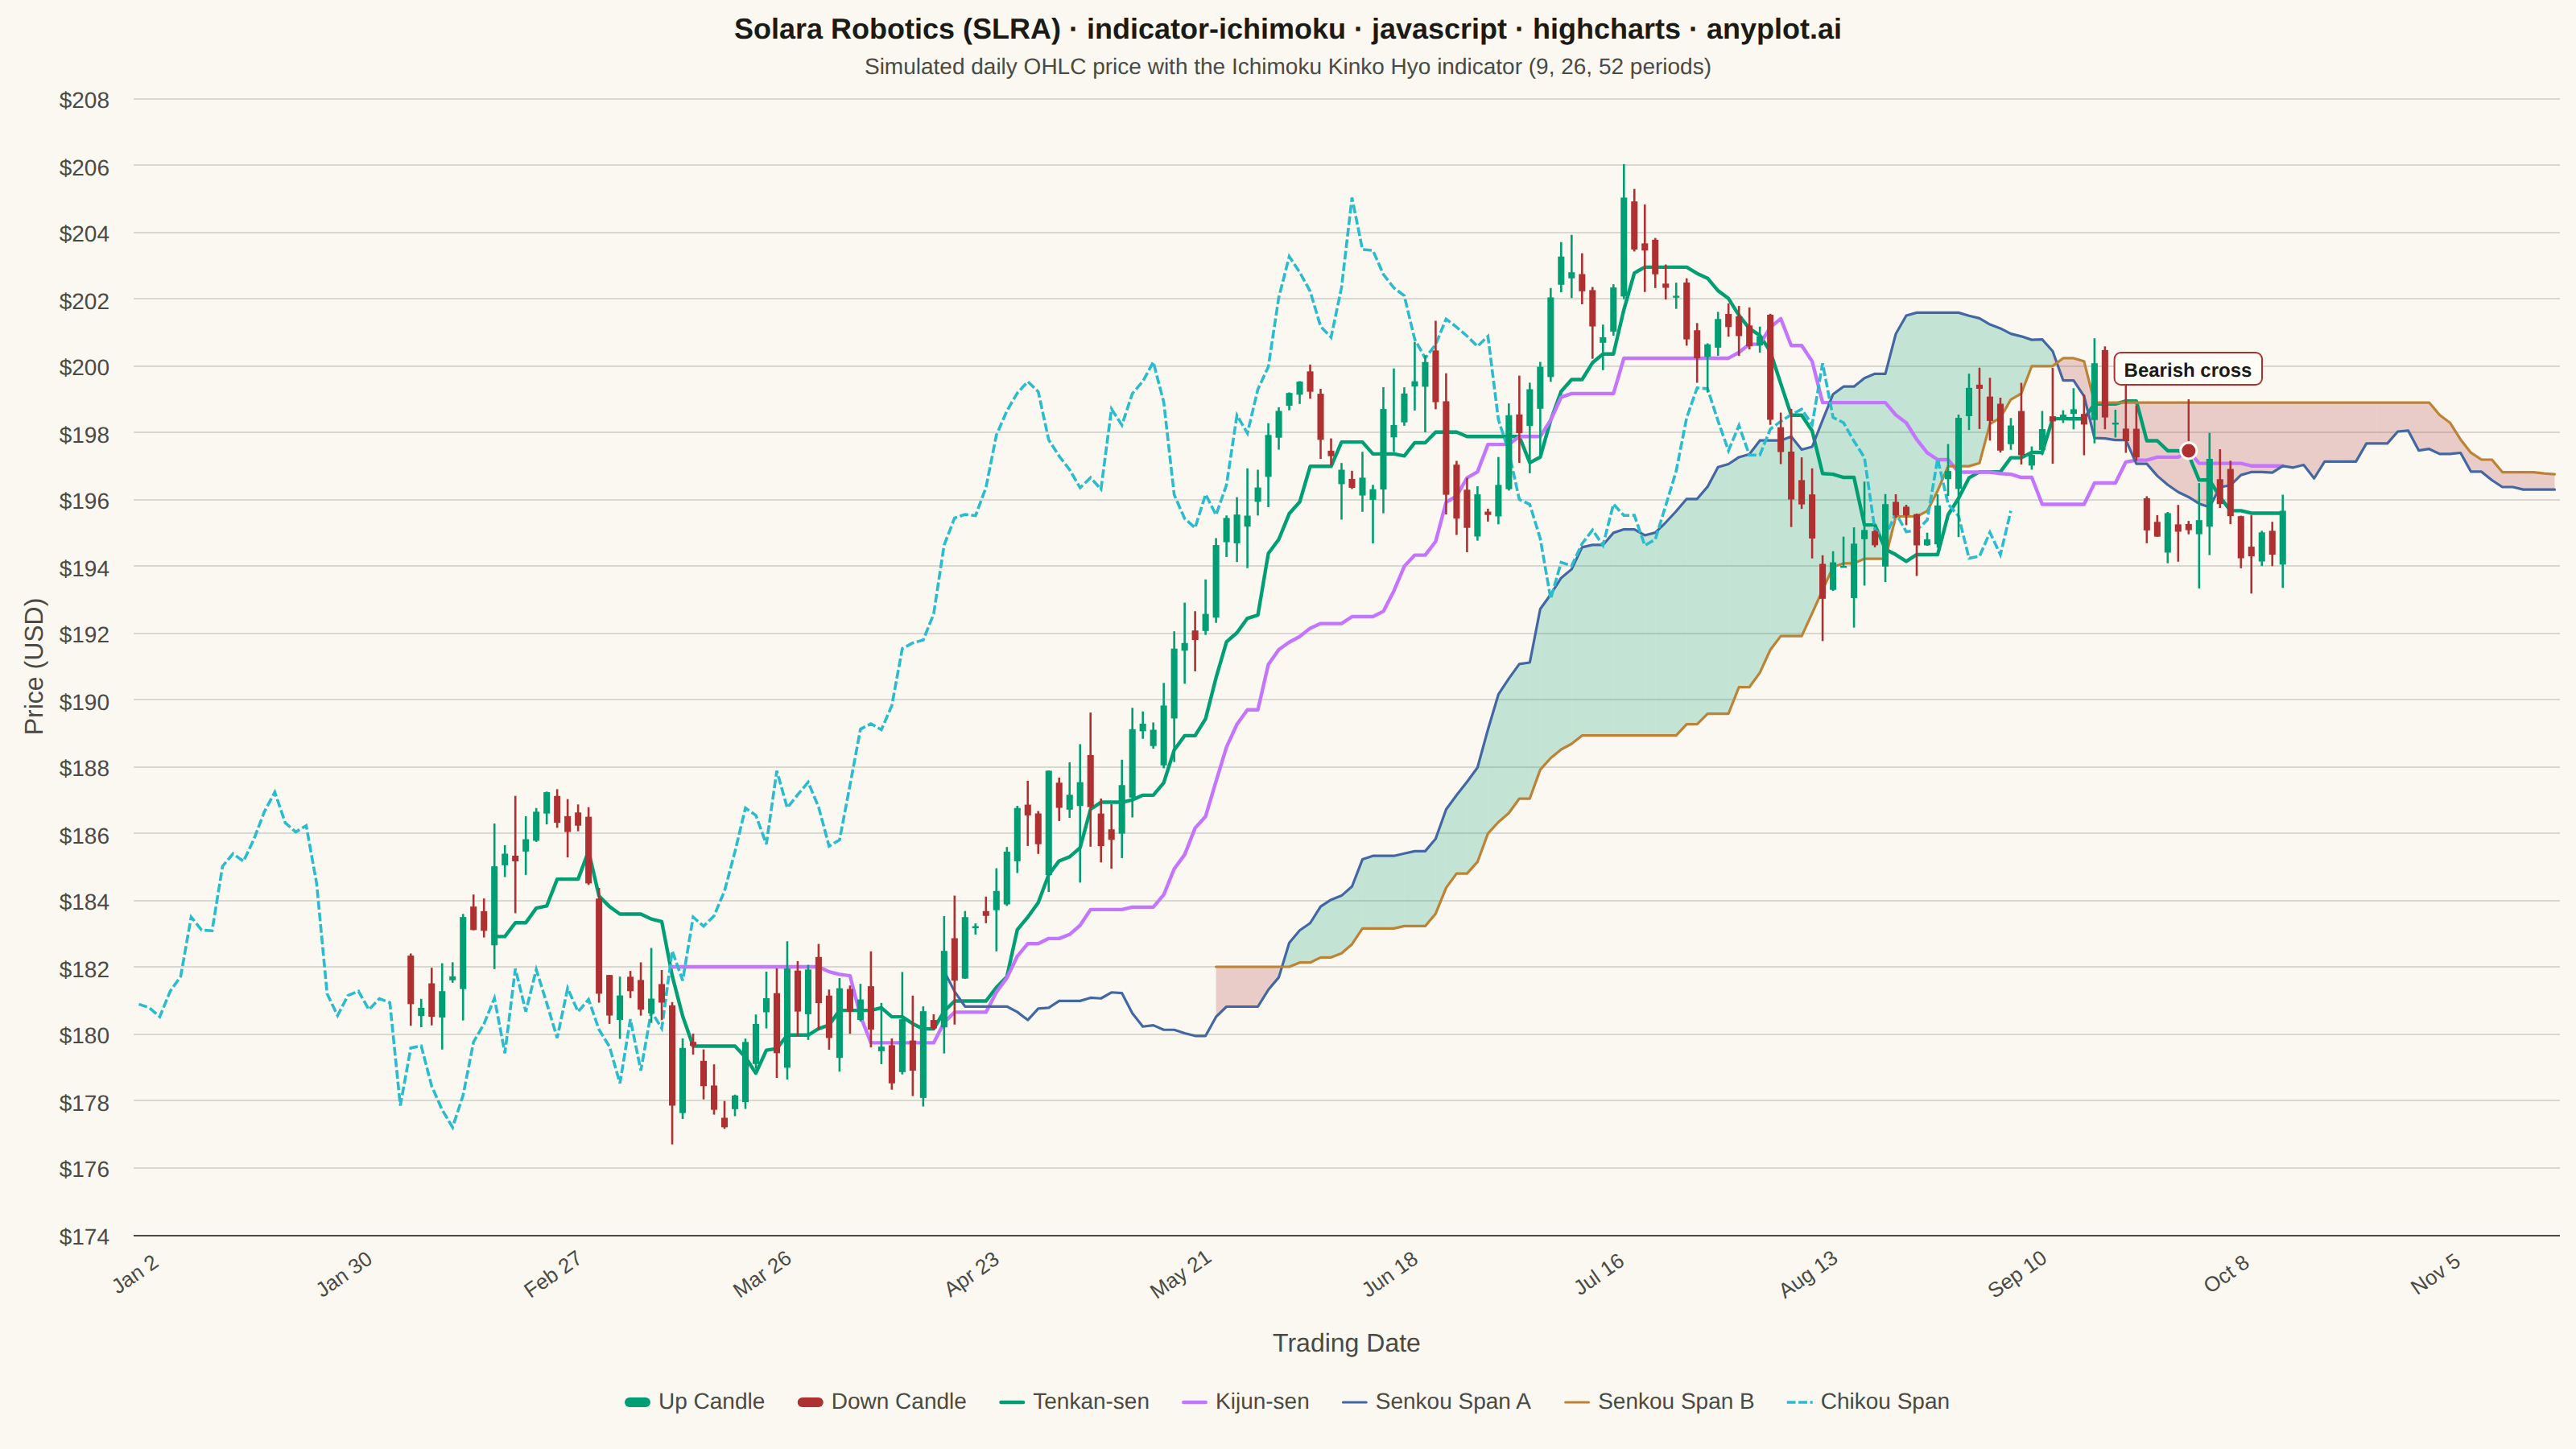
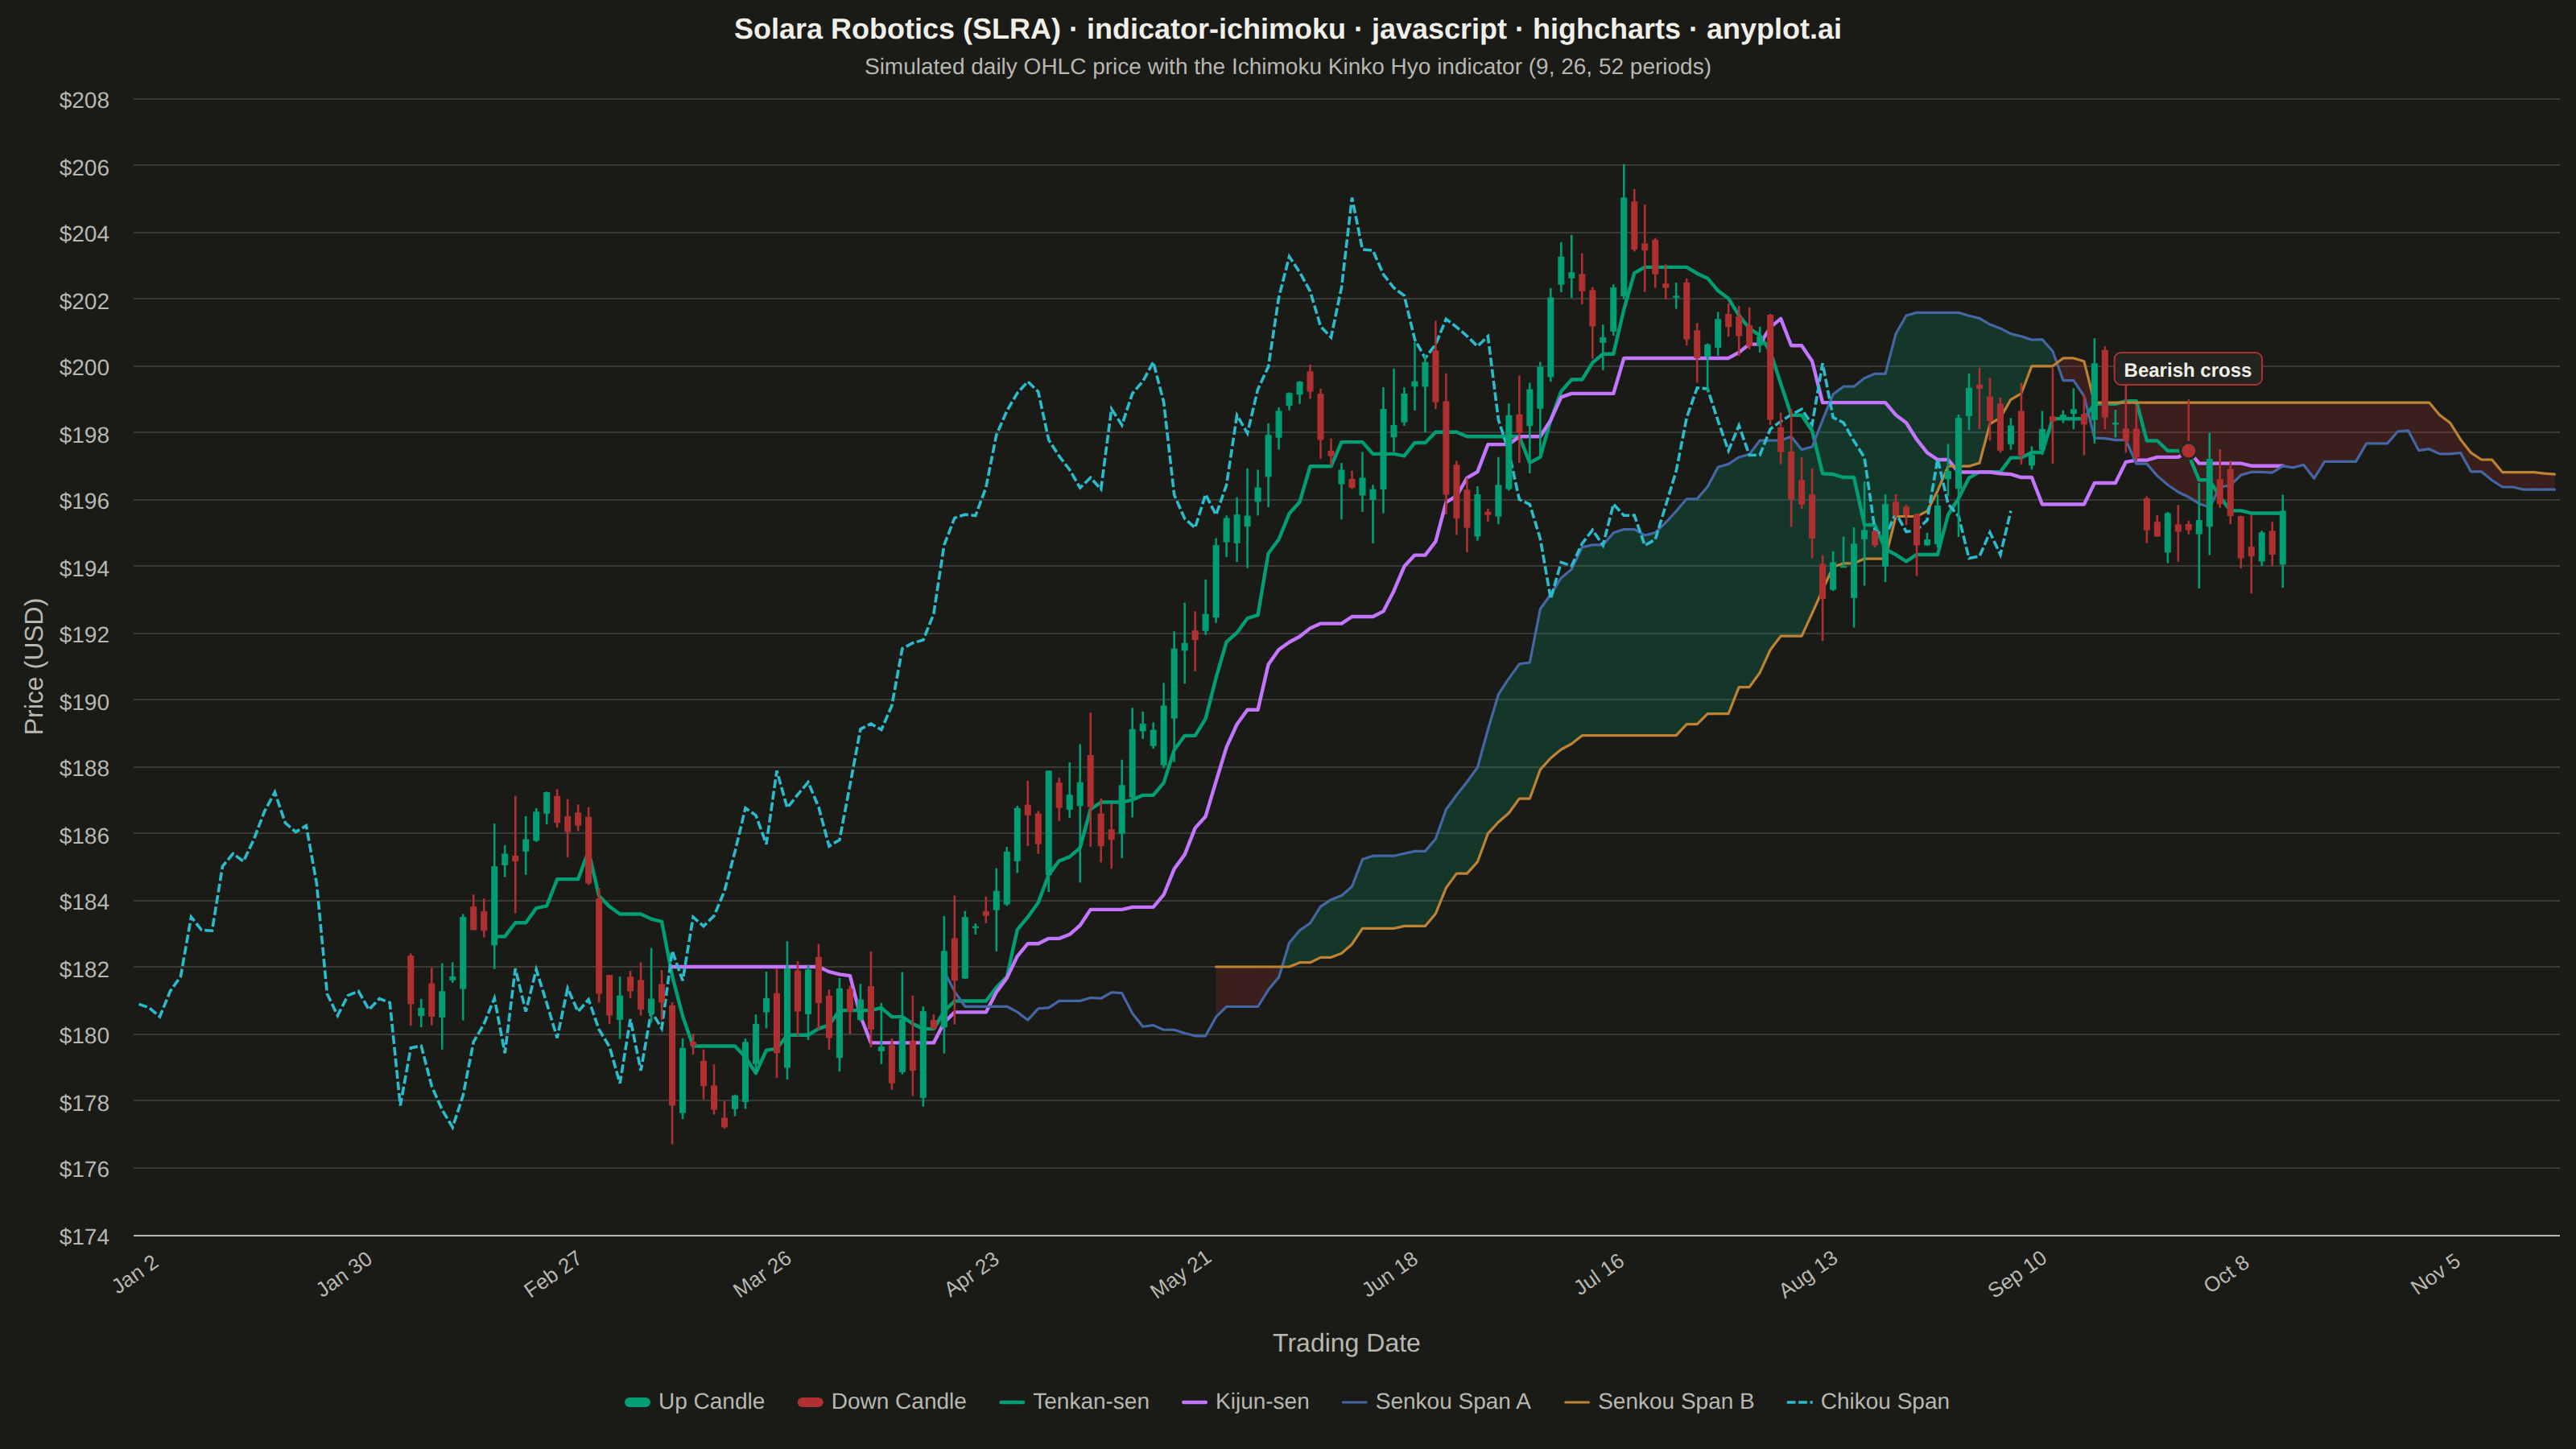
The same plot in 14 other libraries — JavaScript: Chart.js, D3.js, Apache ECharts, MUI X Charts; Python: Altair, Bokeh, lets-plot, Matplotlib, Plotly, plotnine, Pygal, Seaborn; R: ggplot2; Julia: Makie.jl. Compare all 15 side by side: Ichimoku Cloud Technical Indicator Chart in Python, R, Julia and JavaScript.
Displays the Ichimoku Kinko Hyo ("one glance equilibrium chart") overlay on a candlestick price chart. The indicator plots five lines — Tenkan-sen (conversion), Kijun-sen (base), Senkou Span A, Senkou Span B, and Chikou Span (lagging) — with the area between Senkou Span A and B filled as the "Kumo" (cloud). The cloud color changes depending on which span is on top, providing an at-a-glance view of trend direction, momentum, and support/resistance zones.
// anyplot.ai
// indicator-ichimoku: Ichimoku Cloud Technical Indicator Chart
// Library: highcharts 12.6.0 | JavaScript 22.23.2
// Quality: 91/100 | Created: 2026-08-20
//# anyplot-orientation: landscape

const t = window.ANYPLOT_TOKENS;

// --- Data: synthetic daily OHLC for a fictional robotics stock -------------
// The core Highcharts bundle has no candlestick series (that lives in the
// Highstock/highcharts-more modules, which aren't loaded), so candles and the
// Kumo cloud fill are drawn cell-by-cell with the SVG renderer instead — the
// same technique used for the heatmap grid in heatmap-basic. The five
// Ichimoku lines (Tenkan/Kijun/Senkou A/Senkou B/Chikou) are real Highcharts
// `line` series, so hovering them still shows a native tooltip.
const TENKAN_PERIOD = 9;
const KIJUN_PERIOD = 26;
const SENKOU_B_PERIOD = 52;
const CLOUD_SHIFT = 26;

const N = 180; // visible trading candles

// Deterministic LCG — the browser has no seeded RNG.
let seed = 42;
function rand() {
  seed = (seed * 1103515245 + 12345) & 0x7fffffff;
  return seed / 0x7fffffff;
}
function gaussian() {
  const u1 = Math.max(rand(), 1e-6);
  const u2 = rand();
  return Math.sqrt(-2 * Math.log(u1)) * Math.cos(2 * Math.PI * u2);
}

const BASE_PRICE = 182;
const closes = [];
let price = BASE_PRICE;
for (let i = 0; i < N; i++) {
  // Two overlaid cycles give the price a slow bullish/bearish rhythm so the
  // cloud actually flips color a few times over the window, instead of
  // drifting in one direction the whole way.
  const cyclical = 0.35 * Math.sin(i / 26) + 0.15 * Math.sin(i / 9 + 1.3);
  const drift = 0.03 + cyclical * 0.05;
  price = Math.max(20, price + drift + gaussian() * 1.1);
  closes.push(price);
}

const opens = [];
const highs = [];
const lows = [];
for (let i = 0; i < N; i++) {
  const prevClose = i === 0 ? BASE_PRICE : closes[i - 1];
  const open = prevClose + gaussian() * 0.4;
  const range = Math.abs(gaussian()) * 1.6 + 0.6;
  opens.push(open);
  highs.push(Math.max(open, closes[i]) + range * 0.5 * rand());
  lows.push(Math.min(open, closes[i]) - range * 0.5 * rand());
}

function rollingMidpoint(period, i) {
  const start = i - period + 1;
  if (start < 0) return null;
  let hi = -Infinity;
  let lo = Infinity;
  for (let k = start; k <= i; k++) {
    if (highs[k] > hi) hi = highs[k];
    if (lows[k] < lo) lo = lows[k];
  }
  return (hi + lo) / 2;
}

const tenkan = closes.map((_, i) => rollingMidpoint(TENKAN_PERIOD, i));
const kijun = closes.map((_, i) => rollingMidpoint(KIJUN_PERIOD, i));
const senkouB = closes.map((_, i) => rollingMidpoint(SENKOU_B_PERIOD, i));
const senkouA = closes.map((_, i) => (tenkan[i] != null && kijun[i] != null ? (tenkan[i] + kijun[i]) / 2 : null));

// Most recent Tenkan/Kijun crossover — the classic Ichimoku entry/exit
// signal — gives the chart a specific focal callout beyond the cloud's
// general bullish/bearish tint.
function findLastCrossover() {
  let result = null;
  for (let i = TENKAN_PERIOD; i < N - 1; i++) {
    if (tenkan[i] == null || kijun[i] == null || tenkan[i + 1] == null || kijun[i + 1] == null) continue;
    const d0 = tenkan[i] - kijun[i];
    const d1 = tenkan[i + 1] - kijun[i + 1];
    if (d0 === 0) continue;
    if ((d0 < 0 && d1 >= 0) || (d0 > 0 && d1 <= 0)) result = { i: i + 1, bullish: d1 >= 0 };
  }
  return result;
}
const LAST_CROSS = findLastCrossover();

// Chronological x-index: candles sit at i + CLOUD_SHIFT so the chikou span
// (i - CLOUD_SHIFT) and the leading spans (i + 2*CLOUD_SHIFT) never go
// negative on the axis, while the spacing between them still reflects the
// real 26-period shift.
const candleX = (i) => i + CLOUD_SHIFT;
const chikouX = (i) => i;
const senkouX = (i) => i + 2 * CLOUD_SHIFT;
const TOTAL_X = senkouX(N - 1);

// --- Trading-day calendar for axis labels -----------------------------------
const START_DATE = new Date(2024, 0, 2);
function addTradingDays(date, n) {
  const d = new Date(date);
  let added = 0;
  while (added < n) {
    d.setDate(d.getDate() + 1);
    const day = d.getDay();
    if (day !== 0 && day !== 6) added++;
  }
  return d;
}
const DATE_LABELS = [];
for (let x = 0; x <= TOTAL_X; x++) {
  const d = addTradingDays(START_DATE, x);
  DATE_LABELS.push(d.toLocaleDateString('en-US', { month: 'short', day: 'numeric' }));
}

// --- Colors ------------------------------------------------------------------
function hexToRgba(hex, alpha) {
  const r = parseInt(hex.slice(1, 3), 16);
  const g = parseInt(hex.slice(3, 5), 16);
  const b = parseInt(hex.slice(5, 7), 16);
  return `rgba(${r},${g},${b},${alpha})`;
}
// Finance semantic exception: profit/up -> brand green, loss/down -> matte
// red (Imprint slot 5, the deferred semantic-red anchor for loss/error).
const CANDLE_UP = t.palette[0]; // #009E73
const CANDLE_DOWN = t.palette[4]; // #AE3030
const CLOUD_BULL = hexToRgba(t.palette[0], 0.22);
const CLOUD_BEAR = hexToRgba(t.palette[4], 0.22);

// Ichimoku line series follow the canonical Imprint order, skipping slot 4
// (red) since it is already spoken for by the bearish candle/cloud semantics.
const TENKAN_COLOR = t.palette[0]; // #009E73
const KIJUN_COLOR = t.palette[1]; // #C475FD
const SENKOU_A_COLOR = t.palette[2]; // #4467A3
const SENKOU_B_COLOR = t.palette[3]; // #BD8233
const CHIKOU_COLOR = t.palette[5]; // #2ABCCD

// --- Title (fontsize scaled off the 67-char baseline) -----------------------
const TITLE_TEXT = 'Solara Robotics (SLRA) · indicator-ichimoku · javascript · highcharts · anyplot.ai';
const TITLE_FS = Math.max(Math.round(22 * Math.min(1, 67 / TITLE_TEXT.length)), 14);

// --- Manual rendering: candlesticks + Kumo cloud fill ------------------------
// Neither series type ships in the core bundle (see header note), so both are
// drawn straight into chart pixel space via the axes' own toPixels() — real
// Highcharts geometry, just not a registered series type.
const drawn = [];
function clearDrawn() {
  drawn.forEach((el) => {
    try {
      el.destroy();
    } catch (_err) {
      // already removed
    }
  });
  drawn.length = 0;
}

function drawAll() {
  const chart = this;
  clearDrawn();
  const r = chart.renderer;
  const xAxis = chart.xAxis[0];
  const yAxis = chart.yAxis[0];

  // Kumo cloud: one filled quad per candle-to-candle segment, colored by
  // which span leads at that segment (bullish = Senkou A above Senkou B).
  for (let i = TENKAN_PERIOD; i < N - 1; i++) {
    const a1 = senkouA[i];
    const b1 = senkouB[i];
    const a2 = senkouA[i + 1];
    const b2 = senkouB[i + 1];
    if (a1 == null || b1 == null || a2 == null || b2 == null) continue;
    const x1 = xAxis.toPixels(senkouX(i), false);
    const x2 = xAxis.toPixels(senkouX(i + 1), false);
    const ay1 = yAxis.toPixels(a1, false);
    const by1 = yAxis.toPixels(b1, false);
    const ay2 = yAxis.toPixels(a2, false);
    const by2 = yAxis.toPixels(b2, false);
    const bullish = a1 + a2 >= b1 + b2;
    drawn.push(
      r
        .path(['M', x1, ay1, 'L', x2, ay2, 'L', x2, by2, 'L', x1, by1, 'Z'])
        .attr({ fill: bullish ? CLOUD_BULL : CLOUD_BEAR, zIndex: 2 })
        .add()
    );
  }

  // Candlesticks — conventional green (close >= open) / red (close < open).
  const pxPerUnit = Math.abs(xAxis.toPixels(1, false) - xAxis.toPixels(0, false));
  const candleWidth = Math.max(pxPerUnit * 0.62, 2);
  for (let i = 0; i < N; i++) {
    const x = xAxis.toPixels(candleX(i), false);
    const yOpen = yAxis.toPixels(opens[i], false);
    const yClose = yAxis.toPixels(closes[i], false);
    const yHigh = yAxis.toPixels(highs[i], false);
    const yLow = yAxis.toPixels(lows[i], false);
    const color = closes[i] >= opens[i] ? CANDLE_UP : CANDLE_DOWN;
    drawn.push(r.path(['M', x, yHigh, 'L', x, yLow]).attr({ stroke: color, 'stroke-width': 1.3, zIndex: 3 }).add());
    const bodyTop = Math.min(yOpen, yClose);
    const bodyHeight = Math.max(Math.abs(yClose - yOpen), 1.2);
    drawn.push(
      r
        .rect(x - candleWidth / 2, bodyTop, candleWidth, bodyHeight)
        .attr({ fill: color, zIndex: 4 })
        .add()
    );
  }

  // Callout: dot + leader line + label on the most recent Tenkan/Kijun cross.
  if (LAST_CROSS) {
    const cx = xAxis.toPixels(candleX(LAST_CROSS.i), false);
    const cy = yAxis.toPixels(kijun[LAST_CROSS.i], false);
    const dotColor = LAST_CROSS.bullish ? CANDLE_UP : CANDLE_DOWN;
    const label = LAST_CROSS.bullish ? 'Bullish cross' : 'Bearish cross';
    const minLabelY = chart.plotTop + 16;
    const labelY = Math.max(cy - 46, minLabelY);
    drawn.push(r.path(['M', cx, cy - 6, 'L', cx, labelY + 14]).attr({ stroke: dotColor, 'stroke-width': 1.2, zIndex: 6 }).add());
    drawn.push(
      r.circle(cx, cy, 5).attr({ fill: dotColor, stroke: t.elevatedBg, 'stroke-width': 1.5, zIndex: 7 }).add()
    );
    const text = r
      .text(label, cx, labelY)
      .attr({ align: 'center', zIndex: 9 })
      .css({ color: t.ink, fontSize: '12px', fontWeight: '600' })
      .add();
    const bbox = text.getBBox();
    drawn.push(
      r
        .rect(bbox.x - 6, bbox.y - 4, bbox.width + 12, bbox.height + 6, 4)
        .attr({ fill: t.elevatedBg, stroke: dotColor, 'stroke-width': 1, zIndex: 8 })
        .add()
    );
    drawn.push(text);
  }
}

// --- Chart -------------------------------------------------------------------
Highcharts.chart('container', {
  chart: {
    backgroundColor: 'transparent',
    animation: false,
    style: { fontFamily: 'inherit' },
    events: { load: drawAll, redraw: drawAll },
  },
  credits: { enabled: false },
  colors: t.palette,
  title: {
    text: TITLE_TEXT,
    style: { color: t.ink, fontSize: TITLE_FS + 'px', fontWeight: '600' },
  },
  subtitle: {
    text: 'Simulated daily OHLC price with the Ichimoku Kinko Hyo indicator (9, 26, 52 periods)',
    style: { color: t.inkSoft, fontSize: '14px' },
  },
  xAxis: {
    categories: DATE_LABELS,
    min: 0,
    max: TOTAL_X,
    lineColor: t.inkSoft,
    tickColor: t.inkSoft,
    gridLineWidth: 0,
    labels: { style: { color: t.inkSoft, fontSize: '13px' }, step: 20, rotation: -35 },
    title: { text: 'Trading Date', style: { color: t.inkSoft, fontSize: '16px' } },
  },
  yAxis: {
    lineColor: t.inkSoft,
    tickColor: t.inkSoft,
    gridLineColor: t.grid,
    labels: { style: { color: t.inkSoft, fontSize: '14px' }, format: '${value:.0f}' },
    title: { text: 'Price (USD)', style: { color: t.inkSoft, fontSize: '16px' } },
  },
  legend: {
    itemStyle: { color: t.inkSoft, fontSize: '14px' },
    itemHoverStyle: { color: t.ink },
  },
  tooltip: {
    backgroundColor: t.elevatedBg,
    borderColor: t.inkSoft,
    style: { color: t.ink, fontSize: '13px' },
    valueDecimals: 2,
    valuePrefix: '$',
  },
  plotOptions: {
    series: { animation: false, marker: { enabled: false } },
  },
  series: [
    {
      type: 'line',
      name: 'Up Candle',
      data: [],
      color: CANDLE_UP,
      lineWidth: 6,
      showInLegend: true,
      enableMouseTracking: false,
    },
    {
      type: 'line',
      name: 'Down Candle',
      data: [],
      color: CANDLE_DOWN,
      lineWidth: 6,
      showInLegend: true,
      enableMouseTracking: false,
    },
    {
      type: 'line',
      name: 'Tenkan-sen',
      data: tenkan.map((y, i) => (y == null ? null : [candleX(i), y])).filter(Boolean),
      color: TENKAN_COLOR,
      lineWidth: 2.2,
      zIndex: 5,
    },
    {
      type: 'line',
      name: 'Kijun-sen',
      data: kijun.map((y, i) => (y == null ? null : [candleX(i), y])).filter(Boolean),
      color: KIJUN_COLOR,
      lineWidth: 2.2,
      zIndex: 5,
    },
    {
      type: 'line',
      name: 'Senkou Span A',
      data: senkouA.map((y, i) => (y == null ? null : [senkouX(i), y])).filter(Boolean),
      color: SENKOU_A_COLOR,
      lineWidth: 1.6,
      zIndex: 5,
    },
    {
      type: 'line',
      name: 'Senkou Span B',
      data: senkouB.map((y, i) => (y == null ? null : [senkouX(i), y])).filter(Boolean),
      color: SENKOU_B_COLOR,
      lineWidth: 1.6,
      zIndex: 5,
    },
    {
      type: 'line',
      name: 'Chikou Span',
      data: closes.map((y, i) => [chikouX(i), y]),
      color: CHIKOU_COLOR,
      lineWidth: 1.8,
      dashStyle: 'ShortDash',
      zIndex: 5,
    },
  ],
});
Runnable source as JSON, for any HTTP client: https://api.anyplot.ai/specs/indicator-ichimoku/highcharts/code. Any spec id and library id listed in llms-full.txt fit the same URL shape; every URL below is complete and callable.
{
  "spec_id": "indicator-ichimoku",
  "language": "javascript",
  "library": "highcharts",
  "page": "https://anyplot.ai/indicator-ichimoku/javascript/highcharts",
  "hub": "https://anyplot.ai/indicator-ichimoku",
  "code_json": "https://api.anyplot.ai/specs/indicator-ichimoku/highcharts/code",
  "spec_json": "https://api.anyplot.ai/specs/indicator-ichimoku",
  "render_light_png": "https://storage.googleapis.com/anyplot-images/plots/indicator-ichimoku/javascript/highcharts/plot-light.png",
  "render_dark_png": "https://storage.googleapis.com/anyplot-images/plots/indicator-ichimoku/javascript/highcharts/plot-dark.png",
  "interactive_light_html": "https://storage.googleapis.com/anyplot-images/plots/indicator-ichimoku/javascript/highcharts/plot-light.html",
  "interactive_dark_html": "https://storage.googleapis.com/anyplot-images/plots/indicator-ichimoku/javascript/highcharts/plot-dark.html",
  "quality_score": 91.0,
  "license": "MIT",
  "guide": "https://anyplot.ai/llms.txt"
}
Part of Ichimoku Cloud Technical Indicator Chart on anyplot.ai.